
Taboola (TBLA)
Taboola is interesting. Its rising free cash flow margin gives it more chips to play with.― StockStory Analyst Team
1. News


2. Summary
Why Taboola Is Interesting
Often appearing as those "You May Also Like" or "Recommended For You" boxes at the bottom of news articles, Taboola (NASDAQ:TBLA) operates a digital platform that recommends personalized content to users across publisher websites, helping both publishers monetize their sites and advertisers reach target audiences.
- Market share has increased this cycle as its 10% annual revenue growth over the last five years was exceptional
- Projected revenue growth of 5.4% for the next 12 months suggests its momentum from the last two years will persist
- On the flip side, its negative returns on capital show that some of its growth strategies have backfired


Taboola almost passes our quality test. If you’re a believer, the valuation seems fair.


3. Taboola (TBLA) Research Report: Q4 CY2025 Update
Content discovery platform Taboola (NASDAQ:TBLA) missed Wall Street’s revenue expectations in Q4 CY2025, but sales rose 6.4% year on year to $522.3 million. Next quarter’s revenue guidance of $453 million underwhelmed, coming in 0.9% below analysts’ estimates. Its GAAP profit of $0.17 per share was 56.6% above analysts’ consensus estimates.
Taboola (TBLA) Q4 CY2025 Highlights:
- Revenue: $522.3 million vs analyst estimates of $537.8 million (6.4% year-on-year growth, 2.9% miss)
- EPS (GAAP): $0.17 vs analyst estimates of $0.11 (56.6% beat)
- Adjusted EBITDA: $86.15 million vs analyst estimates of $84.15 million (16.5% margin, 2.4% beat)
- Revenue Guidance for Q1 CY2026 is $453 million at the midpoint, below analyst estimates of $457.1 million
- EBITDA guidance for the upcoming financial year 2026 is $229 million at the midpoint, above analyst estimates of $224.7 million
- Operating Margin: 8.4%, down from 9.6% in the same quarter last year
- Free Cash Flow Margin: 9%, down from 10.6% in the same quarter last year
- Market Capitalization: $905 million
Company Overview
Often appearing as those "You May Also Like" or "Recommended For You" boxes at the bottom of news articles, Taboola (NASDAQ:TBLA) operates a digital platform that recommends personalized content to users across publisher websites, helping both publishers monetize their sites and advertisers reach target audiences.
Taboola's technology uses algorithms and machine learning to analyze user behavior and preferences, then serves relevant content recommendations that keep readers engaged. These recommendations appear as thumbnail images with headlines, typically placed at the end of articles or in dedicated sections of publisher websites.
For publishers, Taboola offers a way to increase user engagement and generate additional revenue streams. When users click on sponsored content recommendations, publishers receive a share of the advertising revenue. Major news sites, blogs, and digital media companies integrate Taboola's widgets to monetize their traffic without relying solely on traditional display advertising.
For advertisers, Taboola provides access to massive audience reach across thousands of publisher sites. Marketers can promote their content, products, or services through native-looking recommendations that blend with the surrounding editorial content. Advertisers typically pay on a cost-per-click (CPC) basis, meaning they only pay when users actually engage with their content.
A typical use case might involve a financial services company using Taboola to promote an article about retirement planning. When users reading news on a publisher's site see and click this recommendation, they're directed to the advertiser's content, potentially becoming leads for financial products.
Taboola's platform includes analytics tools that help both publishers and advertisers track performance metrics like click-through rates, engagement time, and conversion rates. The company continuously refines its recommendation algorithms to improve relevance and performance.
Founded in 2007, Taboola has expanded its operations globally, serving markets across North America, Europe, Asia, and other regions. The company experiences some seasonality in its business, with higher advertising demand during holiday periods and promotional seasons when marketers increase their spending.
4. Advertising & Marketing Services
The sector is on the precipice of both disruption and growth as AI, programmatic advertising, and data-driven marketing reshape how things are done. For example, the advent of the Internet broadly and programmatic advertising specifically means that brand building is not a relationship business anymore but instead one based on data and technology, which could hurt traditional ad agencies. On the other hand, the companies in the sector that beef up their tech chops by automating the buying of ad inventory or facilitating omnichannel marketing, for example, stand to benefit. With or without advances in digitization and AI, the sector is still highly levered to the macro, and economic uncertainty may lead to fluctuating ad spend, particularly in cyclical industries.
Taboola's main competitors include Outbrain (NASDAQ:OB), which offers similar content recommendation services, as well as major digital advertising platforms like Google (NASDAQ:GOOGL), Meta (NASDAQ:META), and other native advertising networks such as Nativo and MGID.
5. Revenue Growth
A company’s long-term sales performance is one signal of its overall quality. Any business can put up a good quarter or two, but the best consistently grow over the long haul.
With $1.91 billion in revenue over the past 12 months, Taboola is a mid-sized business services company, which sometimes brings disadvantages compared to larger competitors benefiting from better economies of scale. On the bright side, it can still flex high growth rates because it’s working from a smaller revenue base.
As you can see below, Taboola’s 10% annualized revenue growth over the last five years was impressive. This shows it had high demand, a useful starting point for our analysis.
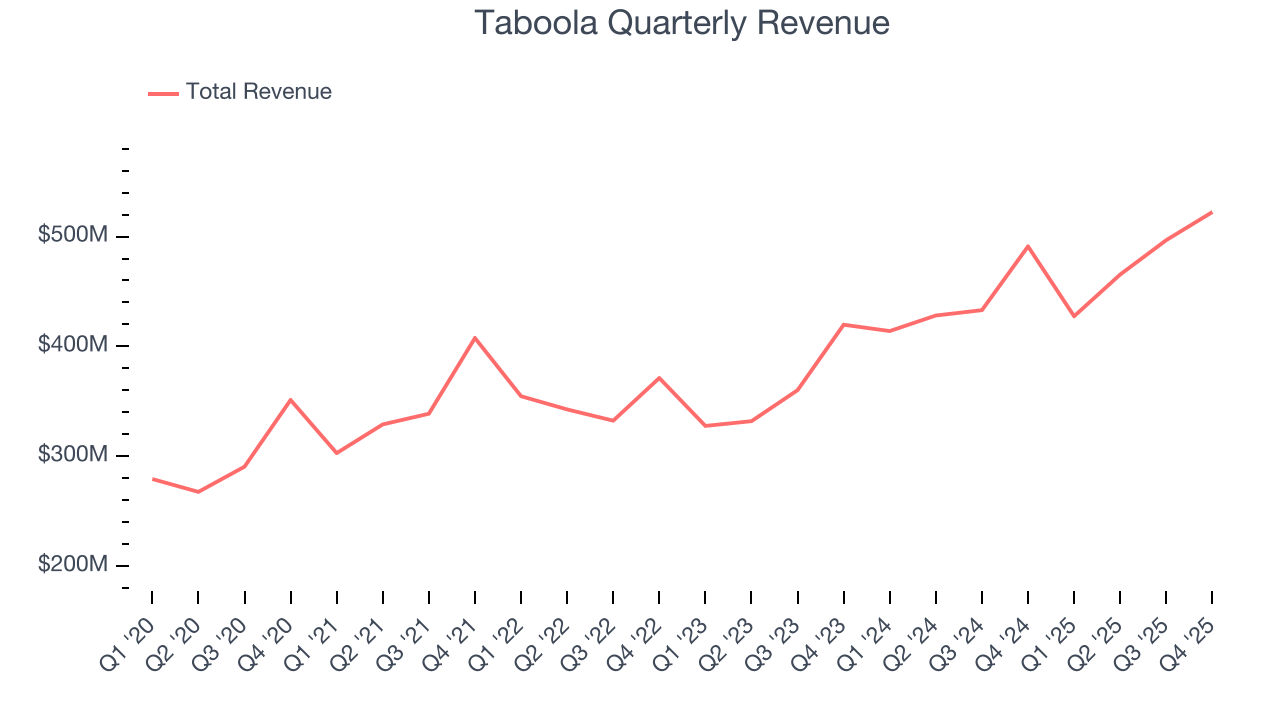
Long-term growth is the most important, but within business services, a half-decade historical view may miss new innovations or demand cycles. Taboola’s annualized revenue growth of 15.2% over the last two years is above its five-year trend, suggesting its demand was strong and recently accelerated. 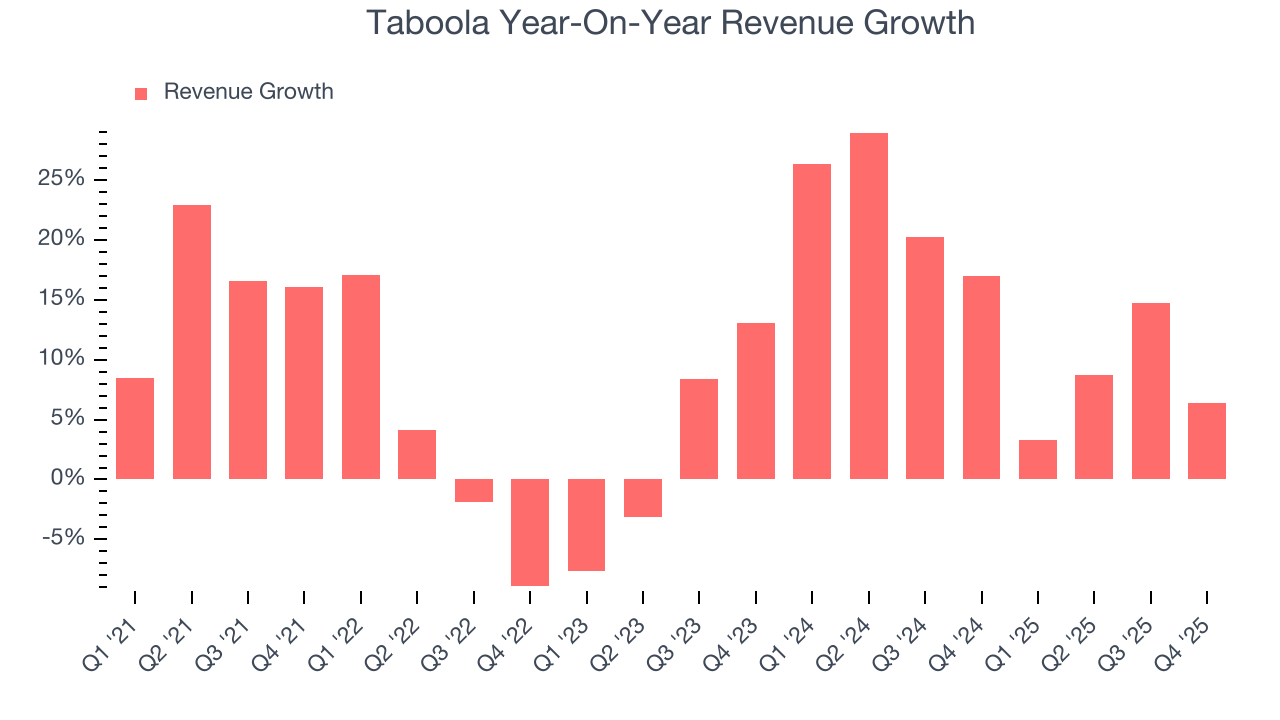
This quarter, Taboola’s revenue grew by 6.4% year on year to $522.3 million, missing Wall Street’s estimates. Company management is currently guiding for a 6% year-on-year increase in sales next quarter.
Looking further ahead, sell-side analysts expect revenue to grow 5.9% over the next 12 months, a deceleration versus the last two years. Despite the slowdown, this projection is above the sector average and implies the market is baking in some success for its newer products and services.
6. Operating Margin
Operating margin is one of the best measures of profitability because it tells us how much money a company takes home after subtracting all core expenses, like marketing and R&D.
Taboola was roughly breakeven when averaging the last five years of quarterly operating profits, one of the worst outcomes in the business services sector.
On the plus side, Taboola’s operating margin rose by 3.3 percentage points over the last five years, as its sales growth gave it operating leverage.
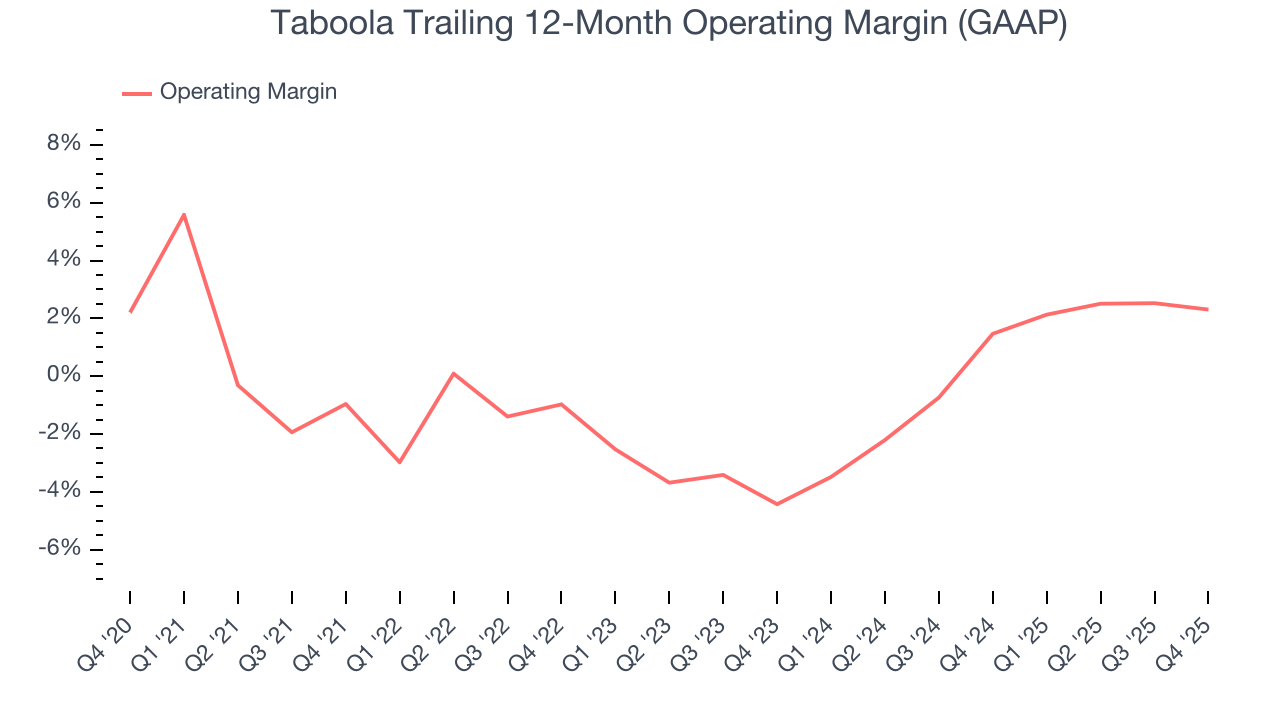
This quarter, Taboola generated an operating margin profit margin of 8.4%, down 1.2 percentage points year on year. This reduction is quite minuscule and indicates the company’s overall cost structure has been relatively stable.
7. Earnings Per Share
Revenue trends explain a company’s historical growth, but the long-term change in earnings per share (EPS) points to the profitability of that growth – for example, a company could inflate its sales through excessive spending on advertising and promotions.
Taboola’s full-year EPS flipped from negative to positive over the last five years. This is a good sign and shows it’s at an inflection point.
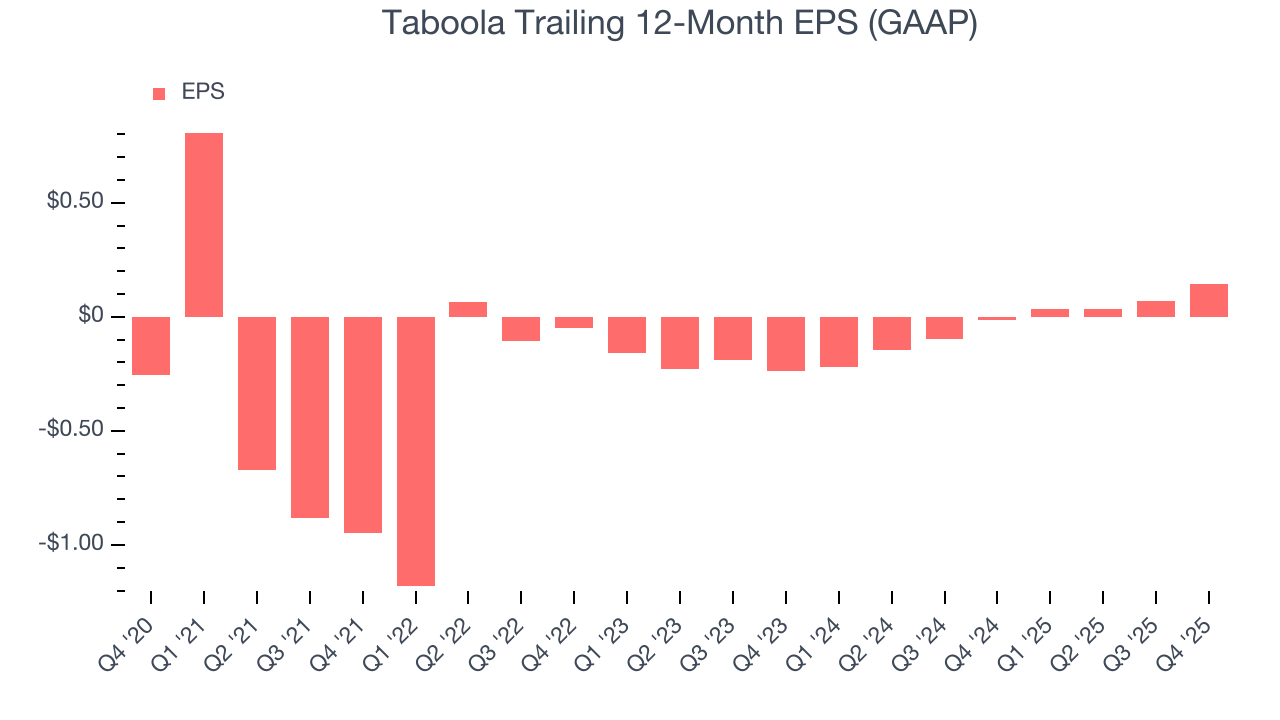
Like with revenue, we analyze EPS over a shorter period to see if we are missing a change in the business.
For Taboola, its two-year annual EPS growth of 61.4% was higher than its five-year trend. We love it when earnings growth accelerates, especially when it accelerates off an already high base.
In Q4, Taboola reported EPS of $0.17, up from $0.10 in the same quarter last year. This print easily cleared analysts’ estimates, and shareholders should be content with the results. Over the next 12 months, Wall Street expects Taboola’s full-year EPS of $0.14 to shrink by 24.2%.
8. Cash Is King
If you’ve followed StockStory for a while, you know we emphasize free cash flow. Why, you ask? We believe that in the end, cash is king, and you can’t use accounting profits to pay the bills.
Taboola has shown decent cash profitability, giving it some flexibility to reinvest or return capital to investors. The company’s free cash flow margin averaged 5.1% over the last five years, slightly better than the broader business services sector.
Taking a step back, we can see that Taboola’s margin expanded by 7.3 percentage points during that time. This is encouraging, and we can see it became a less capital-intensive business because its free cash flow profitability rose more than its operating profitability.
Taboola’s free cash flow clocked in at $46.93 million in Q4, equivalent to a 9% margin. The company’s cash profitability regressed as it was 1.6 percentage points lower than in the same quarter last year, but it’s still above its five-year average. We wouldn’t read too much into this quarter’s decline because investment needs can be seasonal, causing short-term swings. Long-term trends trump temporary fluctuations.
9. Return on Invested Capital (ROIC)
EPS and free cash flow tell us whether a company was profitable while growing its revenue. But was it capital-efficient? Enter ROIC, a metric showing how much operating profit a company generates relative to the money it has raised (debt and equity).
Taboola’s five-year average ROIC was negative 2%, meaning management lost money while trying to expand the business. Its returns were among the worst in the business services sector.
We like to invest in businesses with high returns, but the trend in a company’s ROIC is what often surprises the market and moves the stock price. Over the last few years, Taboola’s ROIC has increased. This is a good sign, but we recognize its lack of profitable growth during the COVID era was the primary reason for the change.
10. Balance Sheet Assessment
Taboola reported $122.3 million of cash and $194.1 million of debt on its balance sheet in the most recent quarter. As investors in high-quality companies, we primarily focus on two things: 1) that a company’s debt level isn’t too high and 2) that its interest payments are not excessively burdening the business.
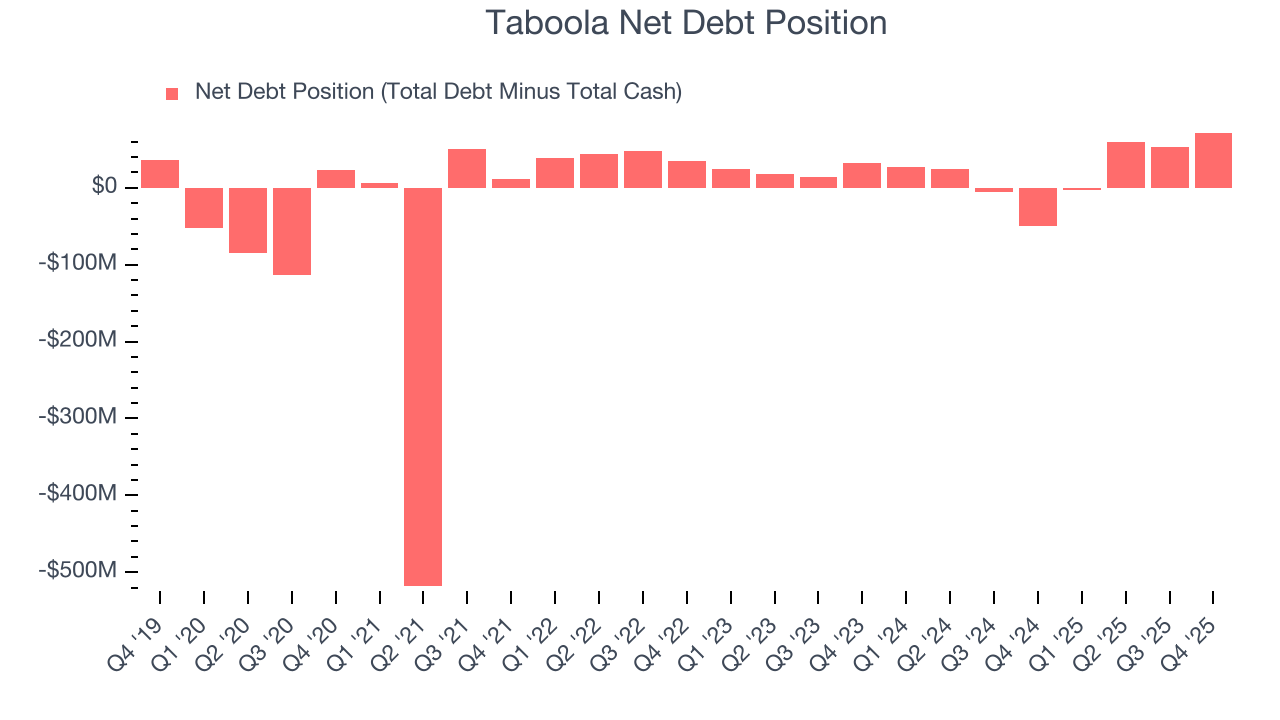
With $215.5 million of EBITDA over the last 12 months, we view Taboola’s 0.3× net-debt-to-EBITDA ratio as safe. We also see its $287,000 of annual interest expenses as appropriate. The company’s profits give it plenty of breathing room, allowing it to continue investing in growth initiatives.
11. Key Takeaways from Taboola’s Q4 Results
It was good to see Taboola beat analysts’ EPS expectations this quarter. On the other hand, its revenue missed and its revenue guidance for next quarter fell slightly short of Wall Street’s estimates. Overall, this quarter could have been better. The stock traded down 4% to $3.02 immediately after reporting.
12. Is Now The Time To Buy Taboola?
Updated: March 16, 2026 at 12:28 AM EDT
We think that the latest earnings result is only one piece of the bigger puzzle. If you’re deciding whether to own Taboola, you should also grasp the company’s longer-term business quality and valuation.
Taboola possesses a number of positive attributes. To kick things off, its revenue growth was impressive over the last five years. And while its relatively low ROIC suggests management has struggled to find compelling investment opportunities, its rising cash profitability gives it more optionality. On top of that, its rising returns show management's prior bets are starting to pay off.
Taboola’s P/E ratio based on the next 12 months is 5.1x. Looking at the business services space right now, Taboola trades at a compelling valuation. If you’re a fan of the business and management team, now is a good time to scoop up some shares.
Wall Street analysts have a consensus one-year price target of $4.79 on the company (compared to the current share price of $3.15), implying they see 52.1% upside in buying Taboola in the short term.