
Trupanion (TRUP)
We’re wary of Trupanion. Its negative returns on capital raise questions about its ability to allocate resources and generate profits.― StockStory Analyst Team
1. News


2. Summary
Why Trupanion Is Not Exciting
Born from a vision to help pet owners avoid economic euthanasia when faced with expensive veterinary bills, Trupanion (NASDAQ:TRUP) provides medical insurance for cats and dogs through data-driven, vertically-integrated products priced specifically for each pet's unique characteristics.
- Push for growth has led to negative returns on capital, signaling value destruction
- Products and services are facing profitability challenges during this cycle, as seen in its flat book value per share over the last five years
- A silver lining is that its annual revenue growth of 23.4% over the past five years was outstanding, reflecting market share gains this cycle


Trupanion lacks the business quality we seek. More profitable opportunities exist elsewhere.
Why There Are Better Opportunities Than Trupanion


Trupanion’s stock price of $26.13 implies a valuation ratio of 2.6x forward P/B. This valuation is extremely expensive, especially for the quality you get.
We’d rather invest in similarly-priced but higher-quality companies with more reliable earnings growth.
3. Trupanion (TRUP) Research Report: Q4 CY2025 Update
Pet insurance provider Trupanion (NASDAQ:TRUP) met Wall Street’s revenue expectations in Q4 CY2025, with sales up 11.7% year on year to $376.9 million. Its GAAP profit of $0.13 per share was 19.6% below analysts’ consensus estimates.
Trupanion (TRUP) Q4 CY2025 Highlights:
- Revenue: $376.9 million vs analyst estimates of $375.9 million (11.7% year-on-year growth, in line)
- Pre-tax Profit: $6.29 million (1.7% margin)
- EPS (GAAP): $0.13 vs analyst expectations of $0.16 (19.6% miss)
- Market Capitalization: $1.40 billion
Company Overview
Born from a vision to help pet owners avoid economic euthanasia when faced with expensive veterinary bills, Trupanion (NASDAQ:TRUP) provides medical insurance for cats and dogs through data-driven, vertically-integrated products priced specifically for each pet's unique characteristics.
Trupanion operates primarily through two business segments: Subscription Business and Other Business. The Subscription Business generates revenue through direct-to-consumer pet insurance products, including its flagship Trupanion-branded coverage and other offerings like "Powered by Trupanion" products marketed by third parties. In Canada, the company also offers lower-cost alternatives under the Furkin and PHI Direct brands.
The company's insurance model differs from traditional pet insurance by focusing on customized pricing based on detailed pet data—including breed, age, and location—to more accurately assess risk and set premiums. When a pet owner with Trupanion coverage visits a participating veterinarian, the company can often pay the veterinary hospital directly at checkout through its proprietary software, eliminating the traditional reimbursement process that requires pet owners to pay upfront and file claims.
Trupanion markets its products through multiple channels, with a significant focus on building relationships with veterinarians through its network of Territory Partners—independent contractors who promote Trupanion's offerings within veterinary practices. The company also acquires customers through strategic partnerships, member referrals, and direct-to-consumer marketing.
In its Other Business segment, Trupanion writes policies on behalf of third parties, including programs for the U.S. Department of Veterans Affairs and employer-sponsored benefits. The company also generates revenue through insurance software solutions that support its payment systems and underwriting capabilities.
Trupanion's insurance operations are regulated by state insurance departments in the U.S., with its primary subsidiary, American Pet Insurance Company (APIC), licensed in all 50 states. The company also operates in Canada, Continental Europe, and Australia, maintaining appropriate regulatory compliance in each market.
4. Property & Casualty Insurance
Property & Casualty (P&C) insurers protect individuals and businesses against financial loss from damage to property or from legal liability. This is a cyclical industry, and the sector benefits when there is 'hard market', characterized by strong premium rate increases that outpace loss and cost inflation, resulting in robust underwriting margins. The opposite is true in a 'soft market'. Interest rates also matter, as they determine the yields earned on fixed-income portfolios. On the other hand, P&C insurers face a major secular headwind from the increasing frequency and severity of catastrophe losses due to climate change. Furthermore, the liability side of the business is pressured by 'social inflation'—the trend of rising litigation costs and larger jury awards.
Trupanion competes with other pet insurance providers including Nationwide (NYSE:NFS), Petplan (owned by Warburg Pincus), ASPCA Pet Health Insurance (through Crum & Forster), and Embrace (part of American Modern Insurance Group), as well as newer entrants like Lemonade (NYSE:LMND) that have expanded into the pet insurance market.
5. Revenue Growth
Big picture, insurers generate revenue from three key sources. The first is the core business of underwriting policies. The second source is income from investing the “float” (premiums collected upfront not yet paid out as claims) in assets such as fixed-income assets and equities. The third is fees from various sources such as policy administration, annuities, or other value-added services. Luckily, Trupanion’s revenue grew at an incredible 23.4% compounded annual growth rate over the last five years. Its growth surpassed the average insurance company and shows its offerings resonate with customers, a great starting point for our analysis.
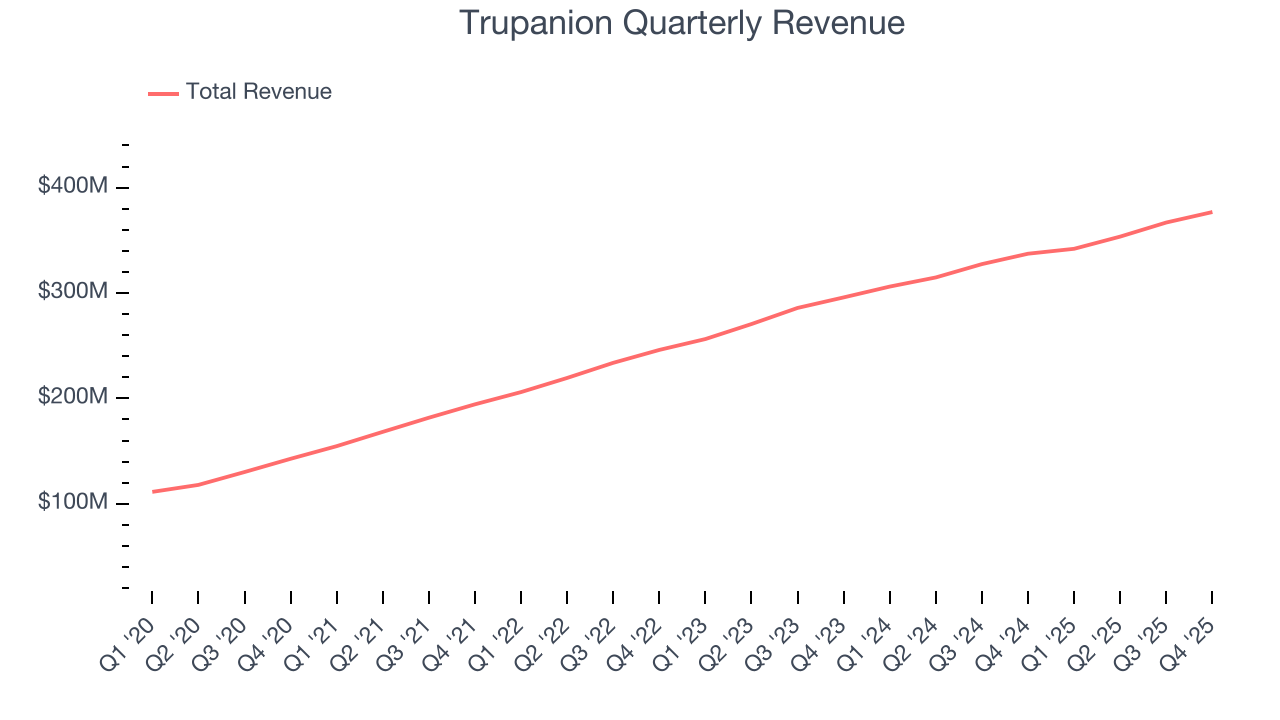
Long-term growth is the most important, but within financials, a half-decade historical view may miss recent interest rate changes and market returns. Trupanion’s annualized revenue growth of 13.9% over the last two years is below its five-year trend, but we still think the results suggest healthy demand. 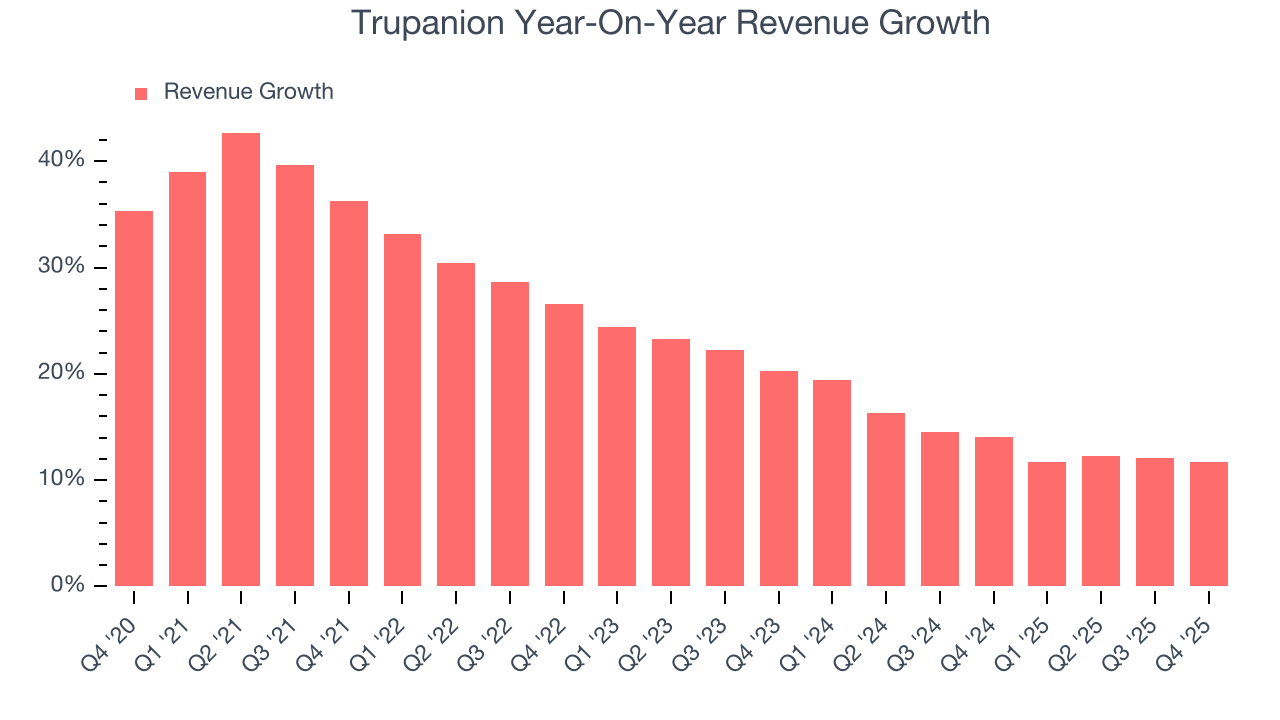
This quarter, Trupanion’s year-on-year revenue growth was 11.7%, and its $376.9 million of revenue was in line with Wall Street’s estimates.
6. Pre-Tax Profit Margin
Revenue growth is one major determinant of business quality, and the efficiency of operations is another. For insurance companies, we look at pre-tax profit rather than the operating margin that defines sectors such as consumer, tech, and industrials.
This is because insurers are balance sheet businesses, where assets and liabilities define the core economics. This means that interest income and expense should be factored into the definition of profit but taxes - which are largely out of a company’s control - should not.
Over the last five years, Trupanion’s pre-tax profit margin has fallen by 2.7 percentage points, going from negative 5% to 1.5%. It has also expanded by 5.6 percentage points on a two-year basis, showing its expenses have consistently grown at a slower rate than revenue. This typically signals prudent management.
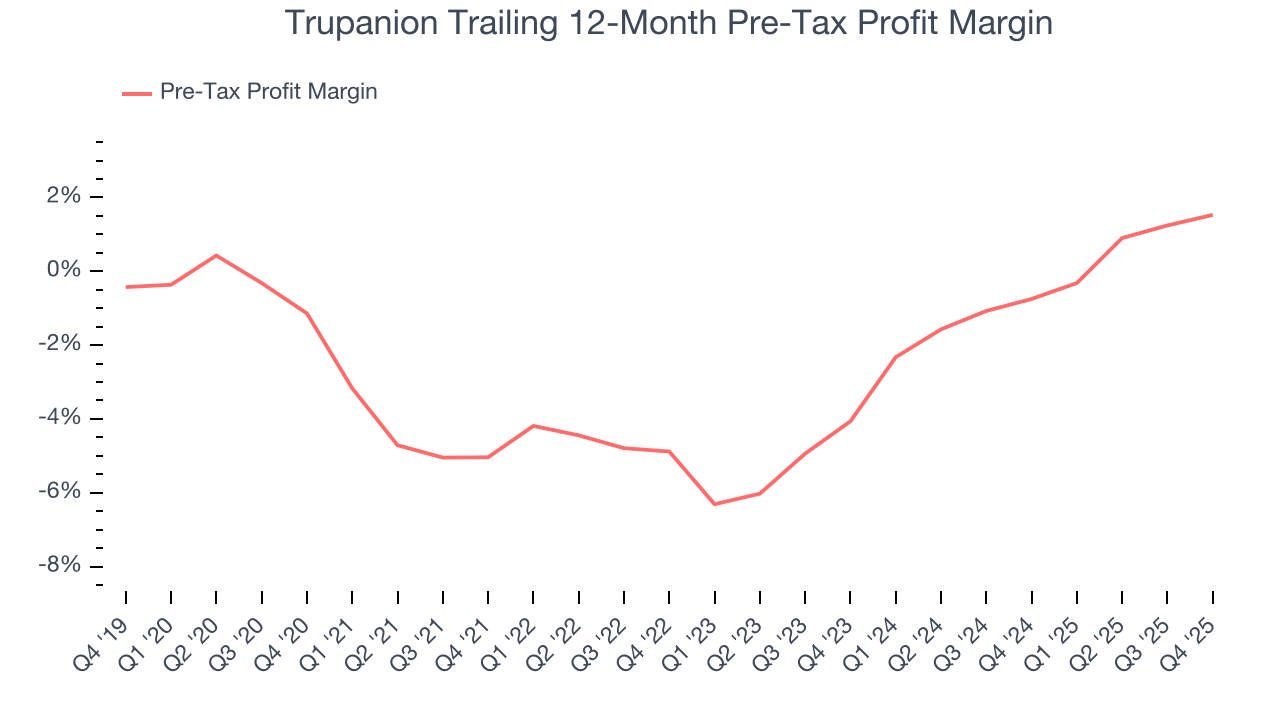
Trupanion’s pre-tax profit margin came in at 1.7% this quarter. This result was 1.2 percentage points better than the same quarter last year.
7. Earnings Per Share
Revenue trends explain a company’s historical growth, but the long-term change in earnings per share (EPS) points to the profitability of that growth – for example, a company could inflate its sales through excessive spending on advertising and promotions.
Trupanion’s full-year EPS flipped from negative to positive over the last five years. This is a good sign and shows it’s at an inflection point.
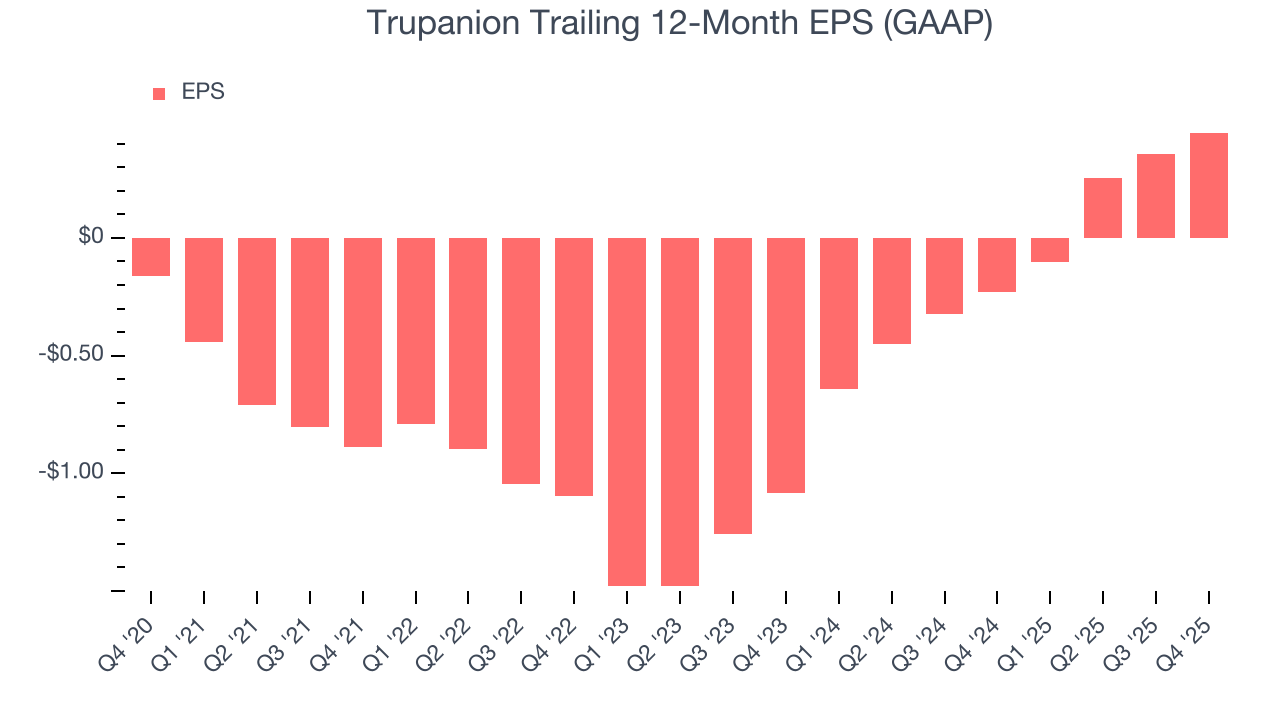
Like with revenue, we analyze EPS over a more recent period because it can provide insight into an emerging theme or development for the business.
For Trupanion, its two-year annual EPS growth of 55.3% was higher than its five-year trend. We love it when earnings growth accelerates, especially when it accelerates off an already high base.
In Q4, Trupanion reported EPS of $0.13, up from $0.04 in the same quarter last year. Despite growing year on year, this print missed analysts’ estimates, but we care more about long-term EPS growth than short-term movements. Over the next 12 months, Wall Street expects Trupanion’s full-year EPS of $0.45 to grow 18%.
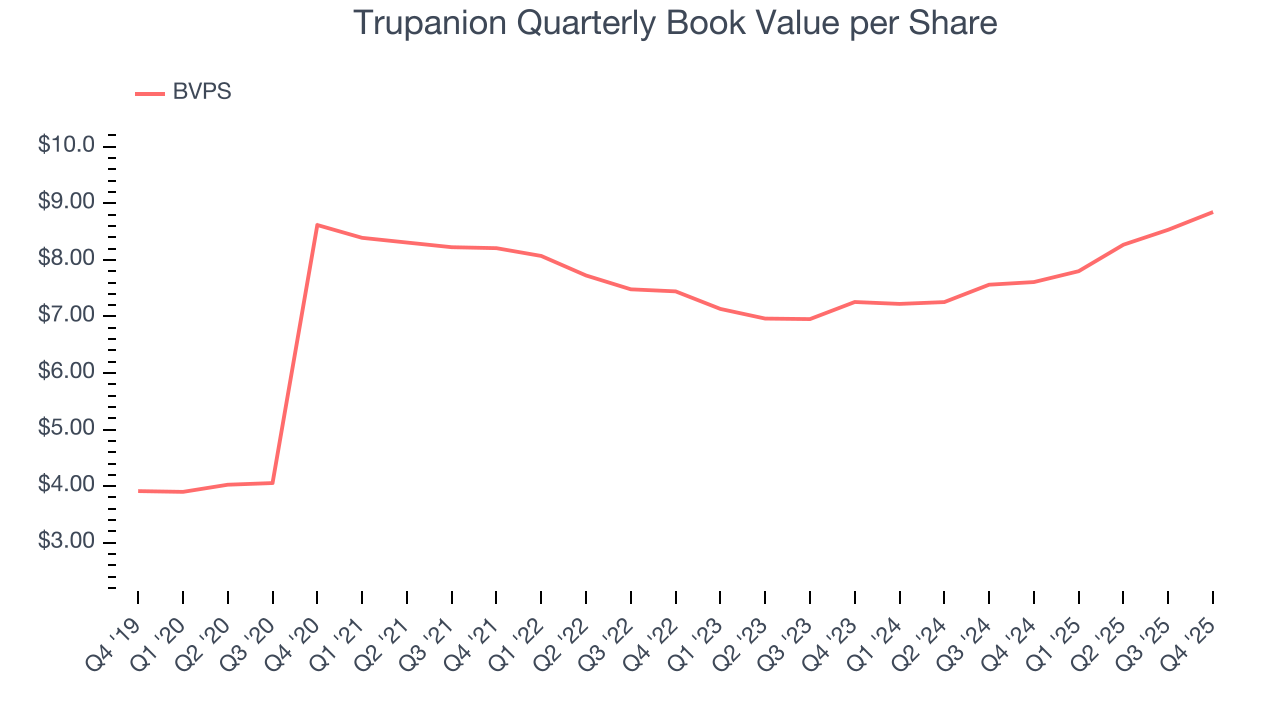
8. Book Value Per Share (BVPS)
Insurance companies are balance sheet businesses, collecting premiums upfront and paying out claims over time. The float – premiums collected but not yet paid out – are invested, creating an asset base supported by a liability structure. Book value captures this dynamic by measuring:
- Assets (investment portfolio, cash, reinsurance recoverables) - liabilities (claim reserves, debt, future policy benefits)
BVPS is essentially the residual value for shareholders.
We therefore consider BVPS very important to track for insurers and a metric that sheds light on business quality because it reflects long-term capital growth and is harder to manipulate than more commonly-used metrics like EPS.
Trupanion’s BVPS was flat over the last five years. However, BVPS growth has accelerated recently, growing by 10.4% annually over the last two years from $7.26 to $8.85 per share.
9. Balance Sheet Assessment
The debt-to-equity ratio is a widely used measure to assess a company's balance sheet health. A higher ratio means that a business aggressively financed its growth with debt. This can result in higher earnings (if the borrowed funds are invested profitably) but also increases risk.
If debt levels are too high, there could be difficulties in meeting obligations, especially during economic downturns or periods of rising interest rates if the debt has variable-rate payments.
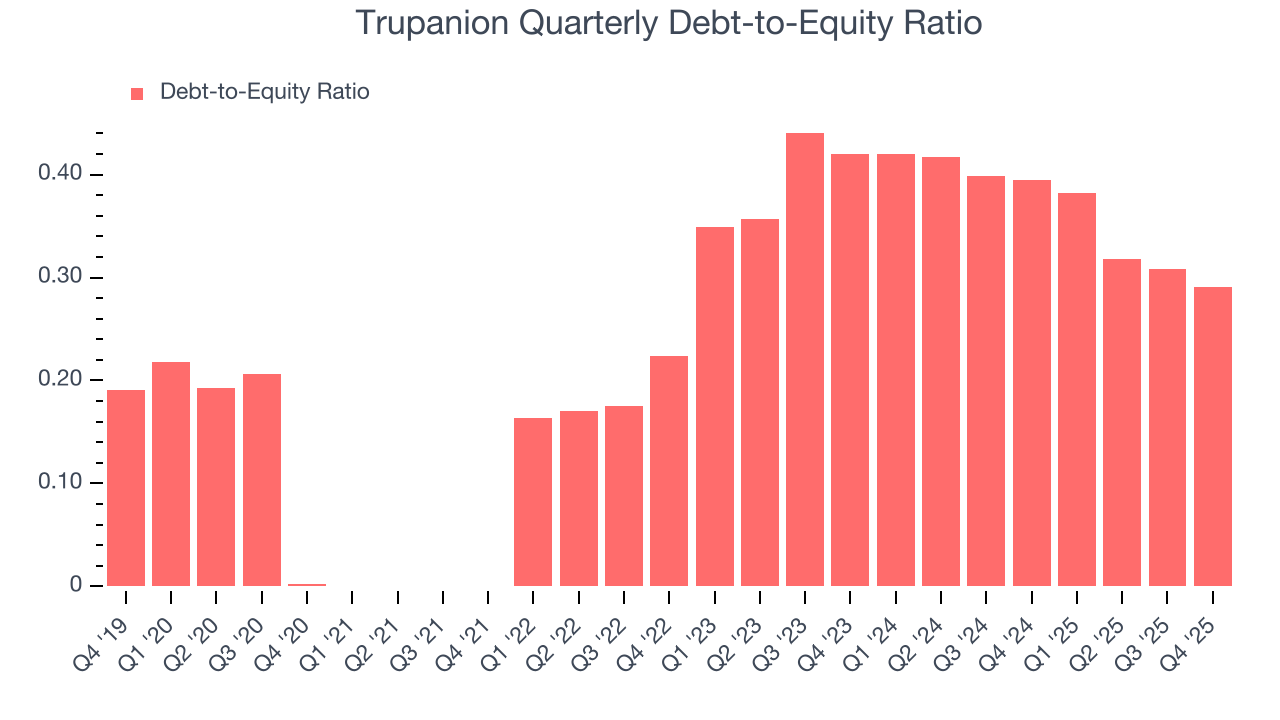
Trupanion currently has $111.8 million of debt and $383.9 million of shareholder's equity on its balance sheet, and over the past four quarters, has averaged a debt-to-equity ratio of 0.3×. We think this is safe and raises no red flags. In general, we’re comfortable with any ratio below 1.0× for an insurance business. Anything below 0.5× is a bonus.
10. Return on Equity
Return on equity, or ROE, represents the ultimate measure of an insurer's effectiveness, quantifying how well it transforms shareholder investments into profits. Over the long term, insurance companies with robust ROE metrics typically deliver superior shareholder returns through a balanced approach to capital management.
Over the last five years, Trupanion has averaged an ROE of negative 8.2%, a disappointing result relative to the majority of insurers putting up 20%+. But we wouldn’t write off Trupanion given its success in other measures of financial health.
11. Key Takeaways from Trupanion’s Q4 Results
We struggled to find many positives in these results. Overall, this quarter could have been better. The stock remained flat at $32.14 immediately after reporting.
12. Is Now The Time To Buy Trupanion?
Updated: March 19, 2026 at 12:53 AM EDT
The latest quarterly earnings matters, sure, but we actually think longer-term fundamentals and valuation matter more. Investors should consider all these pieces before deciding whether or not to invest in Trupanion.
Trupanion’s business quality ultimately falls short of our standards. Although its revenue growth was exceptional over the last five years, it’s expected to deteriorate over the next 12 months and its relatively low ROE suggests management has struggled to find compelling investment opportunities. And while the company’s astounding EPS growth over the last five years shows its profits are trickling down to shareholders, the downside is its BVPS growth was weak over the last five years.
Trupanion’s P/B ratio based on the next 12 months is 2.6x. Investors with a higher risk tolerance might like the company, but we think the potential downside is too great. We're fairly confident there are better stocks to buy right now.
Wall Street analysts have a consensus one-year price target of $46.25 on the company (compared to the current share price of $26.13).
Although the price target is bullish, readers should exercise caution because analysts tend to be overly optimistic. The firms they work for, often big banks, have relationships with companies that extend into fundraising, M&A advisory, and other rewarding business lines. As a result, they typically hesitate to say bad things for fear they will lose out. We at StockStory do not suffer from such conflicts of interest, so we’ll always tell it like it is.