Wendy's (WEN)
Wendy's is up against the odds. Its sluggish sales growth shows demand is soft, a worrisome sign for investors in high-quality stocks.― StockStory Analyst Team
1. News


2. Summary
Why We Think Wendy's Will Underperform
Founded by Dave Thomas in 1969, Wendy’s (NASDAQ:WEN) is a renowned fast-food chain known for its fresh, never-frozen beef burgers, flavorful menu options, and commitment to quality.
- Estimated sales growth of 1.2% for the next 12 months implies demand will slow from its six-year trend
- Poor same-store sales performance over the past two years indicates it’s having trouble bringing new diners into its restaurants
- 7× net-debt-to-EBITDA ratio makes lenders less willing to extend additional capital, potentially necessitating dilutive equity offerings


Wendy's falls short of our expectations. We see more attractive opportunities in the market.
Why There Are Better Opportunities Than Wendy's


Wendy's is trading at $7.36 per share, or 12.4x forward P/E. This multiple is lower than most restaurant companies, but for good reason.
Our advice is to pay up for elite businesses whose advantages are tailwinds to earnings growth. Don’t get sucked into lower-quality businesses just because they seem like bargains. These mediocre businesses often never achieve a higher multiple as hoped, a phenomenon known as a “value trap”.
3. Wendy's (WEN) Research Report: Q4 CY2025 Update
Fast-food chain Wendy’s (NASDAQ:WEN) beat Wall Street’s revenue expectations in Q4 CY2025, but sales fell by 5.5% year on year to $543 million. Its non-GAAP profit of $0.16 per share was 10.4% above analysts’ consensus estimates.
Wendy's (WEN) Q4 CY2025 Highlights:
- Revenue: $543 million vs analyst estimates of $536.3 million (5.5% year-on-year decline, 1.3% beat)
- Adjusted EPS: $0.16 vs analyst estimates of $0.14 (10.4% beat)
- Adjusted EBITDA: $113.3 million vs analyst estimates of $112.6 million (20.9% margin, 0.6% beat)
- Adjusted EPS guidance for the upcoming financial year 2026 is $0.58 at the midpoint, missing analyst estimates by 32%
- EBITDA guidance for the upcoming financial year 2026 is $470 million at the midpoint, below analyst estimates of $516.8 million
- Operating Margin: 11.8%, down from 16.7% in the same quarter last year
- Free Cash Flow Margin: 5.8%, up from 4.6% in the same quarter last year
- Same-Store Sales fell 10.1% year on year (4.3% in the same quarter last year)
- Market Capitalization: $1.38 billion
Company Overview
Founded by Dave Thomas in 1969, Wendy’s (NASDAQ:WEN) is a renowned fast-food chain known for its fresh, never-frozen beef burgers, flavorful menu options, and commitment to quality.
Dave was an experienced restaurateur, having been the original head cook at the line of restaurants that would eventually become KFC and a trusted partner to its CEO, Colonel Harland Sanders. After over a decade of successfully managing and growing KFC, Dave sold his stake in the company back to the Colonel, providing the funds for his next venture: Wendy’s.
The inspiration for the new business came from his daughter Melinda, who loved hamburgers and was affectionately known as Wendy. Since those early days, Wendy’s has grown tremendously due to Dave’s determination to create a fast-food experience that stood out.
At the heart of Wendy's success lies its dedication to delivering exceptional meals. From its signature square-shaped burgers to its Frosty ice cream and viral 4 for $4 meal, which bundles a cheeseburger, chicken nuggets, french fries, and a drink, each menu item showcases Wendy's commitment to taste, quality, and value.
Every Wendy’s restaurant promotes a comfortable atmosphere where customers can opt for cozy indoor seating or the convenience of a drive-thru. It’s also embraced technological advancements, having partnered with popular delivery platforms and developing a mobile app, allowing customers to easily place orders, customize meals, and access exclusive offers.
4. Traditional Fast Food
Traditional fast-food restaurants are renowned for their speed and convenience, boasting menus filled with familiar and budget-friendly items. Their reputations for on-the-go consumption make them favored destinations for individuals and families needing a quick meal. This class of restaurants, however, is fighting the perception that their meals are unhealthy and made with inferior ingredients, a battle that's especially relevant today given the consumers increasing focus on health and wellness.
5. Revenue Growth
Examining a company’s long-term performance can provide clues about its quality. Any business can put up a good quarter or two, but the best consistently grow over the long haul.
With $2.18 billion in revenue over the past 12 months, Wendy's is a mid-sized restaurant chain, which sometimes brings disadvantages compared to larger competitors benefiting from better brand awareness and economies of scale.
As you can see below, Wendy's grew its sales at a sluggish 4.1% compounded annual growth rate over the last six years.
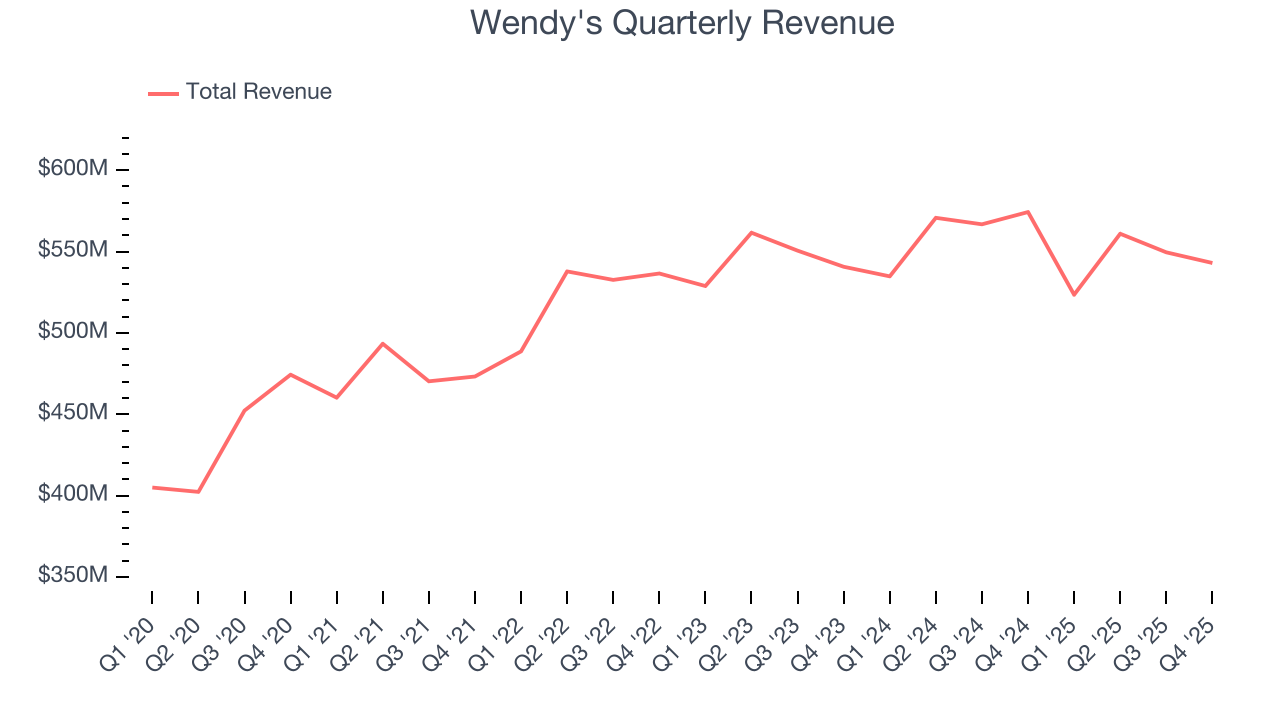
This quarter, Wendy’s revenue fell by 5.5% year on year to $543 million but beat Wall Street’s estimates by 1.3%.
Looking ahead, sell-side analysts expect revenue to grow 2.9% over the next 12 months, similar to its six-year rate. This projection doesn't excite us and implies its menu offerings will face some demand challenges.
6. Restaurant Performance
Number of Restaurants
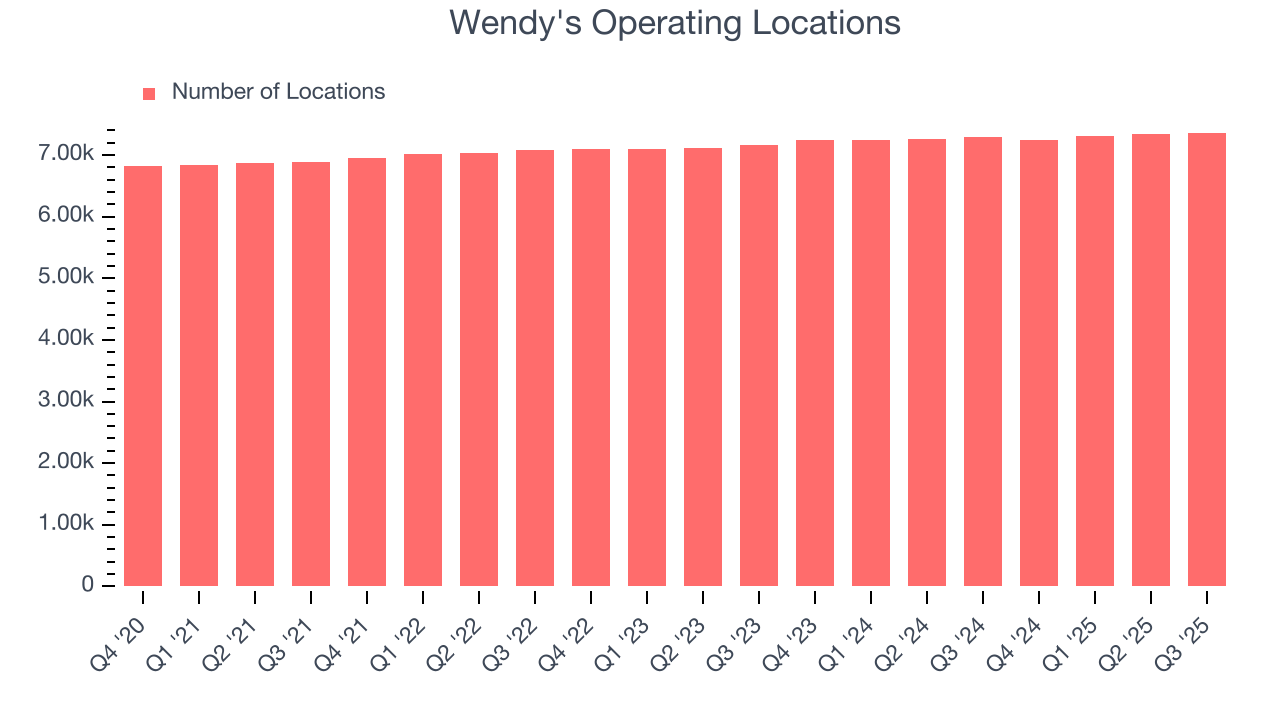
A restaurant chain’s total number of dining locations influences how much it can sell and how quickly revenue can grow.
Over the last two years, Wendy's has generally opened new restaurants, averaging 1.3% annual growth. This was faster than the broader restaurant sector.
When a chain opens new restaurants, it usually means it’s investing for growth because there’s healthy demand for its meals and there are markets where its concepts have few or no locations.
Note that Wendy's reports its restaurant count intermittently, so some data points are missing in the chart below.
Same-Store Sales
The change in a company's restaurant base only tells one side of the story. The other is the performance of its existing locations, which informs management teams whether they should expand or downsize their physical footprints. Same-store sales is an industry measure of whether revenue is growing at those existing restaurants and is driven by customer visits (often called traffic) and the average spending per customer (ticket).
Wendy’s demand has been shrinking over the last two years as its same-store sales have averaged 1.6% annual declines. This performance is concerning - it shows Wendy's artificially boosts its revenue by building new restaurants. We’d like to see a company’s same-store sales rise before it takes on the costly, capital-intensive endeavor of expanding its restaurant base.
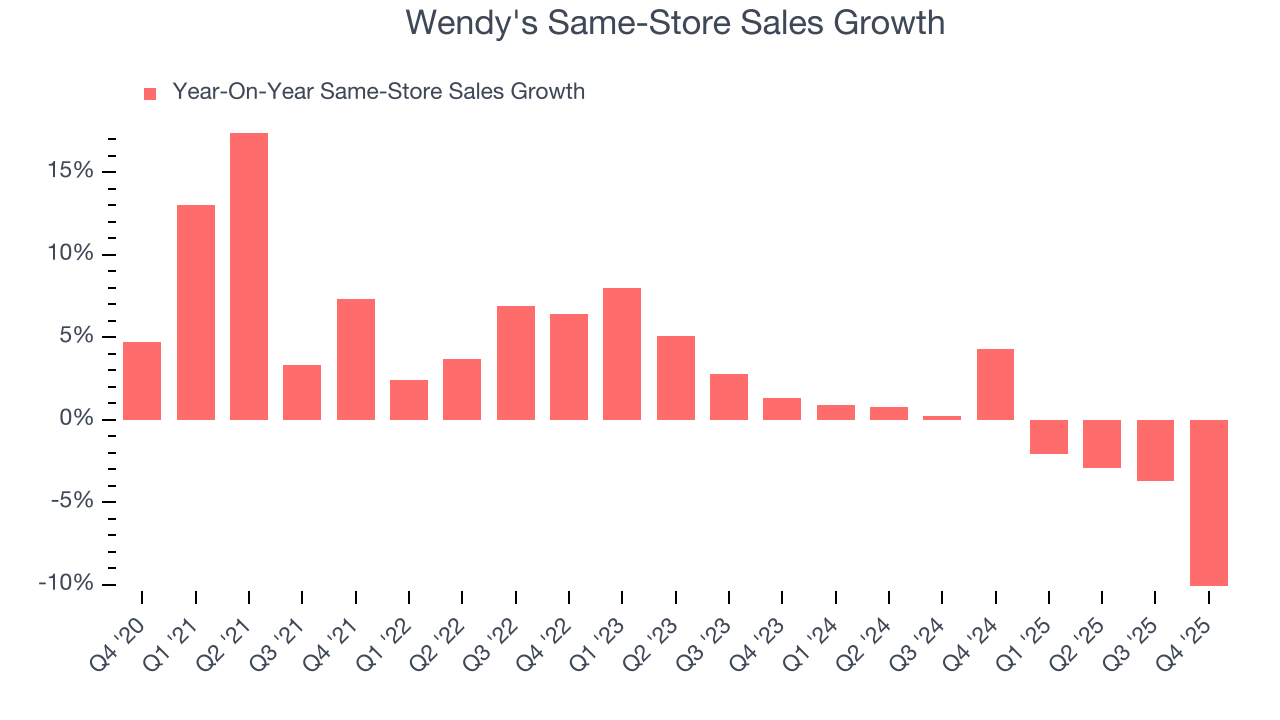
In the latest quarter, Wendy’s same-store sales fell by 10.1% year on year. This decrease represents a further deceleration from its historical levels. We hope the business can get back on track.
7. Gross Margin & Pricing Power
We prefer higher gross margins because they not only make it easier to generate more operating profits but also indicate pricing power and differentiation, whether it be the dining experience or quality and taste of food.
Wendy's has good unit economics for a restaurant company, giving it the opportunity to invest in areas such as marketing and talent to stay competitive. As you can see below, it averaged an impressive 34.9% gross margin over the last two years. Said differently, Wendy's paid its suppliers $65.05 for every $100 in revenue. 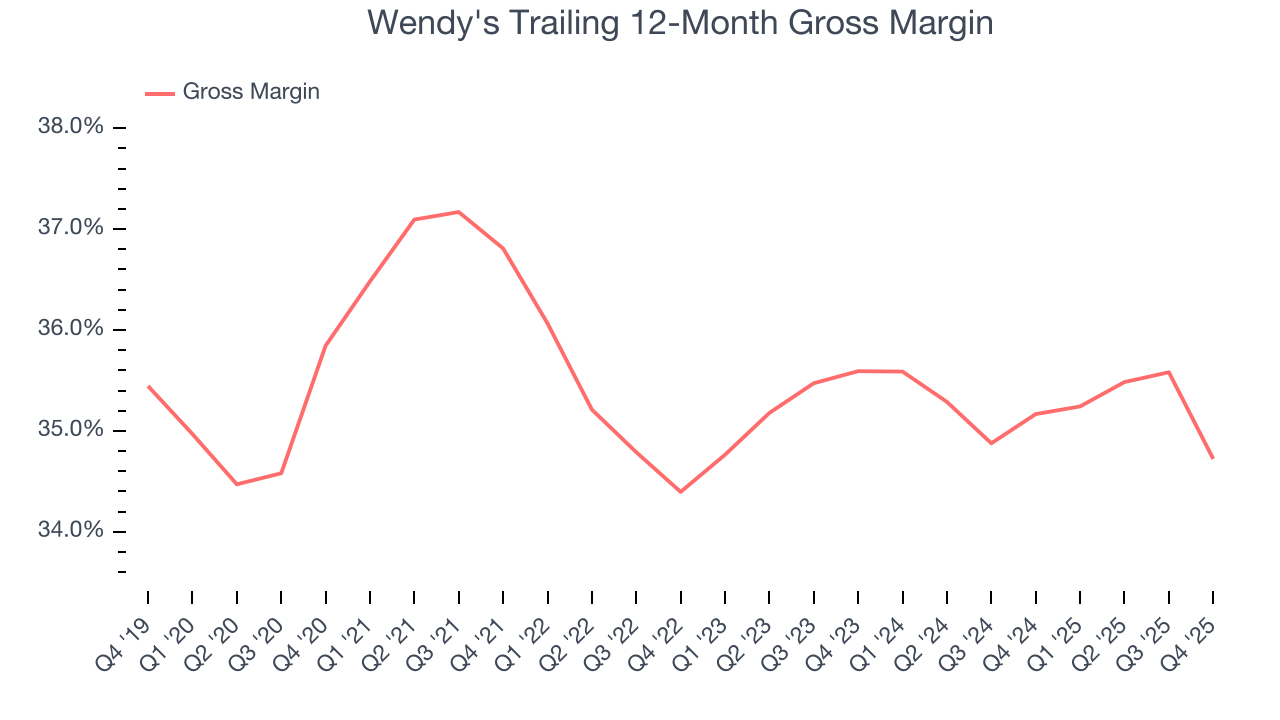
This quarter, Wendy’s gross profit margin was 32.6%, marking a 3.4 percentage point decrease from 36% in the same quarter last year. Zooming out, the company’s full-year margin has remained steady over the past 12 months, suggesting its input costs (such as ingredients and transportation expenses) have been stable and it isn’t under pressure to lower prices.
8. Operating Margin
Wendy’s operating margin might fluctuated slightly over the last 12 months but has remained more or less the same, averaging 16.2% over the last two years. This profitability was top-notch for a restaurant business, showing it’s an well-run company with an efficient cost structure. This result isn’t too surprising as its gross margin gives it a favorable starting point.
Analyzing the trend in its profitability, Wendy’s operating margin might fluctuated slightly but has generally stayed the same over the last year. This raises questions about the company’s expense base because its revenue growth should have given it leverage on its fixed costs, resulting in better economies of scale and profitability.
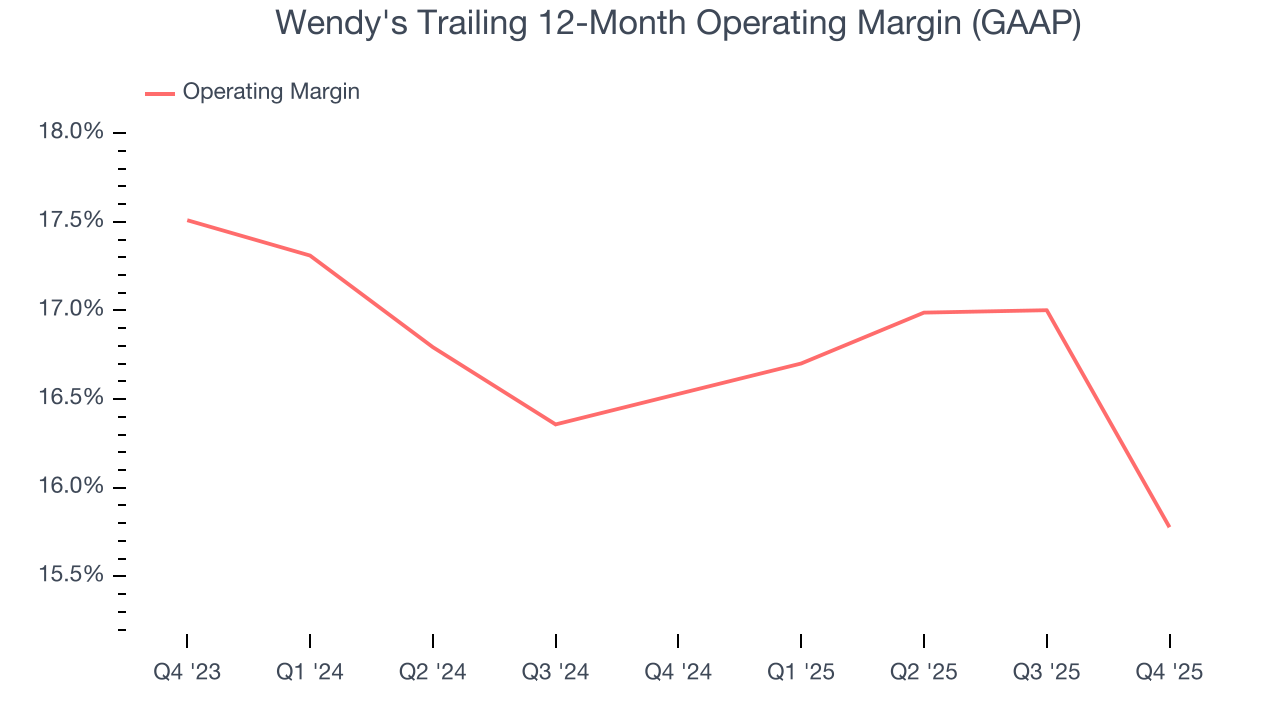
In Q4, Wendy's generated an operating margin profit margin of 11.8%, down 4.9 percentage points year on year. Since Wendy’s operating margin decreased more than its gross margin, we can assume it was less efficient because expenses such as marketing, and administrative overhead increased.
9. Earnings Per Share
We track the long-term change in earnings per share (EPS) for the same reason as long-term revenue growth. Compared to revenue, however, EPS highlights whether a company’s growth is profitable.
Wendy’s EPS grew at an unimpressive 7.1% compounded annual growth rate over the last six years. On the bright side, this performance was better than its 4.1% annualized revenue growth and tells us the company became more profitable on a per-share basis as it expanded.
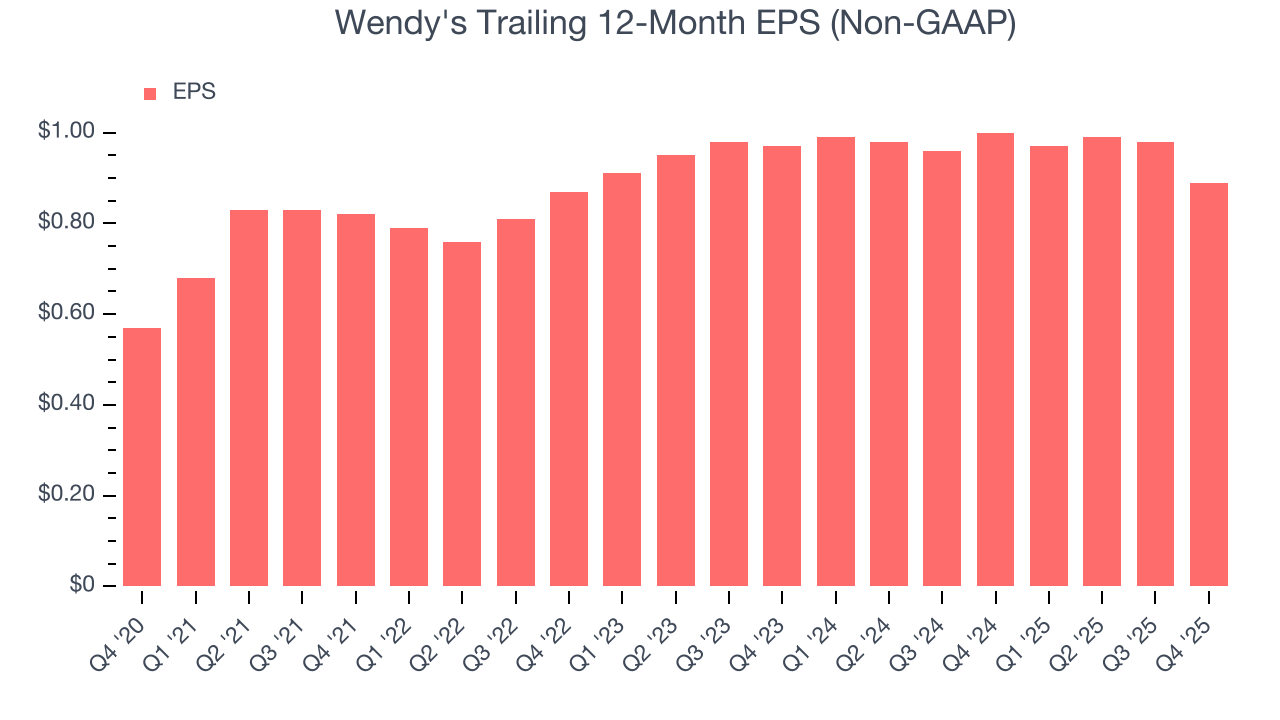
In Q4, Wendy's reported adjusted EPS of $0.16, down from $0.25 in the same quarter last year. Despite falling year on year, this print easily cleared analysts’ estimates. Over the next 12 months, Wall Street expects Wendy’s full-year EPS of $0.89 to shrink by 3.4%.
10. Cash Is King
If you’ve followed StockStory for a while, you know we emphasize free cash flow. Why, you ask? We believe that in the end, cash is king, and you can’t use accounting profits to pay the bills.
Wendy's has shown robust cash profitability, driven by its attractive business model that enables it to reinvest or return capital to investors. The company’s free cash flow margin averaged 11.4% over the last two years, quite impressive for a restaurant business.
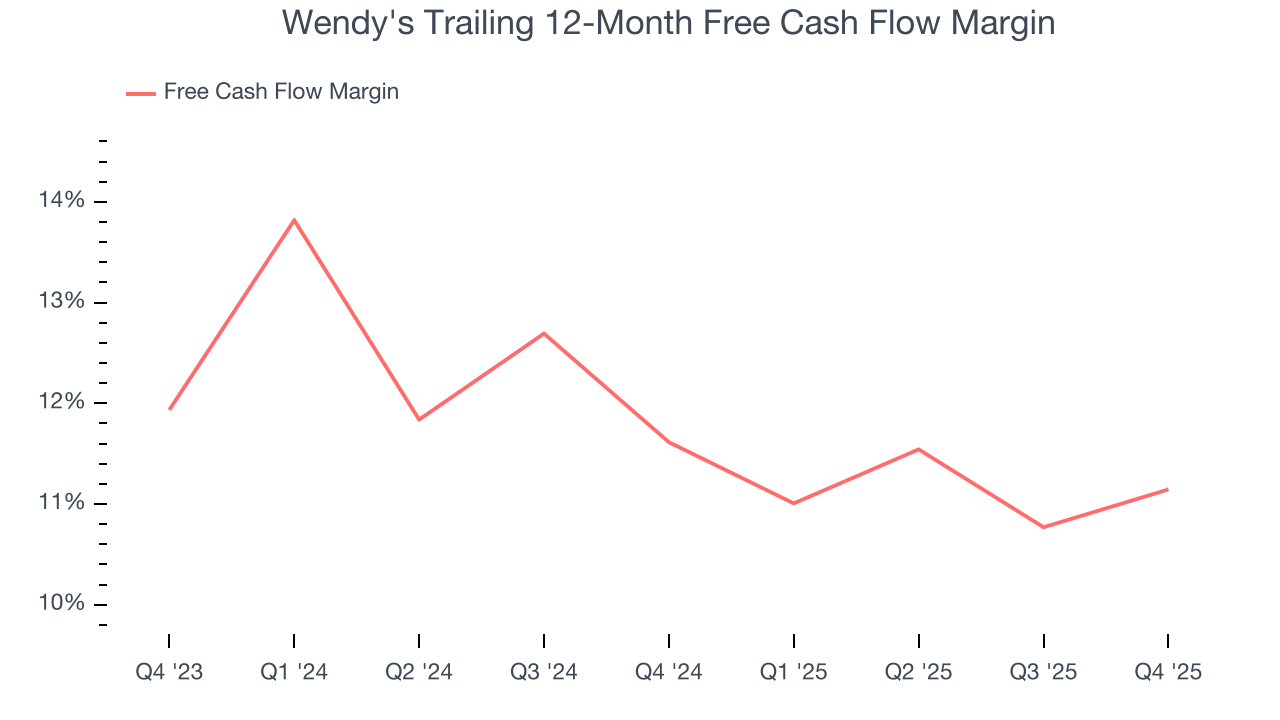
Wendy’s free cash flow clocked in at $31.4 million in Q4, equivalent to a 5.8% margin. This result was good as its margin was 1.2 percentage points higher than in the same quarter last year, but we wouldn’t read too much into the short term because investment needs can be seasonal, causing temporary swings. Long-term trends trump fluctuations.
11. Return on Invested Capital (ROIC)
EPS and free cash flow tell us whether a company was profitable while growing its revenue. But was it capital-efficient? Enter ROIC, a metric showing how much operating profit a company generates relative to the money it has raised (debt and equity).
Although Wendy's hasn’t been the highest-quality company lately because of its poor top-line performance, it historically found a few growth initiatives that worked. Its five-year average ROIC was 11.5%, higher than most restaurant businesses.
12. Balance Sheet Risk
Debt is a tool that can boost company returns but presents risks if used irresponsibly. As long-term investors, we aim to avoid companies taking excessive advantage of this instrument because it could lead to insolvency.
Wendy’s $4.15 billion of debt exceeds the $340 million of cash on its balance sheet. Furthermore, its 7× net-debt-to-EBITDA ratio (based on its EBITDA of $522.4 million over the last 12 months) shows the company is overleveraged.
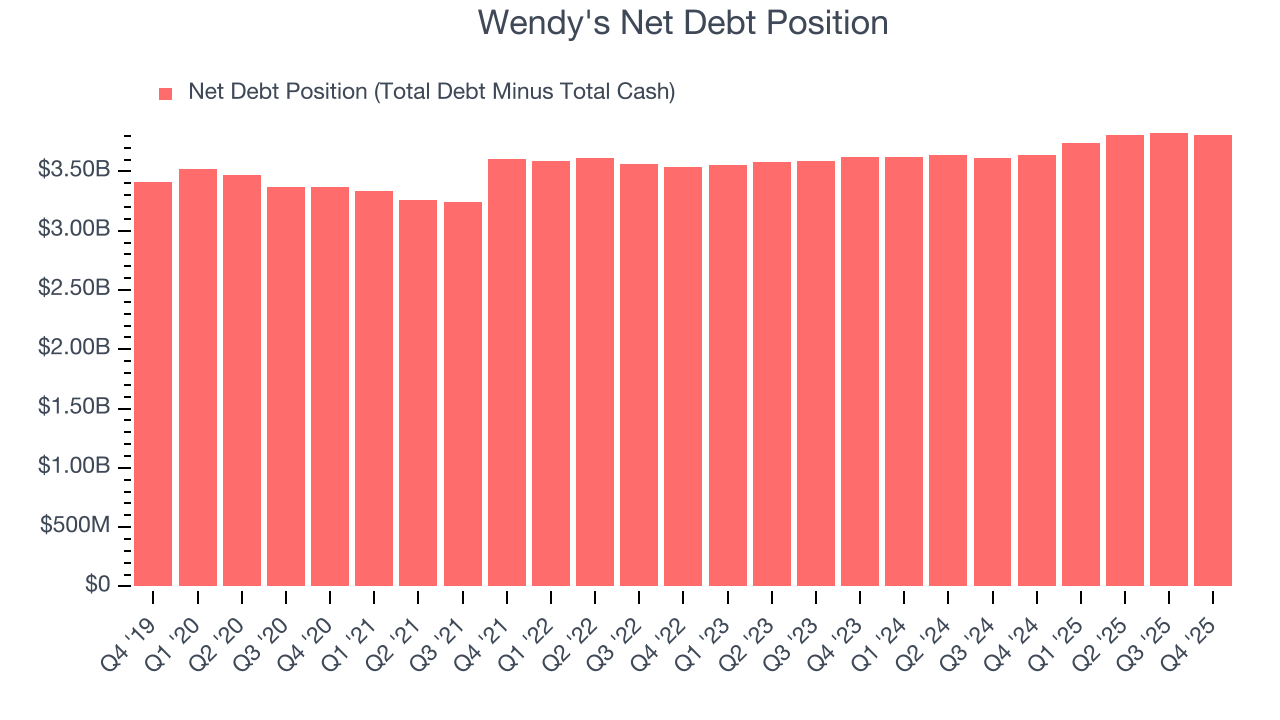
At this level of debt, incremental borrowing becomes increasingly expensive and credit agencies could downgrade the company’s rating if profitability falls. Wendy's could also be backed into a corner if the market turns unexpectedly – a situation we seek to avoid as investors in high-quality companies.
We hope Wendy's can improve its balance sheet and remain cautious until it increases its profitability or pays down its debt.
13. Key Takeaways from Wendy’s Q4 Results
It was good to see Wendy's narrowly top analysts’ revenue expectations this quarter. We were also glad its EPS outperformed Wall Street’s estimates. On the other hand, its full-year EBITDA guidance missed and its same-store sales fell short of Wall Street’s estimates. Overall, this quarter could have been better. The stock traded down 8.1% to $6.68 immediately following the results.
14. Is Now The Time To Buy Wendy's?
Updated: March 6, 2026 at 9:55 PM EST
We think that the latest earnings result is only one piece of the bigger puzzle. If you’re deciding whether to own Wendy's, you should also grasp the company’s longer-term business quality and valuation.
We cheer for all companies serving everyday consumers, but in the case of Wendy's, we’ll be cheering from the sidelines. For starters, its revenue growth was uninspiring over the last six years, and analysts expect its demand to deteriorate over the next 12 months. While its strong free cash flow generation allows it to invest in growth initiatives while maintaining an ample cushion, the downside is its projected EPS for the next year is lacking. On top of that, its shrinking same-store sales tell us it will need to change its strategy to succeed.
Wendy’s P/E ratio based on the next 12 months is 12.4x. While this valuation is fair, the upside isn’t great compared to the potential downside. There are better investments elsewhere.
Wall Street analysts have a consensus one-year price target of $8.07 on the company (compared to the current share price of $7.36).