Aflac (AFL)
We’re wary of Aflac. Its declining sales show demand has evaporated, a red flag for investors seeking high-quality stocks.― StockStory Analyst Team
1. News


2. Summary
Why We Think Aflac Will Underperform
Known for its iconic duck mascot that has quacked "Aflac!" in commercials since 2000, Aflac (NYSE:AFL) provides supplemental health and life insurance policies that pay cash benefits directly to policyholders for expenses not covered by their primary insurance.
- Annual sales declines of 4.6% for the past five years show its products and services struggled to connect with the market during this cycle
- Insurance policy sales contracted this cycle as net premiums earned decreased by 6.2% annually over the last five years
- A silver lining is that its combined ratio improved by 20.7 percentage points over the last five years as it refined its cost structure


Aflac falls short of our expectations. We’d rather invest in businesses with stronger moats.
Why There Are Better Opportunities Than Aflac


Aflac’s stock price of $112.06 implies a valuation ratio of 2x forward P/B. This valuation multiple seems a bit much considering the tepid revenue growth profile.
There are stocks out there featuring similar valuation multiples with better fundamentals. We prefer to invest in those.
3. Aflac (AFL) Research Report: Q4 CY2025 Update
Supplemental insurance provider Aflac (NYSE:AFL) beat Wall Street’s revenue expectations in Q4 CY2025, with sales up 12.7% year on year to $4.87 billion. Its non-GAAP profit of $1.57 per share was 7.3% below analysts’ consensus estimates.
Aflac (AFL) Q4 CY2025 Highlights:
- Revenue: $4.87 billion vs analyst estimates of $4.41 billion (12.7% year-on-year growth, 10.5% beat)
- Pre-tax Profit: $1.57 billion (32.3% margin)
- Adjusted EPS: $1.57 vs analyst expectations of $1.69 (7.3% miss)
- Book Value per Share: $56.85 vs analyst estimates of $53.62 (19.8% year-on-year growth, 6% beat)
- Market Capitalization: $58.72 billion
Company Overview
Known for its iconic duck mascot that has quacked "Aflac!" in commercials since 2000, Aflac (NYSE:AFL) provides supplemental health and life insurance policies that pay cash benefits directly to policyholders for expenses not covered by their primary insurance.
Aflac operates in two primary markets: Japan, which generates the majority of the company's earnings, and the United States. In Japan, Aflac is the largest provider of cancer and medical insurance policies, known as "third sector" products. These policies help Japanese consumers manage out-of-pocket costs not covered by the national health insurance system. The company also offers "first sector" protection products in Japan, including whole life insurance and term life policies.
In the United States, Aflac's product portfolio includes accident, short-term disability, cancer, critical illness, hospital indemnity, dental, vision, and life insurance policies. These products are designed to supplement major medical insurance by providing cash benefits regardless of other coverage. For example, if a policyholder is diagnosed with cancer, Aflac's cancer policy provides a lump-sum payment upon diagnosis and additional benefits for treatment.
Aflac distributes its products through multiple channels. In Japan, the company works with approximately 7,000 sales agencies employing about 113,000 licensed sales associates, and has strategic alliances with Dai-ichi Life, Japan Post Group, and Daido Life. In the U.S., Aflac primarily sells through independent agents and brokers at workplaces, with small businesses (3-99 employees) served by career agents and larger employers (100+ employees) targeted by brokers. The company is also expanding direct-to-consumer digital sales outside traditional workplace settings.
Aflac's business model focuses on developing relevant supplemental insurance products that address specific financial gaps, selling through customers' preferred channels, and maintaining strong brand recognition through marketing campaigns featuring the Aflac Duck.
4. Life Insurance
Life insurance companies collect premiums from policyholders in exchange for providing a future death benefit or retirement income stream. Interest rates matter for the sector (and make it cyclical), with higher rates allowing insurers to reinvest their fixed-income portfolios at more attractive yields and vice versa. Additionally, favorable demographic shifts, such as an aging population, are driving strong demand for retirement products while AI and data analytics offer significant opportunities to improve underwriting accuracy and operational efficiency. Conversely, the industry faces headwinds from persistent competition from agile insurtechs that threaten traditional distribution models.
Aflac's competitors in the supplemental insurance market include MetLife (NYSE:MET), Unum Group (NYSE:UNM), Colonial Life (a subsidiary of Unum), and Allstate (NYSE:ALL). In Japan, Aflac competes with domestic insurers like Nippon Life Insurance Company and Dai-ichi Life Holdings (TYO:8750).
5. Revenue Growth
In general, insurance companies earn revenue from three primary sources. The first is the core insurance business itself, often called underwriting and represented in the income statement as premiums earned. The second source is investment income from investing the “float” (premiums collected upfront not yet paid out as claims) in assets such as fixed-income assets and equities. The third is fees from various sources such as policy administration, annuities, or other value-added services. Aflac struggled to consistently generate demand over the last five years as its revenue dropped at a 4.1% annual rate. This wasn’t a great result and is a sign of poor business quality.
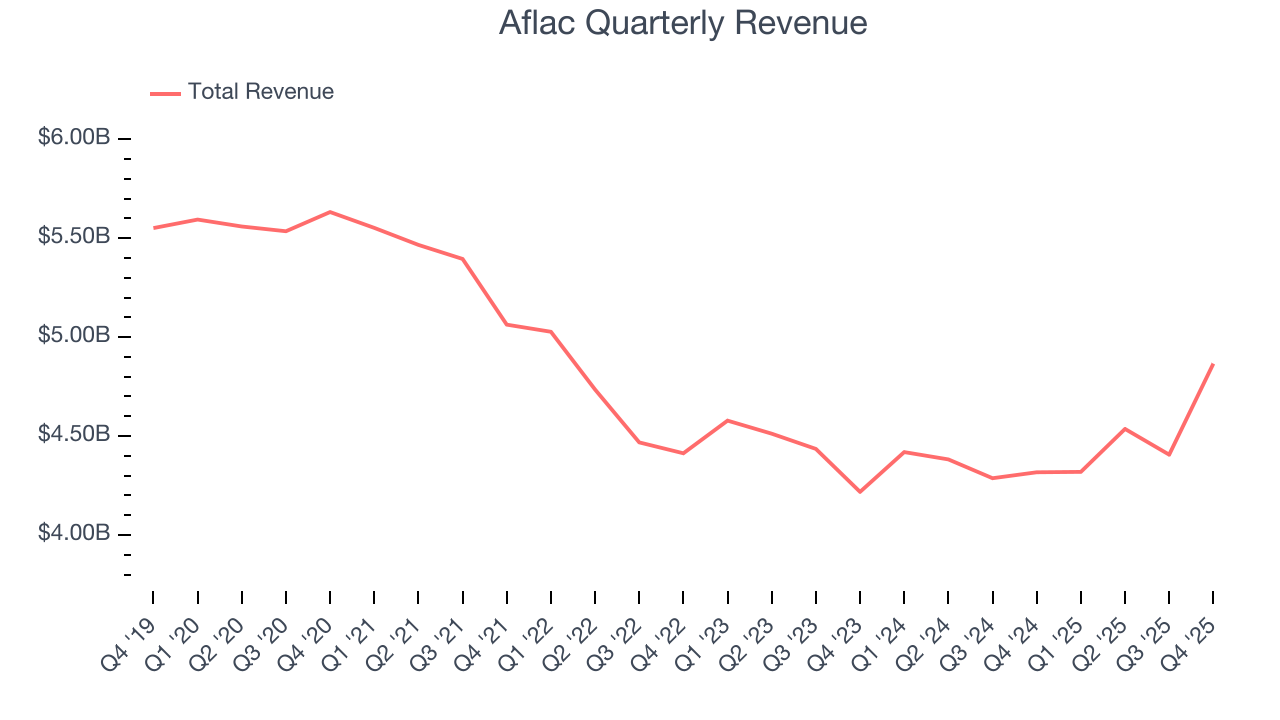
Long-term growth is the most important, but within financials, a half-decade historical view may miss recent interest rate changes and market returns. Aflac’s annualized revenue growth of 1.1% over the last two years is above its five-year trend, but we were still disappointed by the results. 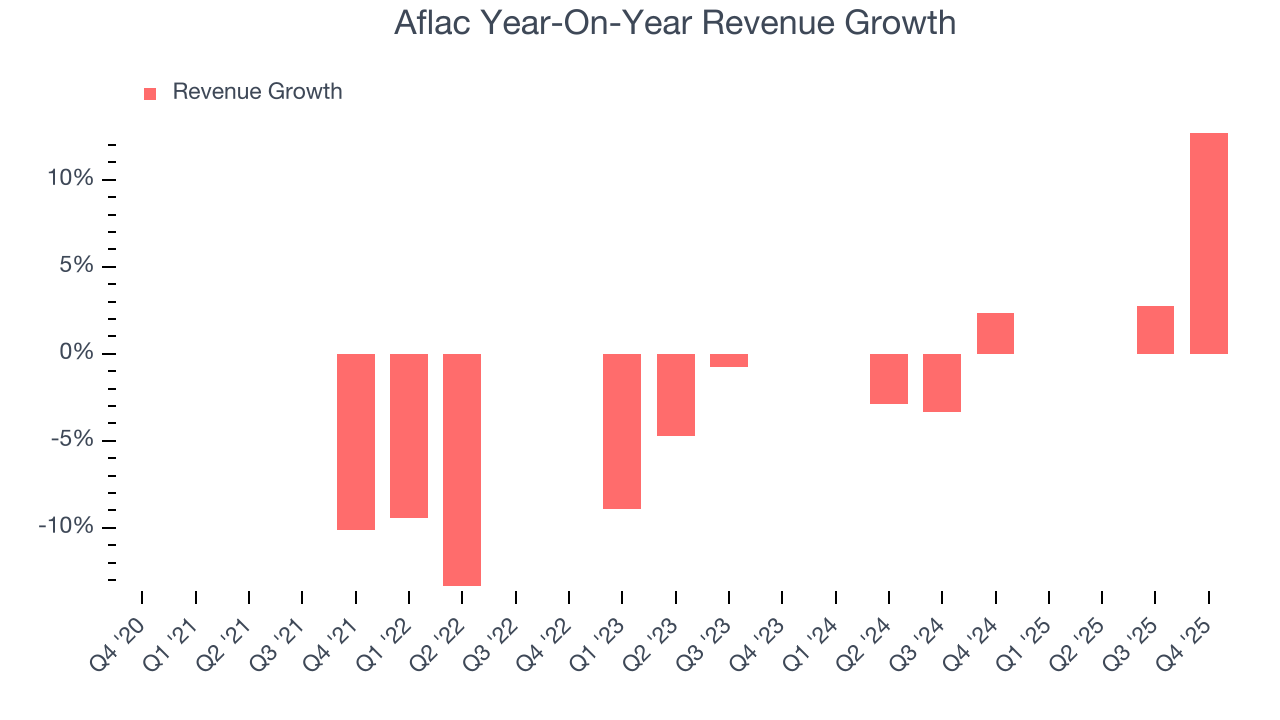 Note: Quarters not shown were determined to be outliers, impacted by outsized investment gains/losses that are not indicative of the recurring fundamentals of the business.
This quarter, Aflac reported year-on-year revenue growth of 12.7%, and its $4.87 billion of revenue exceeded Wall Street’s estimates by 10.5%.
Net premiums earned made up 79.4% of the company’s total revenue during the last five years, meaning insurance operations are Aflac’s largest source of revenue.
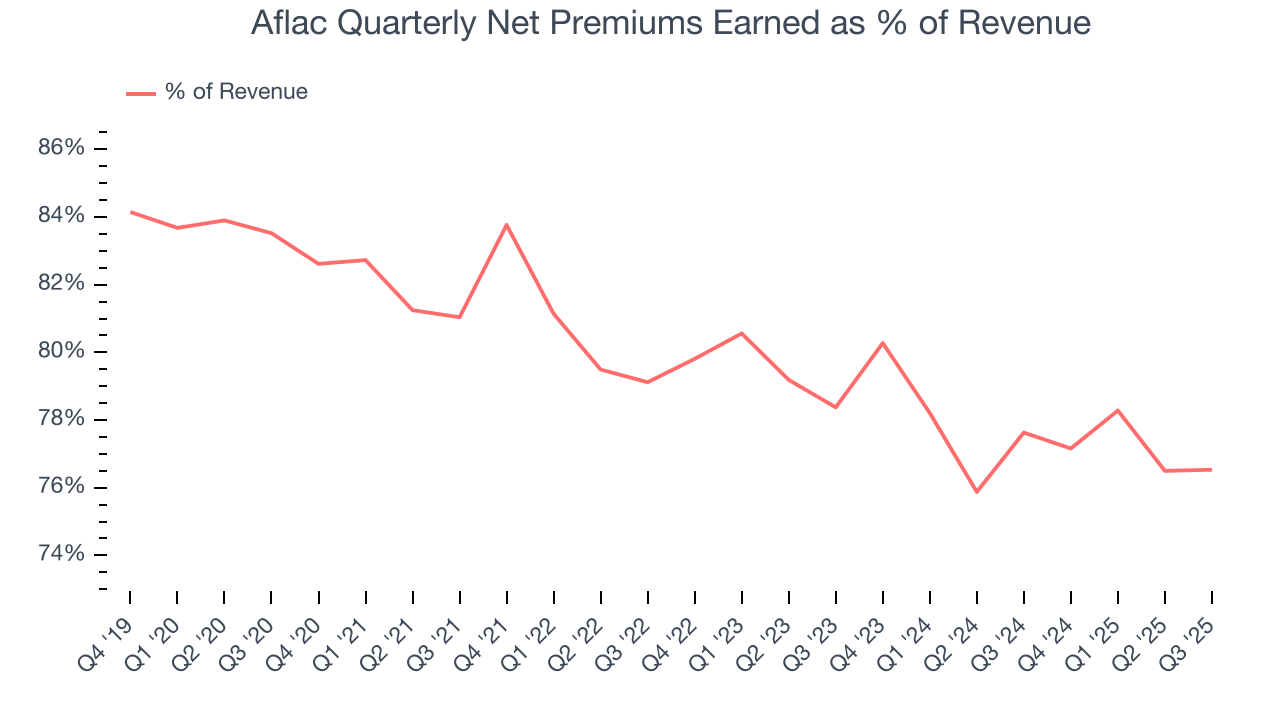
While insurers generate revenue from multiple sources, investors view net premiums earned as the cornerstone - its direct link to core operations stands in sharp contrast to the unpredictability of investment returns and fees.
6. Net Premiums Earned
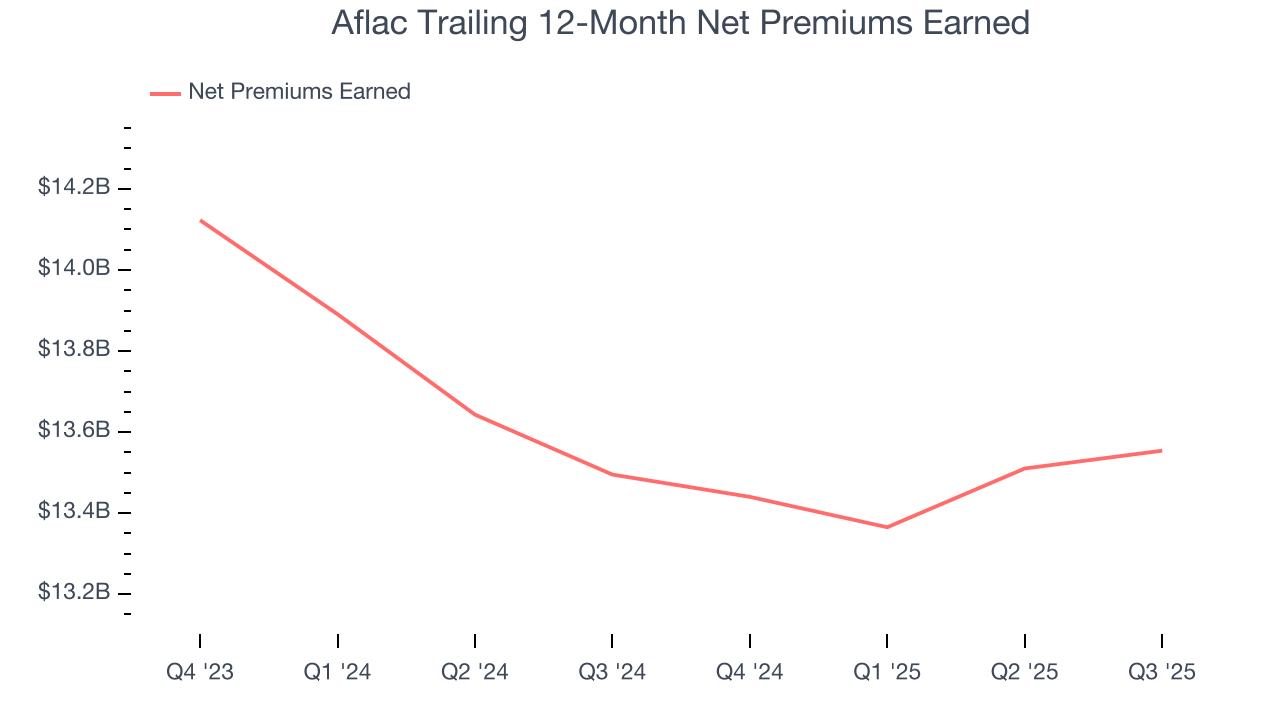
When insurers sell policies, they protect themselves from extremely large losses or an outsized accumulation of losses with reinsurance (insurance for insurance companies). Net premiums earned are therefore gross premiums less what’s ceded to reinsurers as a risk mitigation and transfer strategy.
Aflac’s net premiums earned has declined by 6.1% annually over the last five years, much worse than the broader insurance industry. This shows that policy underwriting underperformed its other business lines.
When analyzing Aflac’s net premiums earned over the last two years, we can see that income dropped by 2.4% annually. Since two-year net premiums earned underperformed total revenue over this period, it’s implied that insurance policies were a detractor of consolidated growth.
7. Combined Ratio
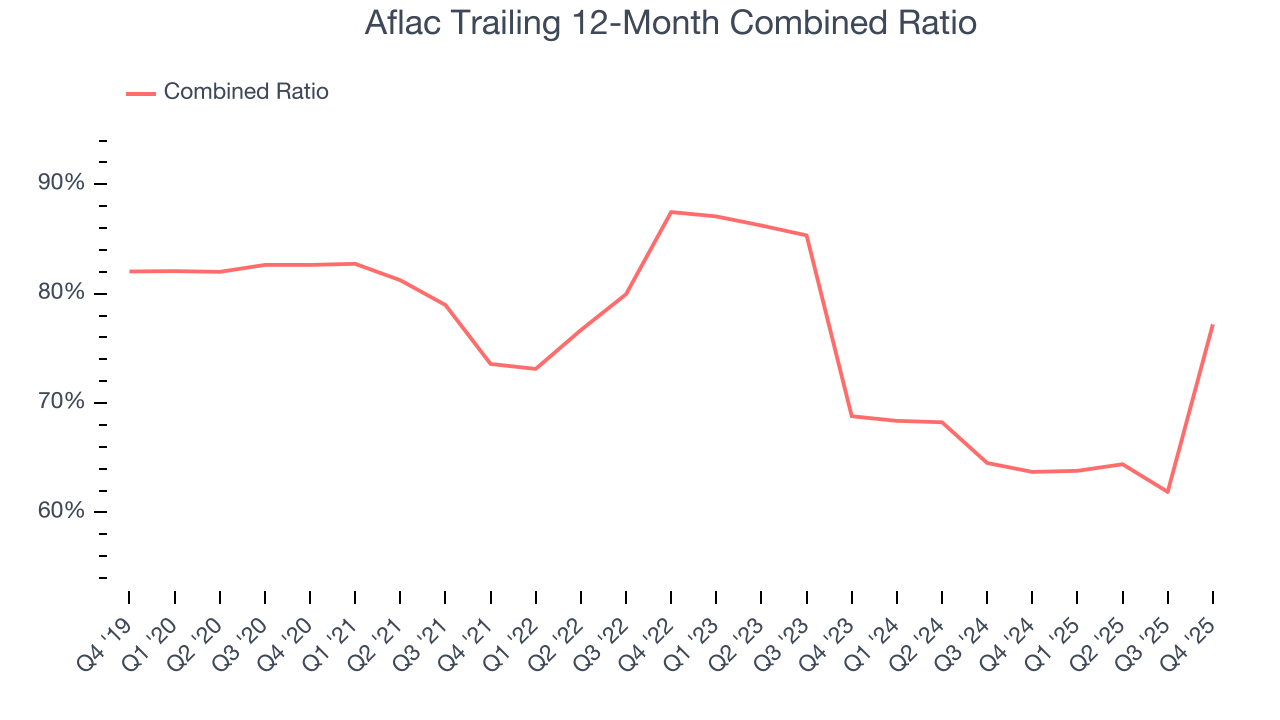
Revenue growth is one major determinant of business quality, and the efficiency of operations is another. For insurance companies, we look at the combined ratio rather than the operating expenses and margins that define sectors such as consumer, tech, and industrials.
The combined ratio is:
- The costs of underwriting (salaries, commissions, overhead) + what an insurer pays out in claims, all divided by net premiums earned
If a company boasts a combined ratio under 100%, it is underwriting profitably. If above 100%, it is losing money on its core operations of selling insurance policies.
Given the calculation, a lower expense ratio is better. Over the last five years, Aflac’s combined ratio has swelled by 5.4 percentage points, going from 73.6% to 77.2%. However, the company gave back some of its expense savings as its combined ratio worsened by 8.4 percentage points on a two-year basis.
8. Earnings Per Share
Revenue trends explain a company’s historical growth, but the long-term change in earnings per share (EPS) points to the profitability of that growth – for example, a company could inflate its sales through excessive spending on advertising and promotions.
Aflac’s EPS grew at an unimpressive 8.8% compounded annual growth rate over the last five years. This performance was better than its 4.1% annualized revenue declines but doesn’t tell us much about its business quality because its combined ratio didn’t improve.
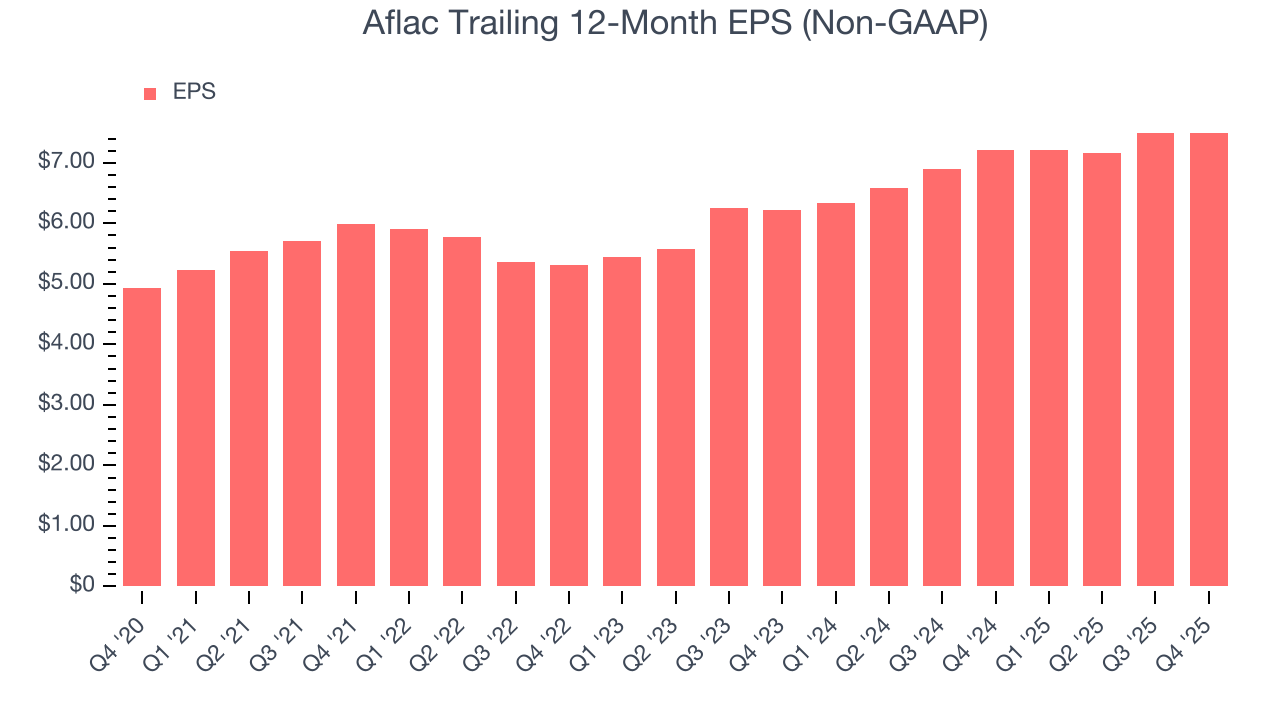
Like with revenue, we analyze EPS over a shorter period to see if we are missing a change in the business.
For Aflac, its two-year annual EPS growth of 9.8% was higher than its five-year trend. Accelerating earnings growth is almost always an encouraging data point.
In Q4, Aflac reported adjusted EPS of $1.57, up from $1.56 in the same quarter last year. Despite growing year on year, this print missed analysts’ estimates. Over the next 12 months, Wall Street expects Aflac’s full-year EPS of $7.50 to shrink by 2.4%.
9. Book Value Per Share (BVPS)
Insurance companies are balance sheet businesses, collecting premiums upfront and paying out claims over time. The float–premiums collected but not yet paid out–are invested, creating an asset base supported by a liability structure. Book value per share (BVPS) captures this dynamic by measuring these assets (investment portfolio, cash, reinsurance recoverables) less liabilities (claim reserves, debt, future policy benefits). BVPS is essentially the residual value for shareholders.
We therefore consider BVPS very important to track for insurers and a metric that sheds light on business quality because it reflects long-term capital growth and is harder to manipulate than more commonly-used metrics like EPS.
Aflac’s BVPS grew at a sluggish 3.2% annual clip over the last five years. However, BVPS growth has accelerated recently, growing by 22.3% annually over the last two years from $38.00 to $56.85 per share.
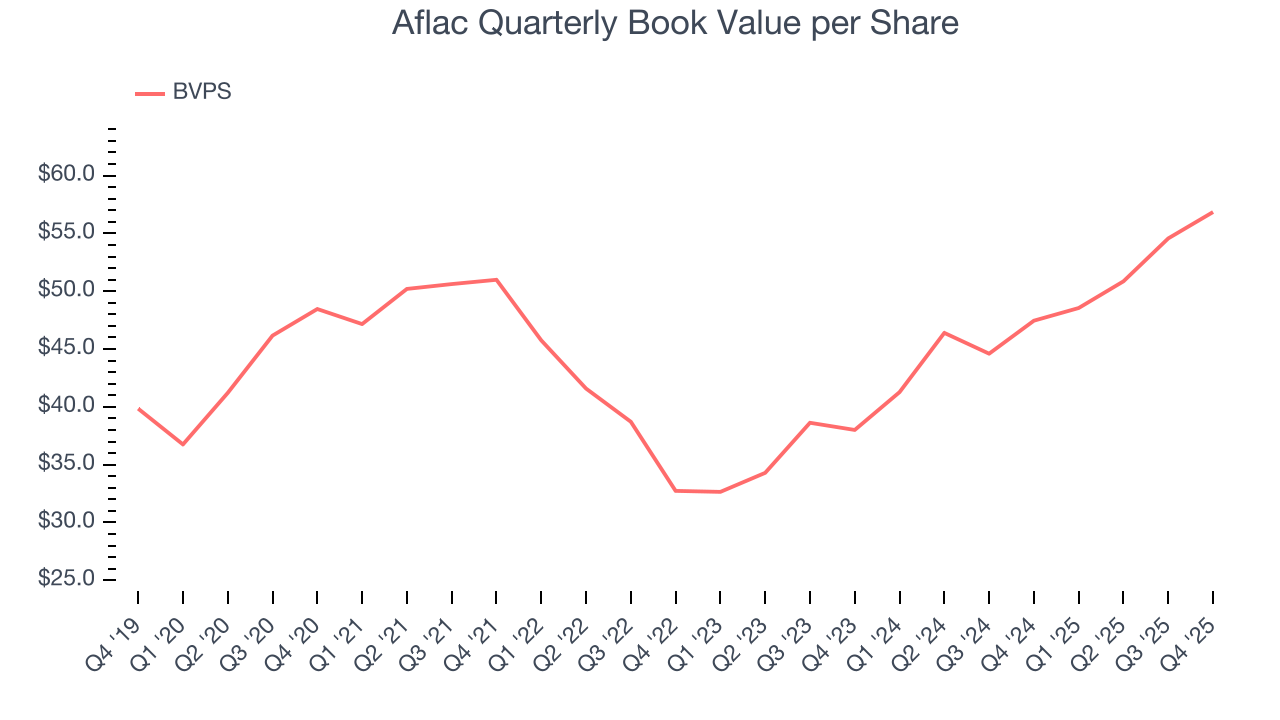
Over the next 12 months, Consensus estimates call for Aflac’s BVPS to shrink by 3.2% to $53.62, a sour projection.
10. Balance Sheet Assessment
The debt-to-equity ratio is a widely used measure to assess a company's balance sheet health. A higher ratio means that a business aggressively financed its growth with debt. This can result in higher earnings (if the borrowed funds are invested profitably) but also increases risk.
If debt levels are too high, there could be difficulties in meeting obligations, especially during economic downturns or periods of rising interest rates if the debt has variable-rate payments.
Aflac currently has $8.41 billion of debt and $29.49 billion of shareholder's equity on its balance sheet, and over the past four quarters, has averaged a debt-to-equity ratio of negative 7.2×. We think this is safe and raises no red flags. In general, we’re comfortable with any ratio below 1.0× for an insurance business. Anything below 0.5× is a bonus.
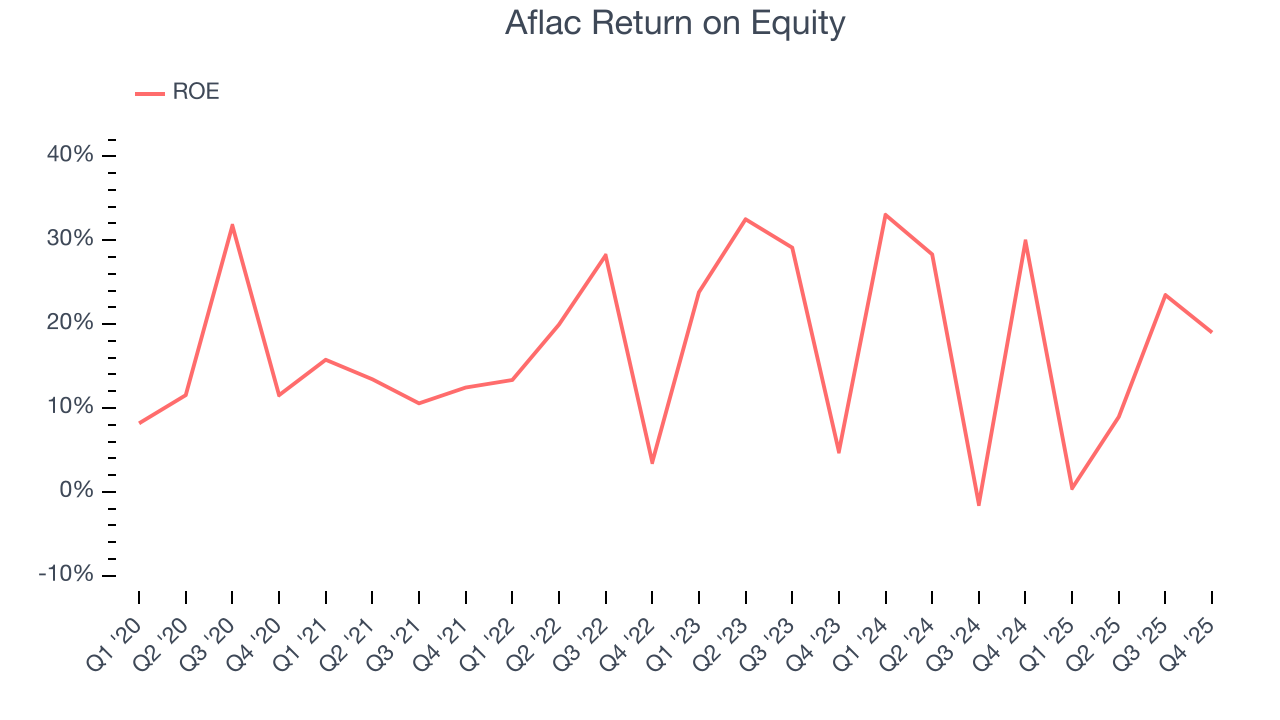
11. Return on Equity
Return on Equity, or ROE, ties everything together and is a vital metric. It tells us how much profit the insurer generates for each dollar of shareholder equity entrusted to management. Over a long period, insurers with higher ROEs tend to compound shareholder wealth faster through retained earnings, buybacks, and dividends.
Over the last five years, Aflac has averaged an ROE of 17.5%, excellent for a company operating in a sector where the average shakes out around 12.5% and those putting up 20%+ are greatly admired. This is a bright spot for Aflac.
12. Key Takeaways from Aflac’s Q4 Results
We were impressed by how significantly Aflac blew past analysts’ book value per share expectations this quarter. We were also excited its revenue outperformed Wall Street’s estimates by a wide margin. On the other hand, its EPS missed. Overall, this print had some key positives. Investors were likely hoping for more, and shares traded down 3.4% to $111.05 immediately following the results.
13. Is Now The Time To Buy Aflac?
Updated: February 4, 2026 at 5:31 PM EST
Before making an investment decision, investors should account for Aflac’s business fundamentals and valuation in addition to what happened in the latest quarter.
Aflac falls short of our quality standards. To kick things off, its revenue has declined over the last five years. And while its market-beating ROE suggests it has been a well-managed company historically, the downside is its estimated sales for the next 12 months are weak. On top of that, its projected EPS for the next year is lacking.
Aflac’s P/B ratio based on the next 12 months is 2x. This valuation tells us it’s a bit of a market darling with a lot of good news priced in - we think other companies feature superior fundamentals at the moment.
Wall Street analysts have a consensus one-year price target of $110.69 on the company (compared to the current share price of $111.05).