
Asana (ASAN)
We wouldn’t buy Asana. Its growth has decelerated and its failure to generate meaningful free cash flow makes us question its prospects.― StockStory Analyst Team
1. News


2. Summary
Why We Think Asana Will Underperform
Born from the founders' frustration with the inefficiencies of email-based collaboration at Facebook, Asana (NYSE:ASAN) provides a work management platform that helps organizations track projects, set goals, and manage workflows in a centralized digital workspace.
- Historical operating margin losses point to an inefficient cost structure
- Extended payback periods on sales investments suggest the company’s platform isn’t resonating enough to drive efficient sales conversions
- Net revenue retention rate of 95.7% shows it has a tough time retaining customers


Asana is in the penalty box. We’re on the lookout for more interesting opportunities.
Why There Are Better Opportunities Than Asana


Asana’s stock price of $6.95 implies a valuation ratio of 1.9x forward price-to-sales. Asana’s valuation may seem like a great deal, but we think there are valid reasons why it’s so cheap.
Our advice is to pay up for elite businesses whose advantages are tailwinds to earnings growth. Don’t get sucked into lower-quality businesses just because they seem like bargains. These mediocre businesses often never achieve a higher multiple as hoped, a phenomenon known as a “value trap”.
3. Asana (ASAN) Research Report: Q4 CY2025 Update
Work management platform Asana (NYSE:ASAN) met Wall Street’s revenue expectations in Q4 CY2025, with sales up 9.2% year on year to $205.6 million. The company expects next quarter’s revenue to be around $203.5 million, close to analysts’ estimates. Its non-GAAP profit of $0.08 per share was in line with analysts’ consensus estimates.
Asana (ASAN) Q4 CY2025 Highlights:
- Revenue: $205.6 million vs analyst estimates of $205.2 million (9.2% year-on-year growth, in line)
- Adjusted EPS: $0.08 vs analyst estimates of $0.07 (in line)
- Adjusted Operating Income: $18.17 million vs analyst estimates of $15.34 million (8.8% margin, 18.5% beat)
- Revenue Guidance for Q1 CY2026 is $203.5 million at the midpoint, roughly in line with what analysts were expecting
- Adjusted EPS guidance for the upcoming financial year 2027 is $0.37 at the midpoint, beating analyst estimates by 2.7%
- Operating Margin: -16.5%, up from -33.8% in the same quarter last year
- Free Cash Flow Margin: 11.8%, up from 6.7% in the previous quarter
- Customers: 25,928 customers paying more than $5,000 annually
- Billings: $234.3 million at quarter end, up 12.1% year on year
- Market Capitalization: $1.68 billion
Company Overview
Born from the founders' frustration with the inefficiencies of email-based collaboration at Facebook, Asana (NYSE:ASAN) provides a work management platform that helps organizations track projects, set goals, and manage workflows in a centralized digital workspace.
The company's platform is built around its proprietary Asana Work Graph data model, which captures the relationships between work units (tasks, projects, goals), the people doing the work, and all associated information. This structure creates a single source of truth for organizational work, eliminating the need for status meetings and reducing time spent on coordination.
Asana's platform offers multiple interactive views—including lists, boards, timelines, and calendars—allowing different teams to visualize the same underlying data in whatever format works best for them. Users can create automated workflows with a point-and-click builder, set rules to eliminate repetitive tasks, and standardize processes with customizable forms and templates.
For executives, Asana provides visibility into company-wide goals and real-time progress tracking. Team leads gain insights into resource allocation and potential bottlenecks, while individuals benefit from clear task ownership and priorities. A typical enterprise customer might use Asana to manage complex cross-functional initiatives like product launches or employee onboarding, with leadership tracking progress against strategic objectives.
Asana generates revenue through subscription plans, with pricing tiers based on features and functionality. The company has enhanced its platform with AI capabilities called Asana Intelligence, which leverages the Work Graph to provide contextual insights, generate status updates, and answer questions about projects. Asana's platform integrates with over 300 third-party applications, including Microsoft 365, Google Workspace, Salesforce, and Slack, allowing teams to connect their existing tools into their workflows.
4. Project Management Software
The future of work requires teams to collaborate across departments and remote offices. Project management software is both driving this change and benefiting from it. While the trend of collaborative work management has been strong for a while, the Covid pandemic has definitively accelerated the demand for tools that allow work to be done remotely.
Asana competes with project management and collaboration tools like Monday.com (NASDAQ:MNDY), Smartsheet (NYSE:SMAR), Atlassian's Trello and Jira (NASDAQ:TEAM), and Microsoft's Planner (NASDAQ:MSFT). The company also faces competition from broader collaboration platforms like Notion, Airtable, and ClickUp.
5. Revenue Growth
Reviewing a company’s long-term sales performance reveals insights into its quality. Any business can experience short-term success, but top-performing ones enjoy sustained growth for years. Over the last five years, Asana grew its sales at an impressive 28.4% compounded annual growth rate. Its growth beat the average software company and shows its offerings resonate with customers.
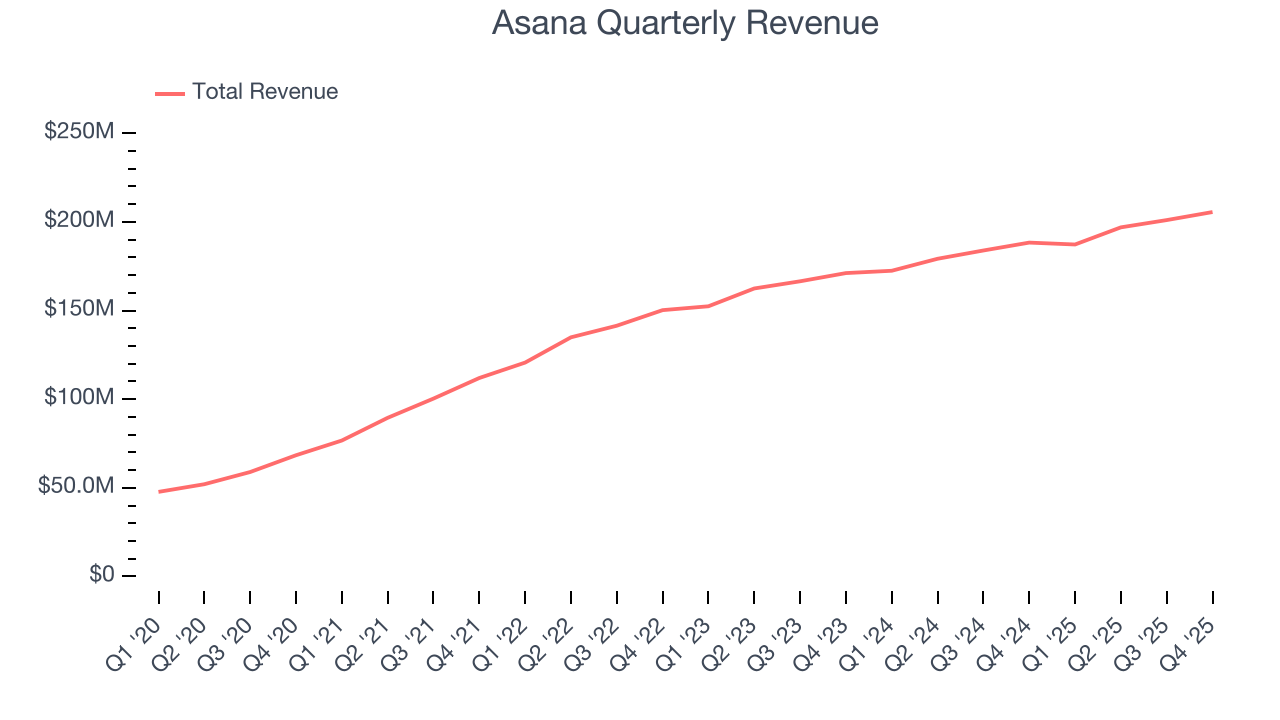
Long-term growth is the most important, but within software, a half-decade historical view may miss new innovations or demand cycles. Asana’s recent performance shows its demand has slowed significantly as its annualized revenue growth of 10.1% over the last two years was well below its five-year trend. 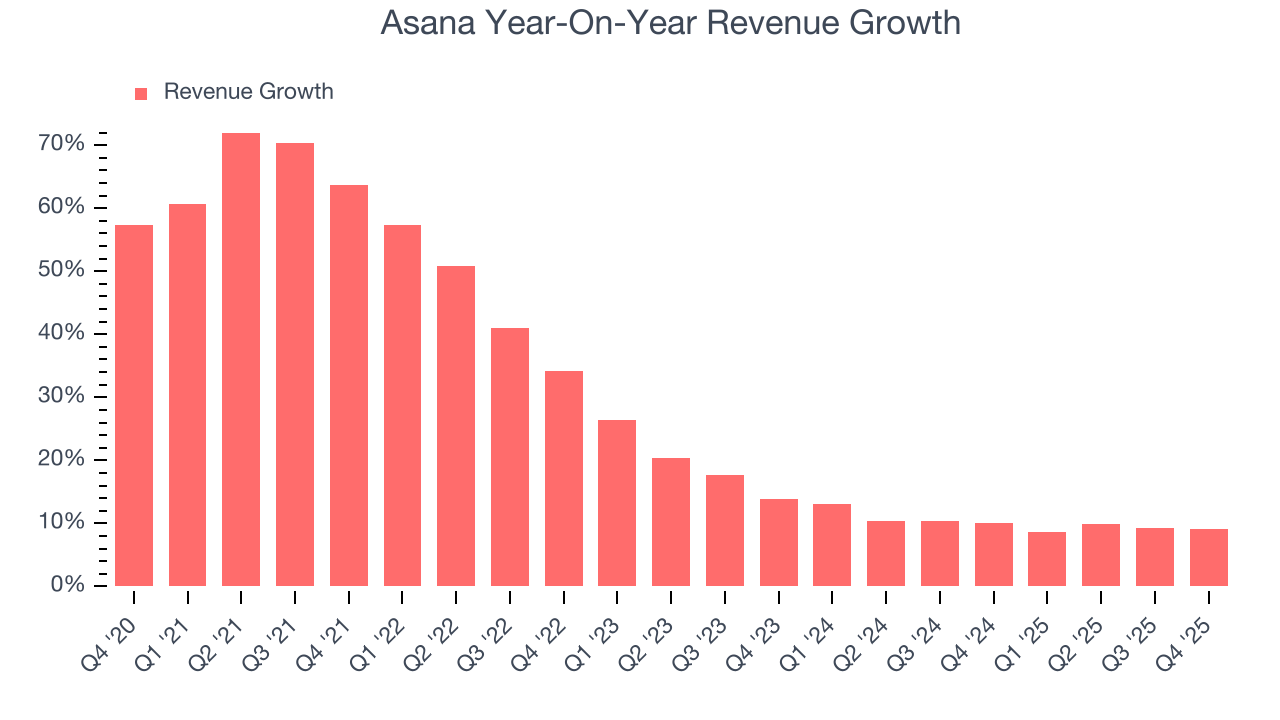
This quarter, Asana grew its revenue by 9.2% year on year, and its $205.6 million of revenue was in line with Wall Street’s estimates. Company management is currently guiding for a 8.7% year-on-year increase in sales next quarter.
Looking further ahead, sell-side analysts expect revenue to grow 8.4% over the next 12 months, a slight deceleration versus the last two years. This projection is underwhelming and indicates its products and services will face some demand challenges.
6. Billings
Billings is a non-GAAP metric that is often called “cash revenue” because it shows how much money the company has collected from customers in a certain period. This is different from revenue, which must be recognized in pieces over the length of a contract.
Asana’s billings came in at $234.3 million in Q4, and over the last four quarters, its growth was underwhelming as it averaged 9.4% year-on-year increases. This performance mirrored its total sales and suggests that increasing competition is causing challenges in acquiring/retaining customers. 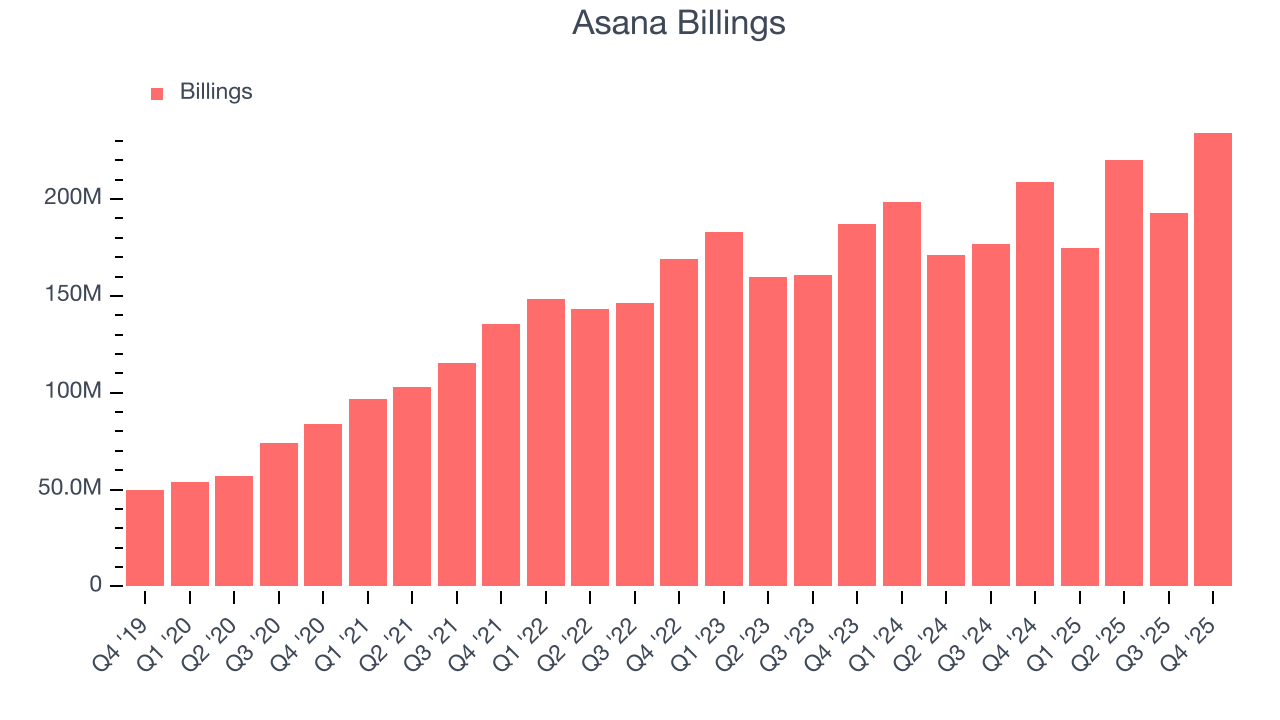
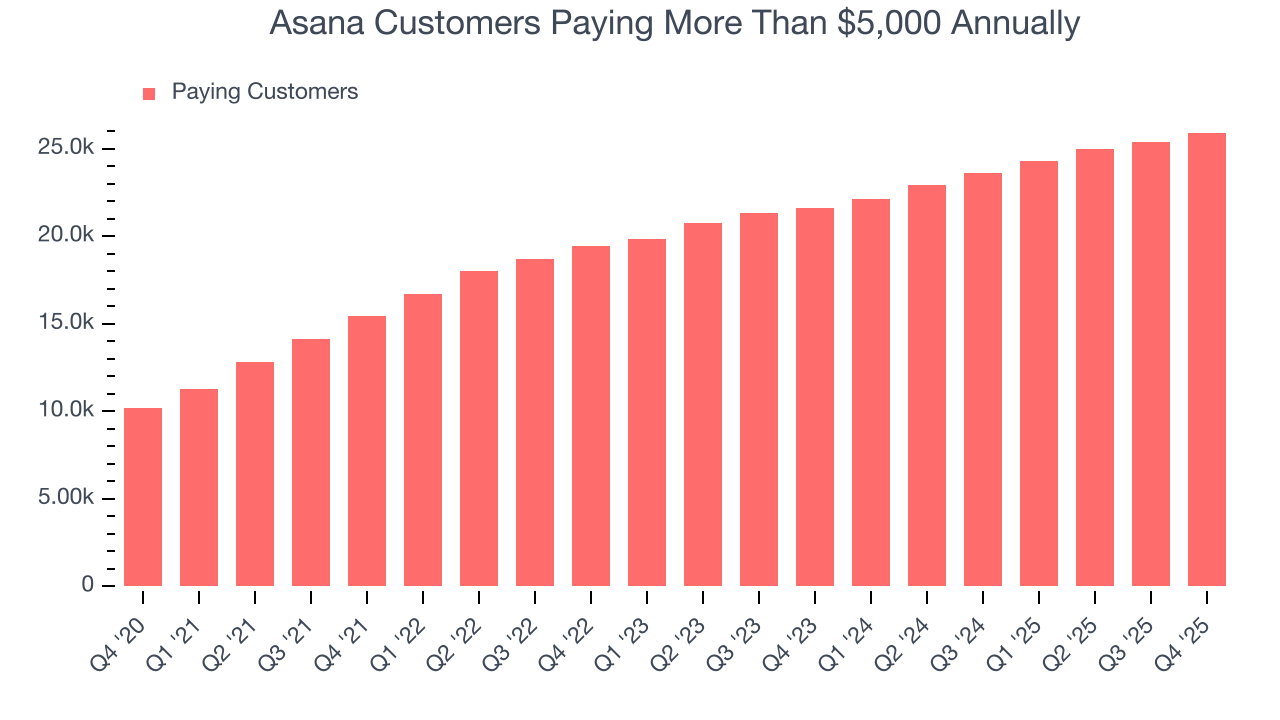
7. Enterprise Customer Base
This quarter, Asana reported 25,928 enterprise customers paying more than $5,000 annually, an increase of 515 from the previous quarter. That’s quite a bit more contract wins than last quarter but also quite a bit below what we’ve observed over the previous year. This indicates the company is optimizing its go-to-market strategy to reinvigorate growth.
8. Customer Acquisition Efficiency
The customer acquisition cost (CAC) payback period represents the months required to recover the cost of acquiring a new customer. Essentially, it’s the break-even point for sales and marketing investments. A shorter CAC payback period is ideal, as it implies better returns on investment and business scalability.
Asana’s recent customer acquisition efforts haven’t yielded returns as its CAC payback period was negative this quarter, meaning its incremental sales and marketing investments outpaced its revenue. This inefficiency partly stems from its focus on enterprise clients who require some degree of customization, resulting in long onboarding periods that delay customer spending.
9. Gross Margin & Pricing Power
For software companies like Asana, gross profit tells us how much money remains after paying for the base cost of products and services (typically servers, licenses, and certain personnel). These costs are usually low as a percentage of revenue, explaining why software is more lucrative than other sectors.
Asana’s gross margin is one of the highest in the software sector, an output of its asset-lite business model and strong pricing power. It also enables the company to fund large investments in new products and sales during periods of rapid growth to achieve outsized profits at scale. As you can see below, it averaged an elite 89% gross margin over the last year. Said differently, roughly $89.03 was left to spend on selling, marketing, and R&D for every $100 in revenue.
The market not only cares about gross margin levels but also how they change over time because expansion creates firepower for profitability and free cash generation. Asana has seen gross margins decline by 1.1 percentage points over the last 2 year, which is poor compared to software peers.
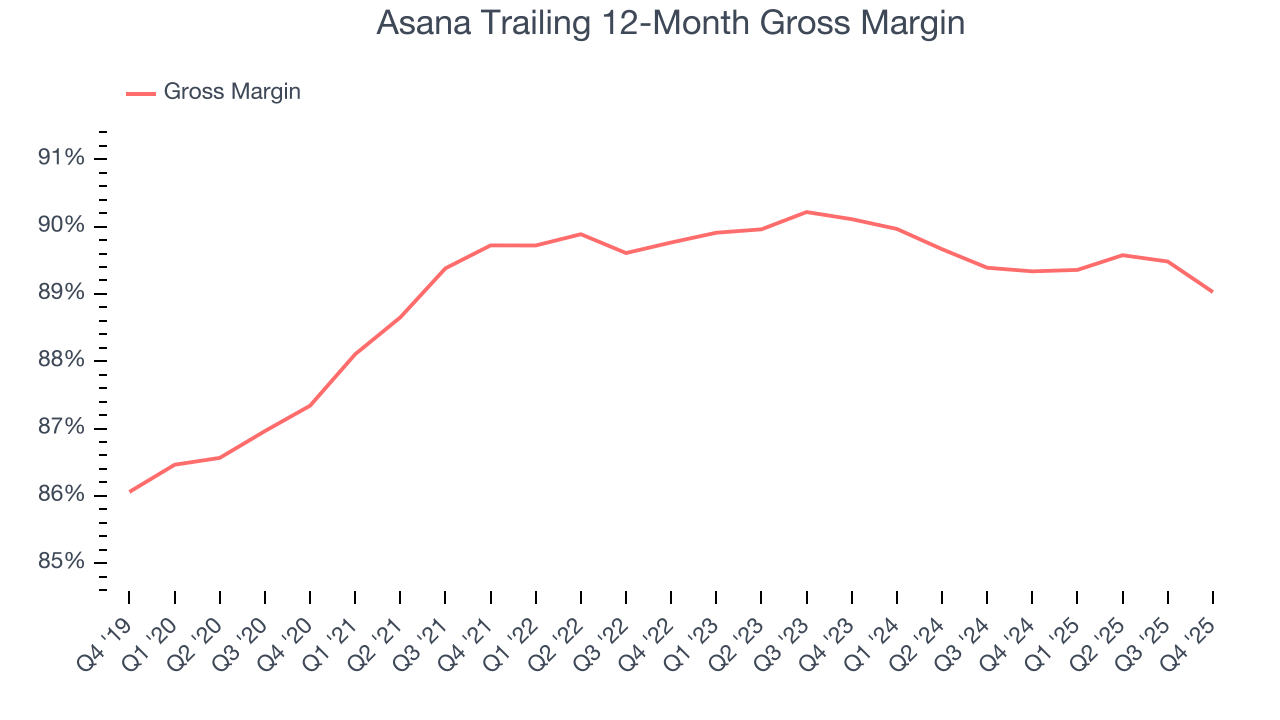
This quarter, Asana’s gross profit margin was 87.8% , marking a 1.8 percentage point decrease from 89.6% in the same quarter last year. On a wider time horizon, the company’s full-year margin has remained steady over the past four quarters, suggesting its input costs have been stable and it isn’t under pressure to lower prices.
10. Operating Margin
While many software businesses point investors to their adjusted profits, which exclude stock-based compensation (SBC), we prefer GAAP operating margin because SBC is a legitimate expense used to attract and retain talent. This is one of the best measures of profitability because it shows how much money a company takes home after developing, marketing, and selling its products.
Asana’s expensive cost structure has contributed to an average operating margin of negative 25% over the last year. Unprofitable, high-growth software companies require extra attention because they spend heaps of money to capture market share. As seen in its fast historical revenue growth, this strategy seems to have worked so far, but it’s unclear what would happen if Asana reeled back its investments. Wall Street seems to think it will face some obstacles, and we tend to agree.
Over the last two years, Asana’s expanding sales gave it operating leverage as its margin rose by 11.9 percentage points. Still, it will take much more for the company to reach long-term profitability.
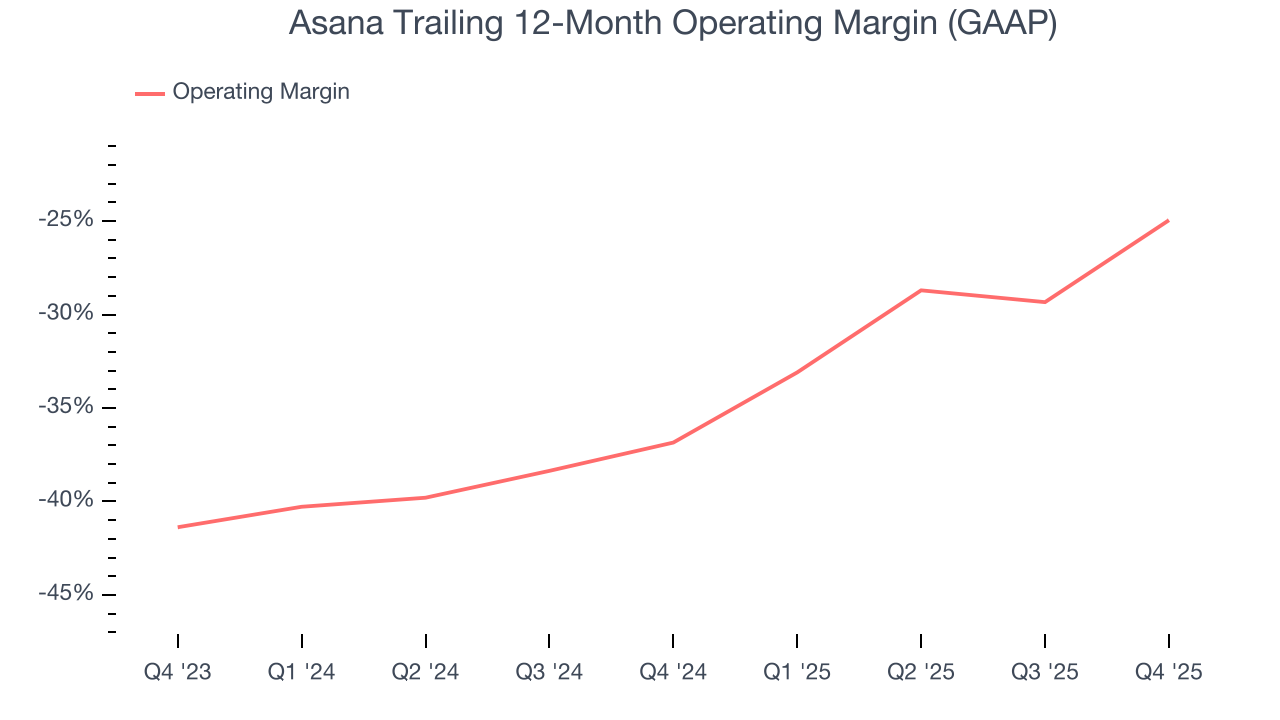
Asana’s operating margin was negative 16.5% this quarter.
11. Cash Is King
Free cash flow isn't a prominently featured metric in company financials and earnings releases, but we think it's telling because it accounts for all operating and capital expenses, making it tough to manipulate. Cash is king.
Asana has shown weak cash profitability over the last year, giving the company limited opportunities to return capital to shareholders. Its free cash flow margin averaged 9.7%, subpar for a software business.
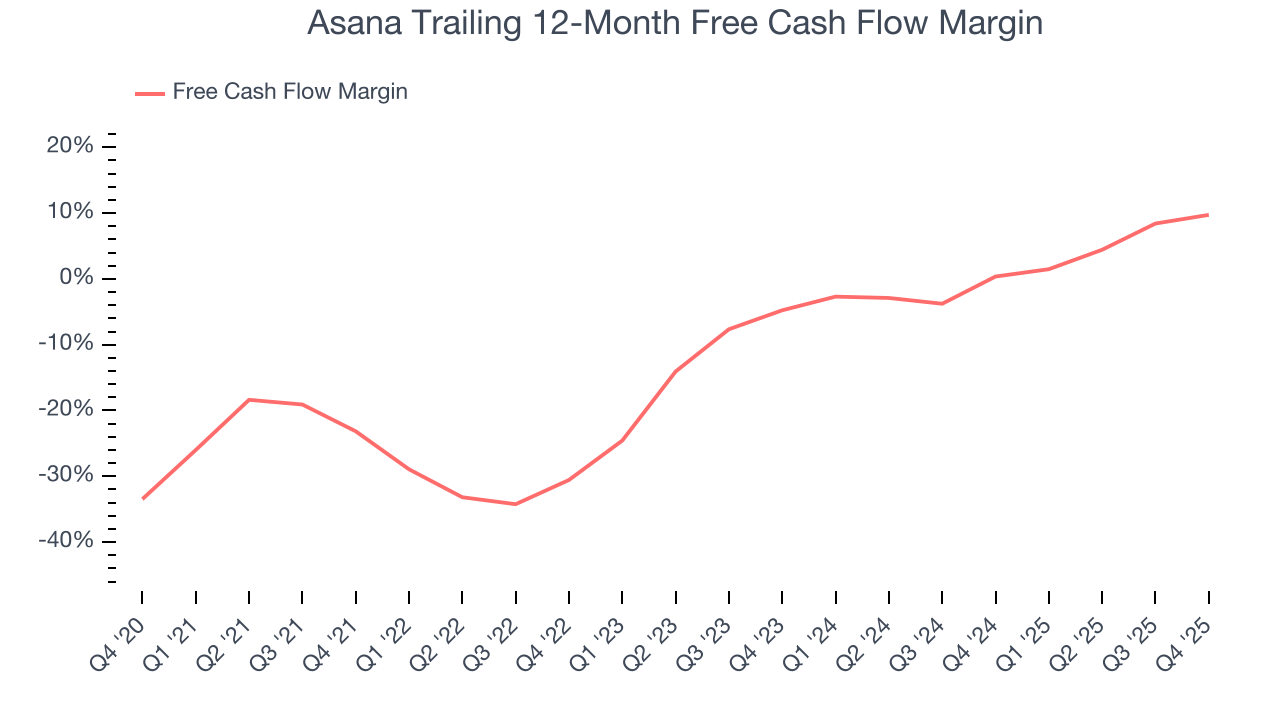
Asana’s free cash flow clocked in at $24.18 million in Q4, equivalent to a 11.8% margin. This result was good as its margin was 5.2 percentage points higher than in the same quarter last year, but we wouldn’t read too much into the short term because investment needs can be seasonal, causing temporary swings. Long-term trends are more important.
Over the next year, analysts predict Asana’s cash conversion will improve. Their consensus estimates imply its free cash flow margin of 9.7% for the last 12 months will increase to 14.6%, it options for capital deployment (investments, share buybacks, etc.).
12. Balance Sheet Assessment
Businesses that maintain a cash surplus face reduced bankruptcy risk.
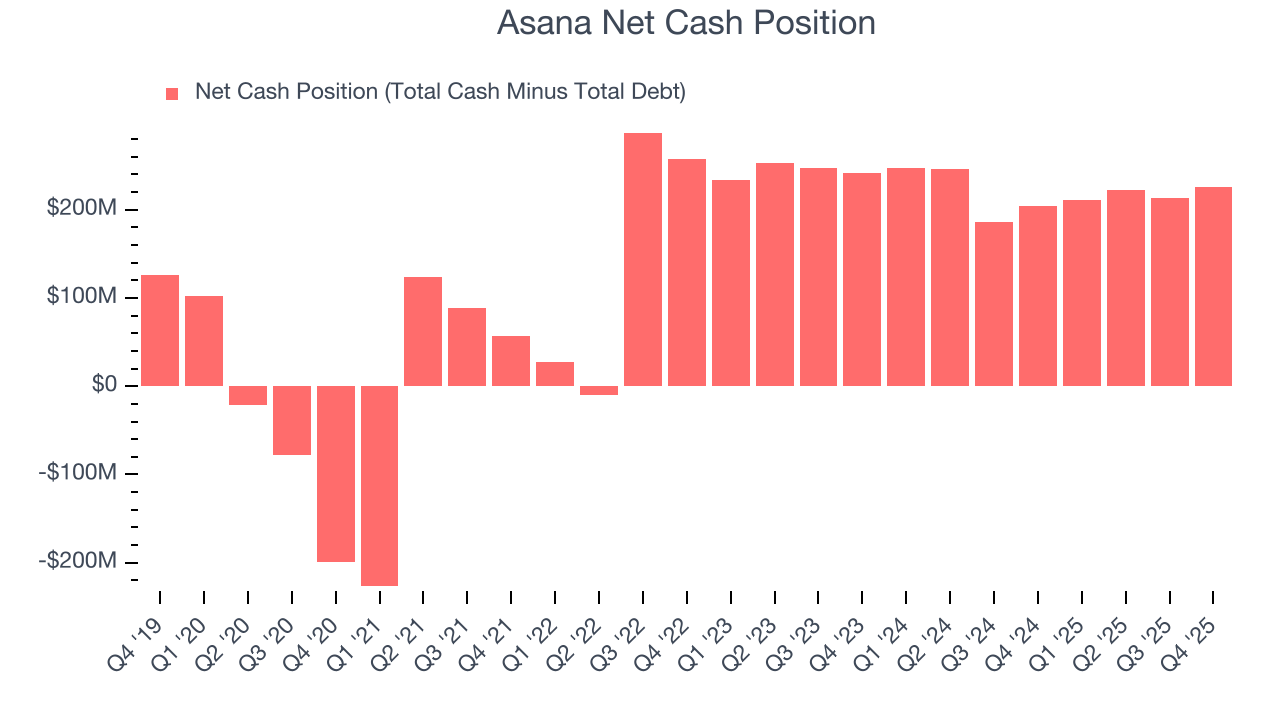
Asana is a well-capitalized company with $434 million of cash and $208.6 million of debt on its balance sheet. This $225.5 million net cash position is 13% of its market cap and gives it the freedom to borrow money, return capital to shareholders, or invest in growth initiatives. Leverage is not an issue here.
13. Key Takeaways from Asana’s Q4 Results
It was great to see Asana’s EPS guidance for next quarter top analysts’ expectations. We were also glad its full-year EPS guidance exceeded Wall Street’s estimates. On the other hand, its revenue guidance for next quarter was in line and its full-year revenue guidance was in line with Wall Street’s estimates. Overall, this print was mixed but still had some key positives. Investors were likely hoping for more, and shares traded down 6.2% to $6.85 immediately after reporting.
14. Is Now The Time To Buy Asana?
Updated: March 14, 2026 at 10:10 PM EDT
A common mistake we notice when investors are deciding whether to buy a stock or not is that they simply look at the latest earnings results. Business quality and valuation matter more, so we urge you to understand these dynamics as well.
We see the value of companies addressing major business pain points, but in the case of Asana, we’re out. Although its revenue growth was strong over the last five years, it’s expected to deteriorate over the next 12 months and its operating margins reveal poor profitability compared to other software companies. And while the company’s admirable gross margin indicates excellent unit economics, the downside is its software has low switching costs and high turnover.
Asana’s price-to-sales ratio based on the next 12 months is 1.9x. This valuation is reasonable, but the company’s shaky fundamentals present too much downside risk. There are more exciting stocks to buy at the moment.
Wall Street analysts have a consensus one-year price target of $10.12 on the company (compared to the current share price of $6.95).
Although the price target is bullish, readers should exercise caution because analysts tend to be overly optimistic. The firms they work for, often big banks, have relationships with companies that extend into fundraising, M&A advisory, and other rewarding business lines. As a result, they typically hesitate to say bad things for fear they will lose out. We at StockStory do not suffer from such conflicts of interest, so we’ll always tell it like it is.