
Boise Cascade (BCC)
We wouldn’t recommend Boise Cascade. Its poor sales growth and falling returns on capital suggest its growth opportunities are shrinking.― StockStory Analyst Team
1. News


2. Summary
Why We Think Boise Cascade Will Underperform
Formed through the merger of two lumber companies, Boise Cascade Company (NYSE:BCC) manufactures and distributes wood products and other building materials.
- Customers postponed purchases of its products and services this cycle as its revenue declined by 3.2% annually over the last two years
- Performance over the past five years shows its incremental sales were much less profitable, as its earnings per share fell by 6% annually
- High input costs result in an inferior gross margin of 20.3% that must be offset through higher volumes


Boise Cascade’s quality is insufficient. Our attention is focused on better businesses.
Why There Are Better Opportunities Than Boise Cascade


Boise Cascade’s stock price of $68.30 implies a valuation ratio of 18.6x forward P/E. Yes, this valuation multiple is lower than that of other industrials peers, but we’ll remind you that you often get what you pay for.
Our advice is to pay up for elite businesses whose advantages are tailwinds to earnings growth. Don’t get sucked into lower-quality businesses just because they seem like bargains. These mediocre businesses often never achieve a higher multiple as hoped, a phenomenon known as a “value trap”.
3. Boise Cascade (BCC) Research Report: Q4 CY2025 Update
Building products company Boise Cascade Company (NYSE:BCC) reported revenue ahead of Wall Street’s expectations in Q4 CY2025, but sales fell by 6.8% year on year to $1.46 billion. Its GAAP profit of $0.24 per share was significantly above analysts’ consensus estimates.
Boise Cascade (BCC) Q4 CY2025 Highlights:
- Revenue: $1.46 billion vs analyst estimates of $1.45 billion (6.8% year-on-year decline, 0.6% beat)
- EPS (GAAP): $0.24 vs analyst estimates of $0.12 (significant beat)
- Adjusted EBITDA: $57.19 million vs analyst estimates of $48.6 million (3.9% margin, 17.7% beat)
- Operating Margin: 1.1%, down from 5.9% in the same quarter last year
- Free Cash Flow Margin: 5.3%, up from 0% in the same quarter last year
- Market Capitalization: $3.04 billion
Company Overview
Formed through the merger of two lumber companies, Boise Cascade Company (NYSE:BCC) manufactures and distributes wood products and other building materials.
Specifically, it was formed in 1957 through the merger of Cascade Lumber Company of Yakima, Washington, and Boise Payette Lumber Company of Boise. The new combined company focused on ownership of timberlands, the harvesting of timber, and the manufacturing of lumber products. Boise Cascade quickly established retail outlets for its wholesale distribution operations.
Today, Boise Cascade serves both the residential and commercial construction markets. The engineered wood, plywood, and lumber that it manufactures and sells is integral to many construction projects. Customers such as homebuilders and contractors know that Boise Cascade's engineered wood products are designed to support heavy loads and offer long-term stability, for example.
The primary revenue sources for Boise Cascade include the sale of wood products and building materials. Given trends in technology and digitization, the company also offers software for builders and contractors to perform 3D modeling and material load analysis, for example. While this is a small portion of revenue, it speaks to Boise Cascade’s effort to generate more predictable revenue that is less reliant on the ebbs and flows of construction cycles.
4. Building Material Distributors
Supply chain and inventory management are themes that grew in focus after COVID wreaked havoc on the global movement of raw materials and components. Building materials distributors that boast reliable selection and quickly deliver products to customers can benefit from this theme. While e-commerce hasn’t disrupted industrial distribution as much as consumer retail, it is forcing investment in digital capabilities to communicate with and serve customers everywhere. Additionally, building materials distributors are at the whim of economic cycles that impact the capital spending and construction projects that can juice demand.
Competitors in the building materials industry include Builders FirstSource (NASDAQ:BLDR), Owens Corning (NYSE:OC), and Beacon Roofing Supply (NASDAQ:BECN).
5. Revenue Growth
A company’s long-term performance is an indicator of its overall quality. Any business can experience short-term success, but top-performing ones enjoy sustained growth for years. Over the last five years, Boise Cascade grew its sales at a sluggish 3.2% compounded annual growth rate. This fell short of our benchmark for the industrials sector and is a tough starting point for our analysis.
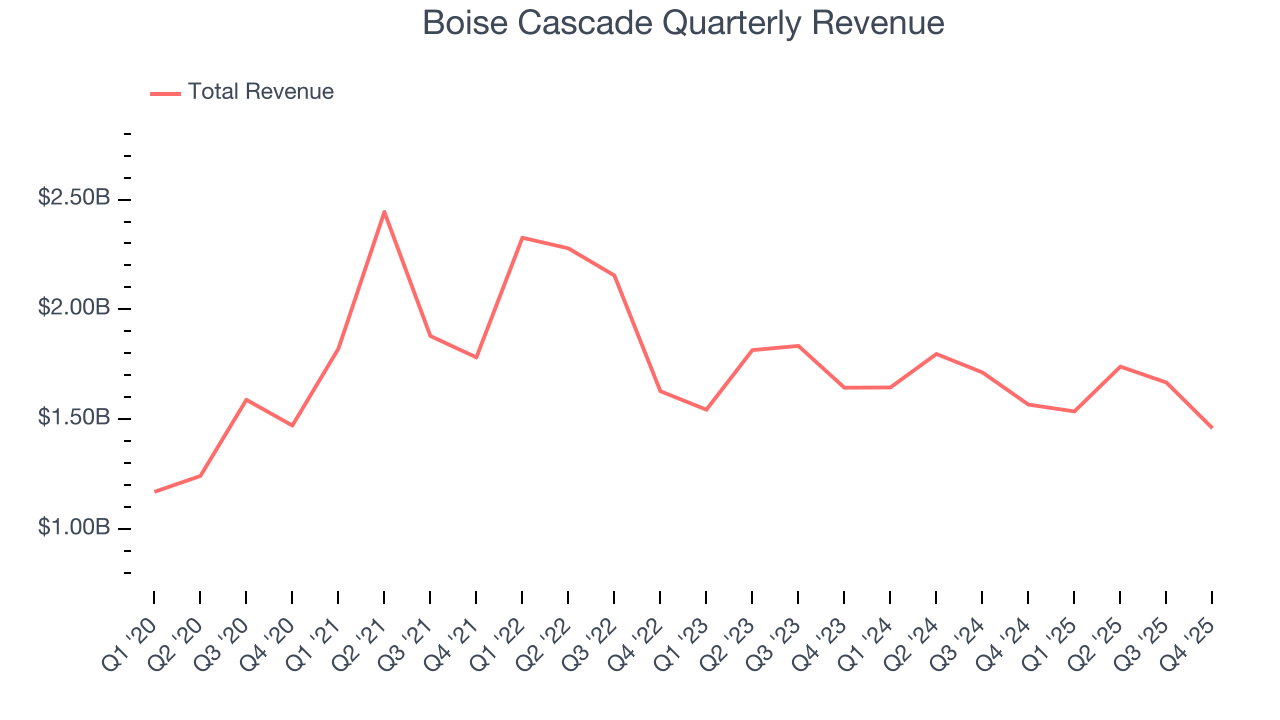
Long-term growth is the most important, but within industrials, a half-decade historical view may miss new industry trends or demand cycles. Boise Cascade’s performance shows it grew in the past but relinquished its gains over the last two years, as its revenue fell by 3.2% annually. 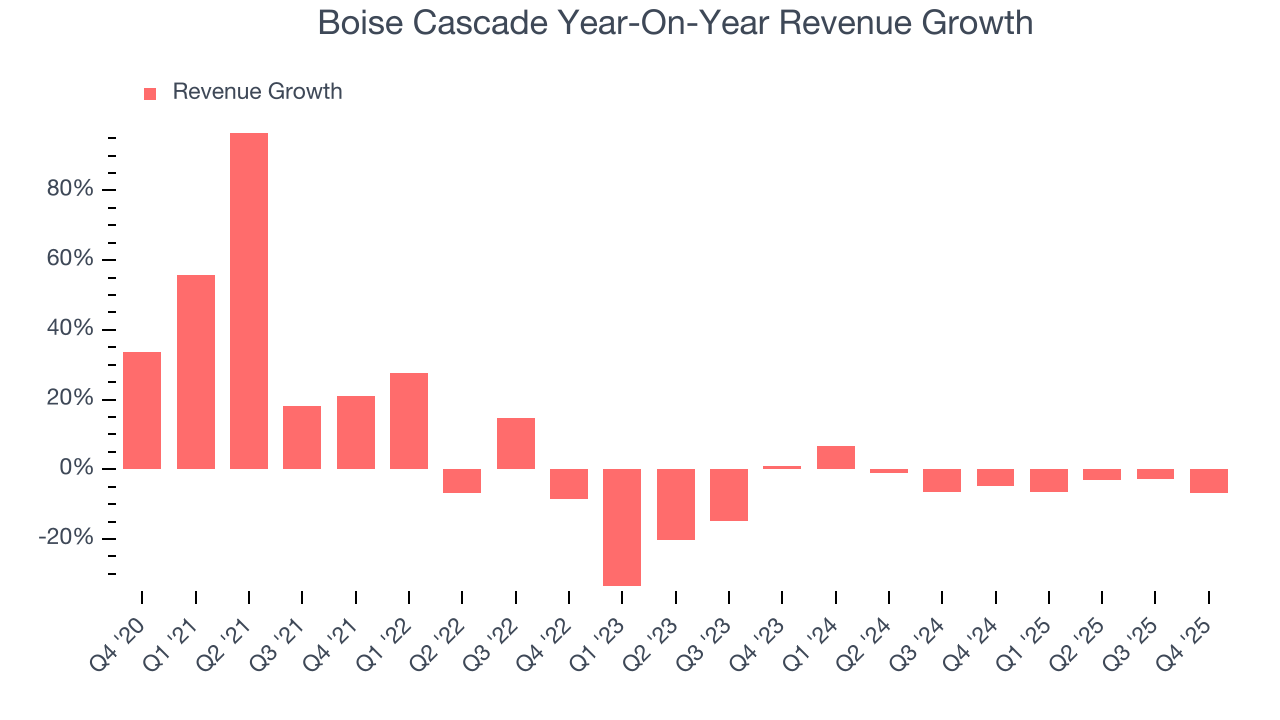
We can dig further into the company’s revenue dynamics by analyzing its most important segments, Building Material Distribution and Wood products, which are 93.4% and 24.2% of revenue. Over the last two years, Boise Cascade’s Building Material Distribution revenue (plywood, siding, insulation) averaged 3.7% year-on-year declines while its Wood products revenue (lumber and beams) averaged 11% declines. 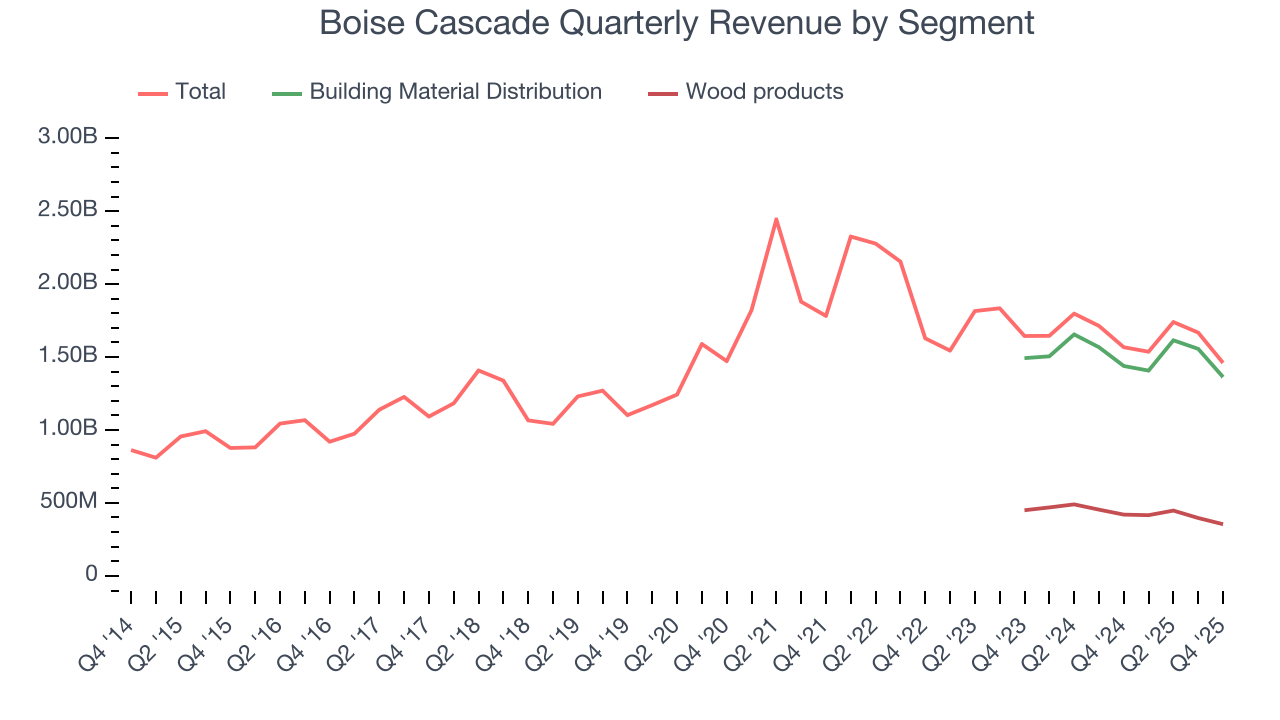
This quarter, Boise Cascade’s revenue fell by 6.8% year on year to $1.46 billion but beat Wall Street’s estimates by 0.6%.
Looking ahead, sell-side analysts expect revenue to grow 3.1% over the next 12 months. While this projection suggests its newer products and services will fuel better top-line performance, it is still below the sector average.
6. Gross Margin & Pricing Power
Boise Cascade has bad unit economics for an industrials business, signaling it operates in a competitive market. As you can see below, it averaged a 20.3% gross margin over the last five years. That means Boise Cascade paid its suppliers a lot of money ($79.73 for every $100 in revenue) to run its business. 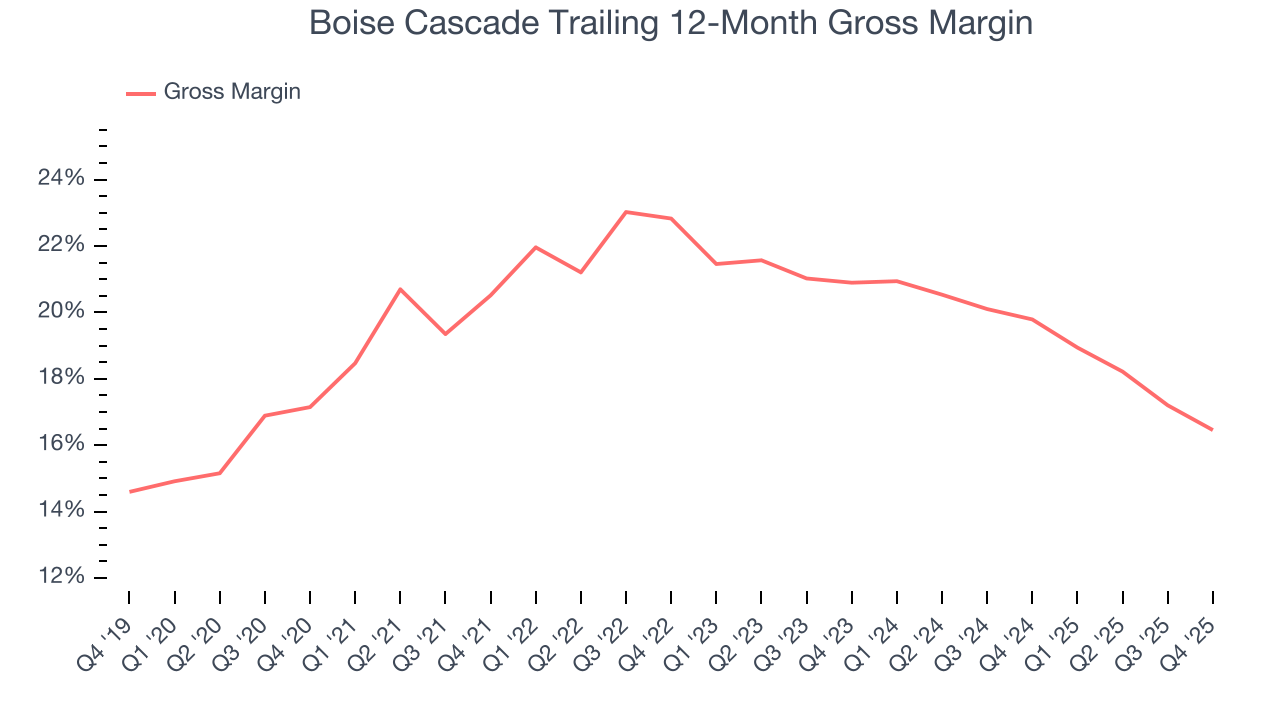
This quarter, Boise Cascade’s gross profit margin was 15.8% , marking a 3.1 percentage point decrease from 19% in the same quarter last year. Boise Cascade’s full-year margin has also been trending down over the past 12 months, decreasing by 3.3 percentage points. If this move continues, it could suggest a more competitive environment with some pressure to lower prices and higher input costs (such as raw materials and manufacturing expenses).
7. Operating Margin
Operating margin is one of the best measures of profitability because it tells us how much money a company takes home after procuring and manufacturing its products, marketing and selling those products, and most importantly, keeping them relevant through research and development.
Boise Cascade has done a decent job managing its cost base over the last five years. The company has produced an average operating margin of 9.4%, higher than the broader industrials sector.
Analyzing the trend in its profitability, Boise Cascade’s operating margin decreased by 9.4 percentage points over the last five years. This raises questions about the company’s expense base because its revenue growth should have given it leverage on its fixed costs, resulting in better economies of scale and profitability.
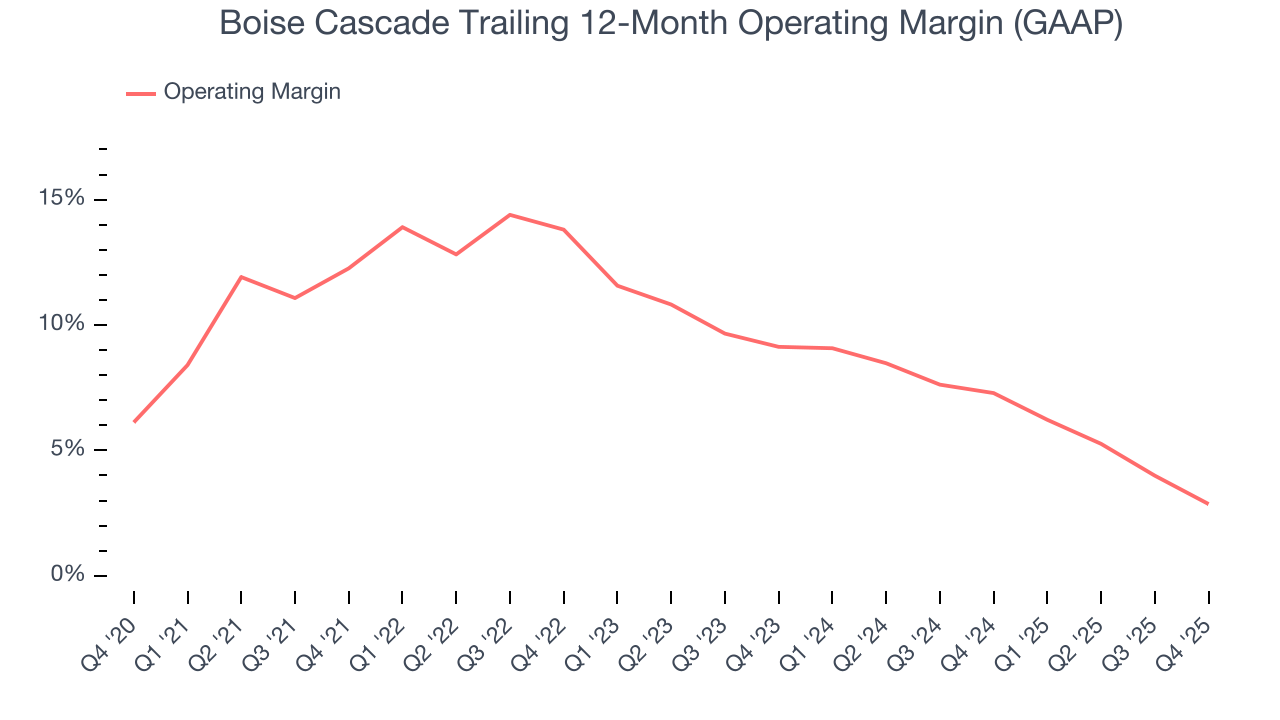
In Q4, Boise Cascade generated an operating margin profit margin of 1.1%, down 4.8 percentage points year on year. Since Boise Cascade’s operating margin decreased more than its gross margin, we can assume it was less efficient because expenses such as marketing, R&D, and administrative overhead increased.
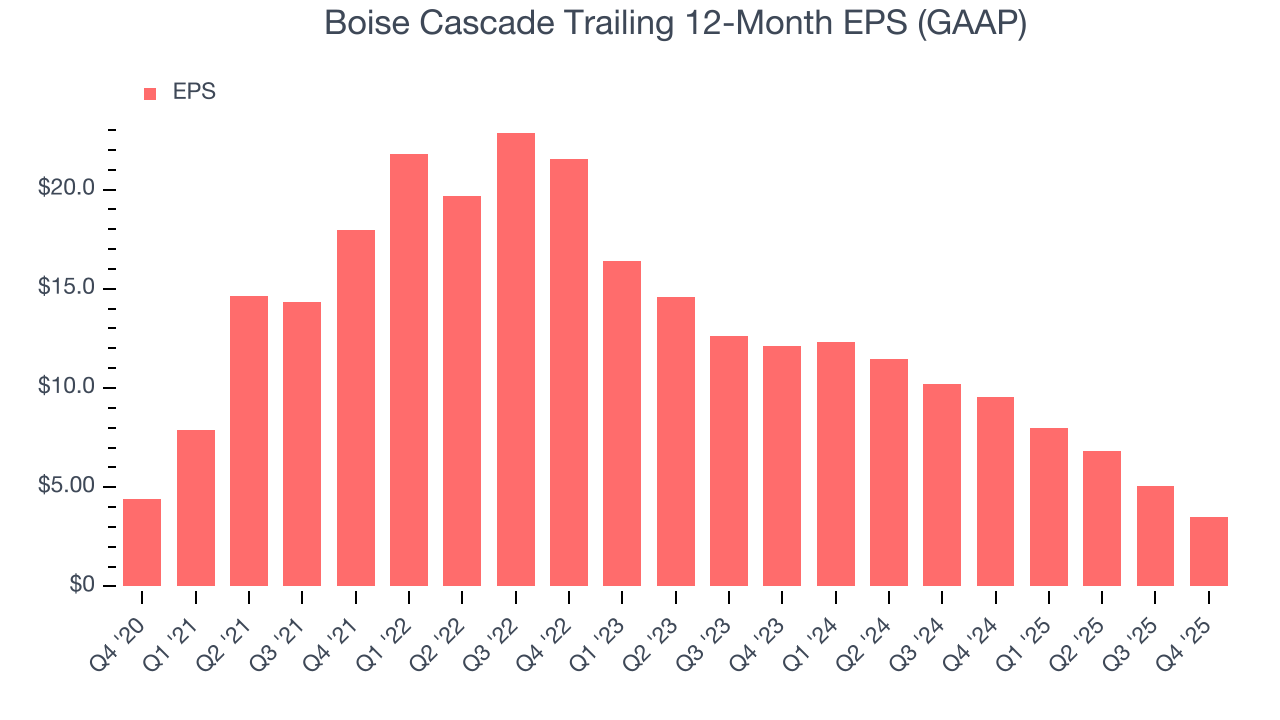
8. Earnings Per Share
Revenue trends explain a company’s historical growth, but the long-term change in earnings per share (EPS) points to the profitability of that growth – for example, a company could inflate its sales through excessive spending on advertising and promotions.
Sadly for Boise Cascade, its EPS declined by 4.5% annually over the last five years while its revenue grew by 3.2%. This tells us the company became less profitable on a per-share basis as it expanded due to non-fundamental factors such as interest expenses and taxes.
We can take a deeper look into Boise Cascade’s earnings to better understand the drivers of its performance. As we mentioned earlier, Boise Cascade’s operating margin declined by 9.4 percentage points over the last five years. This was the most relevant factor (aside from the revenue impact) behind its lower earnings; interest expenses and taxes can also affect EPS but don’t tell us as much about a company’s fundamentals.
Like with revenue, we analyze EPS over a more recent period because it can provide insight into an emerging theme or development for the business.
For Boise Cascade, its two-year annual EPS declines of 46.1% show it’s continued to underperform. These results were bad no matter how you slice the data.
In Q4, Boise Cascade reported EPS of $0.24, down from $1.78 in the same quarter last year. Despite falling year on year, this print easily cleared analysts’ estimates. Over the next 12 months, Wall Street expects Boise Cascade’s full-year EPS of $3.52 to grow 8.3%.
9. Cash Is King
If you’ve followed StockStory for a while, you know we emphasize free cash flow. Why, you ask? We believe that in the end, cash is king, and you can’t use accounting profits to pay the bills.
Boise Cascade has shown decent cash profitability, giving it some flexibility to reinvest or return capital to investors. The company’s free cash flow margin averaged 6% over the last five years, slightly better than the broader industrials sector.
Taking a step back, we can see that Boise Cascade’s margin dropped by 6.9 percentage points during that time. Continued declines could signal it is in the middle of an investment cycle.
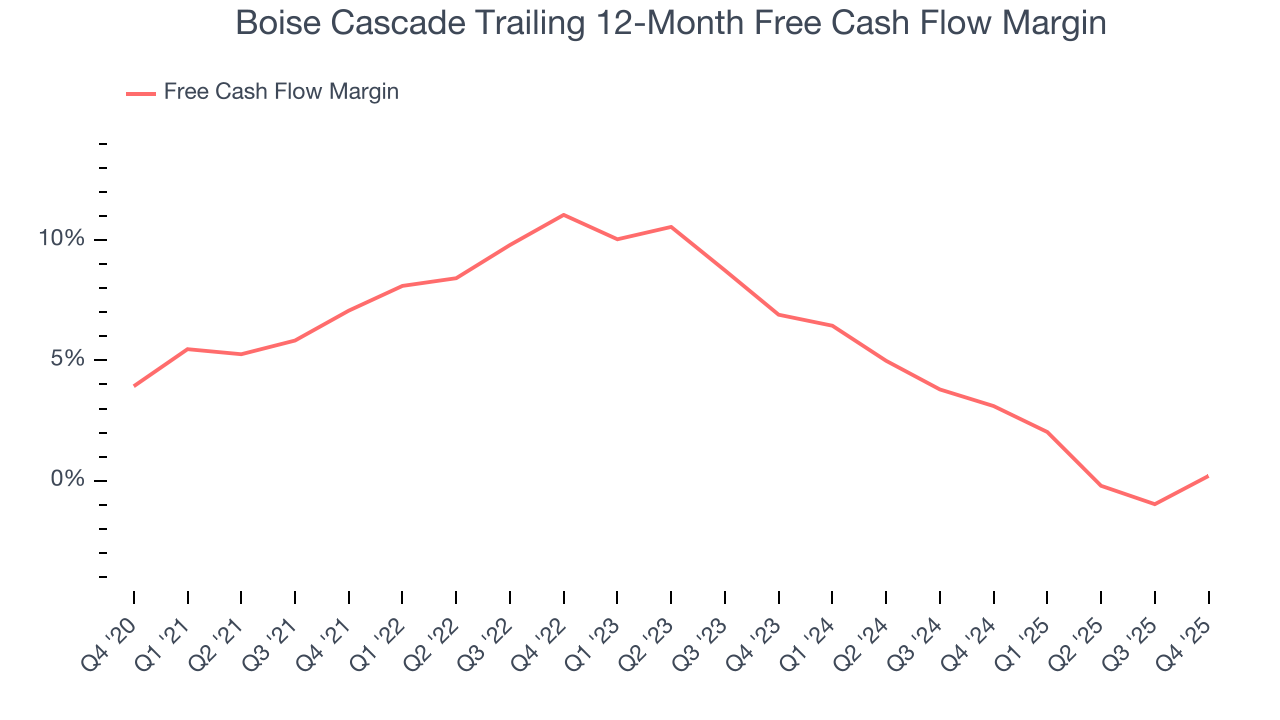
Boise Cascade’s free cash flow clocked in at $77.03 million in Q4, equivalent to a 5.3% margin. This result was good as its margin was 5.2 percentage points higher than in the same quarter last year, but we wouldn’t read too much into the short term because investment needs can be seasonal, leading to temporary swings. Long-term trends carry greater meaning.
10. Return on Invested Capital (ROIC)
EPS and free cash flow tell us whether a company was profitable while growing its revenue. But was it capital-efficient? Enter ROIC, a metric showing how much operating profit a company generates relative to the money it has raised (debt and equity).
Although Boise Cascade hasn’t been the highest-quality company lately because of its poor revenue and EPS performance, it found a few growth initiatives in the past that worked out wonderfully. Its five-year average ROIC was 38.4%, splendid for an industrials business.
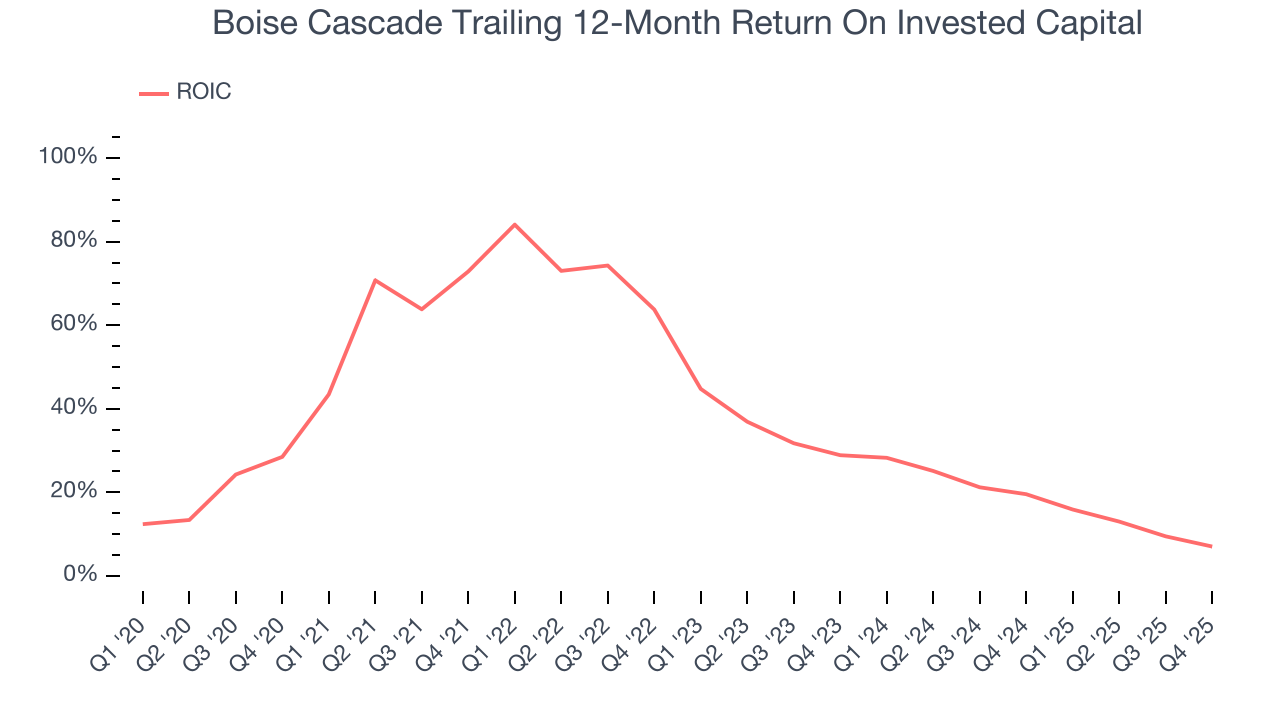
We like to invest in businesses with high returns, but the trend in a company’s ROIC is what often surprises the market and moves the stock price. Over the last few years, Boise Cascade’s ROIC has unfortunately decreased significantly. We like what management has done in the past, but its declining returns are perhaps a symptom of fewer profitable growth opportunities.
11. Balance Sheet Assessment
Boise Cascade reported $477.2 million of cash and $510.8 million of debt on its balance sheet in the most recent quarter. As investors in high-quality companies, we primarily focus on two things: 1) that a company’s debt level isn’t too high and 2) that its interest payments are not excessively burdening the business.
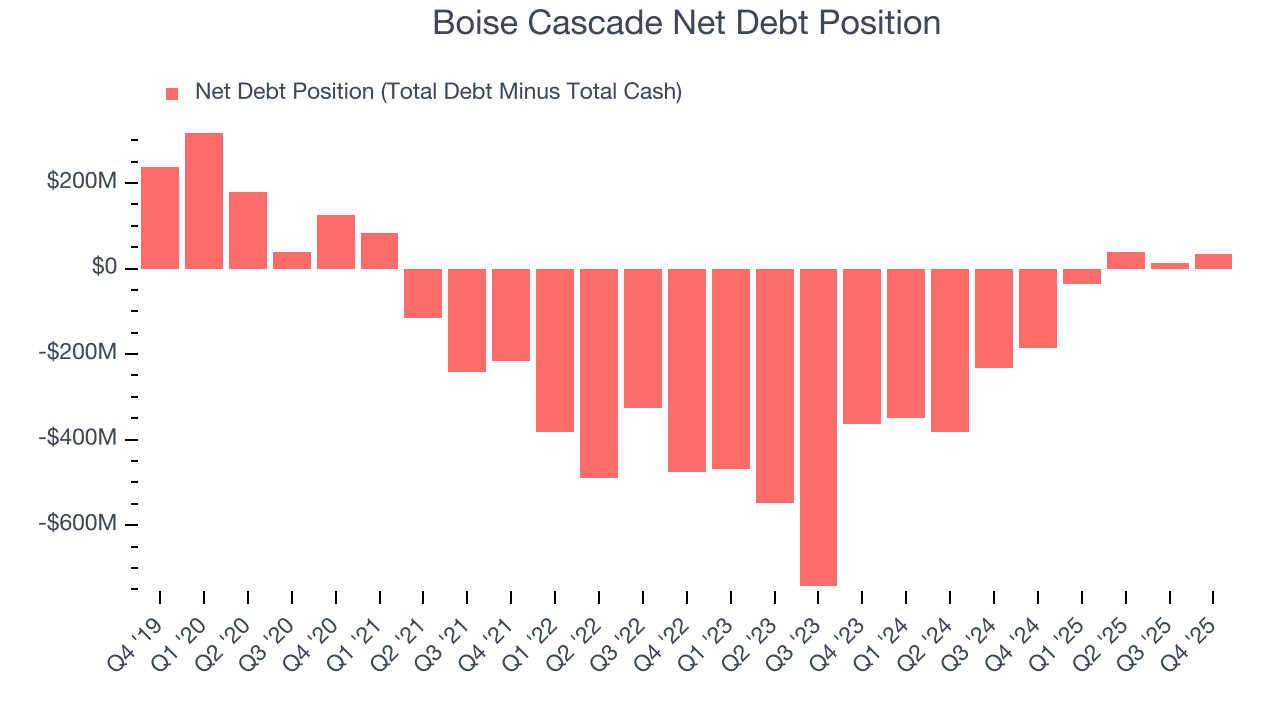
With $342.2 million of EBITDA over the last 12 months, we view Boise Cascade’s 0.1× net-debt-to-EBITDA ratio as safe. We also see its $861,000 of annual interest expenses as appropriate. The company’s profits give it plenty of breathing room, allowing it to continue investing in growth initiatives.
12. Key Takeaways from Boise Cascade’s Q4 Results
It was good to see Boise Cascade beat analysts’ EPS expectations this quarter. We were also excited its EBITDA outperformed Wall Street’s estimates by a wide margin. Zooming out, we think this was a good print with some key areas of upside. The stock remained flat at $81.25 immediately following the results.
13. Is Now The Time To Buy Boise Cascade?
Updated: March 15, 2026 at 11:34 PM EDT
We think that the latest earnings result is only one piece of the bigger puzzle. If you’re deciding whether to own Boise Cascade, you should also grasp the company’s longer-term business quality and valuation.
Boise Cascade falls short of our quality standards. First off, its revenue growth was weak over the last five years, and analysts don’t see anything changing over the next 12 months. While its stellar ROIC suggests it has been a well-run company historically, the downside is its diminishing returns show management's prior bets haven't worked out. On top of that, its declining EPS over the last five years makes it a less attractive asset to the public markets.
Boise Cascade’s P/E ratio based on the next 12 months is 18.6x. This valuation multiple is fair, but we don’t have much confidence in the company. There are superior stocks to buy right now.
Wall Street analysts have a consensus one-year price target of $96.50 on the company (compared to the current share price of $68.30).
Although the price target is bullish, readers should exercise caution because analysts tend to be overly optimistic. The firms they work for, often big banks, have relationships with companies that extend into fundraising, M&A advisory, and other rewarding business lines. As a result, they typically hesitate to say bad things for fear they will lose out. We at StockStory do not suffer from such conflicts of interest, so we’ll always tell it like it is.