
BrightView (BV)
BrightView is up against the odds. Its weak sales growth and low returns on capital show it struggled to generate demand and profits.― StockStory Analyst Team
1. News


2. Summary
Why We Think BrightView Will Underperform
An official field consultant for Major League Baseball, BrightView (NYSE:BV) offers landscaping design, development, and maintenance.
- Customers postponed purchases of its products and services this cycle as its revenue declined by 1.8% annually over the last two years
- Earnings per share have contracted by 3.3% annually over the last five years, a headwind for returns as stock prices often echo long-term EPS performance
- Low returns on capital reflect management’s struggle to allocate funds effectively


BrightView’s quality doesn’t meet our expectations. We’d search for superior opportunities elsewhere.
Why There Are Better Opportunities Than BrightView


At $11.82 per share, BrightView trades at 15.5x forward P/E. This multiple is cheaper than most industrials peers, but we think this is justified.
It’s better to pay up for high-quality businesses with higher long-term earnings potential rather than to buy lower-quality stocks because they appear cheap. These challenged businesses often don’t re-rate, a phenomenon known as a “value trap”.
3. BrightView (BV) Research Report: Q4 CY2025 Update
Landscaping service company BrightView (NYSE:BV) reported Q4 CY2025 results exceeding the market’s revenue expectations, with sales up 2.6% year on year to $614.7 million. The company expects the full year’s revenue to be around $2.7 billion, close to analysts’ estimates. Its non-GAAP loss of $0.01 per share was $0.02 below analysts’ consensus estimates.
BrightView (BV) Q4 CY2025 Highlights:
- Revenue: $614.7 million vs analyst estimates of $589.6 million (2.6% year-on-year growth, 4.2% beat)
- Adjusted EPS: -$0.01 vs analyst estimates of $0.01 ($0.02 miss)
- Adjusted EBITDA: $53.5 million vs analyst estimates of $55.39 million (8.7% margin, 3.4% miss)
- The company reconfirmed its revenue guidance for the full year of $2.7 billion at the midpoint
- EBITDA guidance for the full year is $370 million at the midpoint, in line with analyst expectations
- Operating Margin: -1.2%, down from -0.1% in the same quarter last year
- Free Cash Flow was -$18.6 million, down from $4.4 million in the same quarter last year
- Market Capitalization: $1.30 billion
Company Overview
An official field consultant for Major League Baseball, BrightView (NYSE:BV) offers landscaping design, development, and maintenance.
BrightView was established in 2014 through the merger of two U.S. landscaping companies: The Brickman Group and ValleyCrest. The Brickman Group, founded in 1939, was known for landscape maintenance while ValleyCrest, established in 1949, offered landscape design, development, and maintenance. Post-merger, the company made various acquisitions targeting smaller regional landscaping companies to grow its product portfolio.
Today, BrightView enhances the aesthetics and health of outdoor environments through landscaping services such as mowing, trimming, and fertilization. Collaborating with clients, it also creates landscape designs for commercial properties, residential communities, and public spaces. During winter months, the company focus shifts to snow and ice management services such as plowing, de-icing, and snow removal.
BrightView engages with customers through direct sales and contract-based arrangements typically spanning multiple years. It often enters into long-term contracts with commercial property owners, municipalities, and large-scale developers, to provide landscape maintenance services. These contracts typically include regular site visits, seasonal landscaping services, and irrigation system management.
4. Facility Services
Many facility services are non-discretionary (office building bathrooms need to be cleaned), recurring, and performed through contracts. This makes for more predictable and stickier revenue streams. However, COVID changed the game regarding commercial real estate, and office vacancies remain high as hybrid work seems here to stay. This is a headwind for demand, and facility services companies are also at the whim of economic cycles. Interest rates, for example, can greatly impact commercial construction projects that drive incremental demand for these companies’ services.
Competitors offering similar products include Scotts Miracle-Gro (NYSE:SMG), SiteOne (NYSE:SITE), and TruGreen (private).
5. Revenue Growth
A company’s long-term sales performance can indicate its overall quality. Any business can put up a good quarter or two, but the best consistently grow over the long haul. Over the last five years, BrightView grew its sales at a sluggish 2.9% compounded annual growth rate. This was below our standards and is a tough starting point for our analysis.
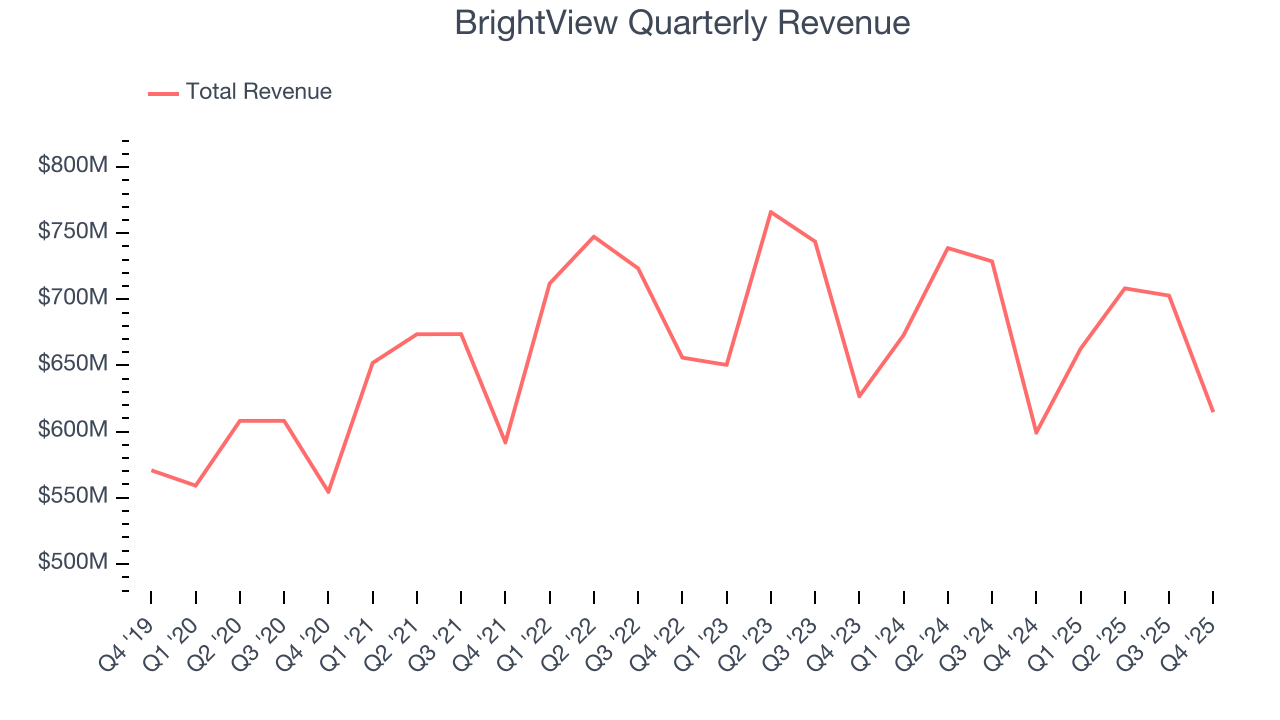
We at StockStory place the most emphasis on long-term growth, but within industrials, a half-decade historical view may miss cycles, industry trends, or a company capitalizing on catalysts such as a new contract win or a successful product line. BrightView’s performance shows it grew in the past but relinquished its gains over the last two years, as its revenue fell by 1.8% annually. 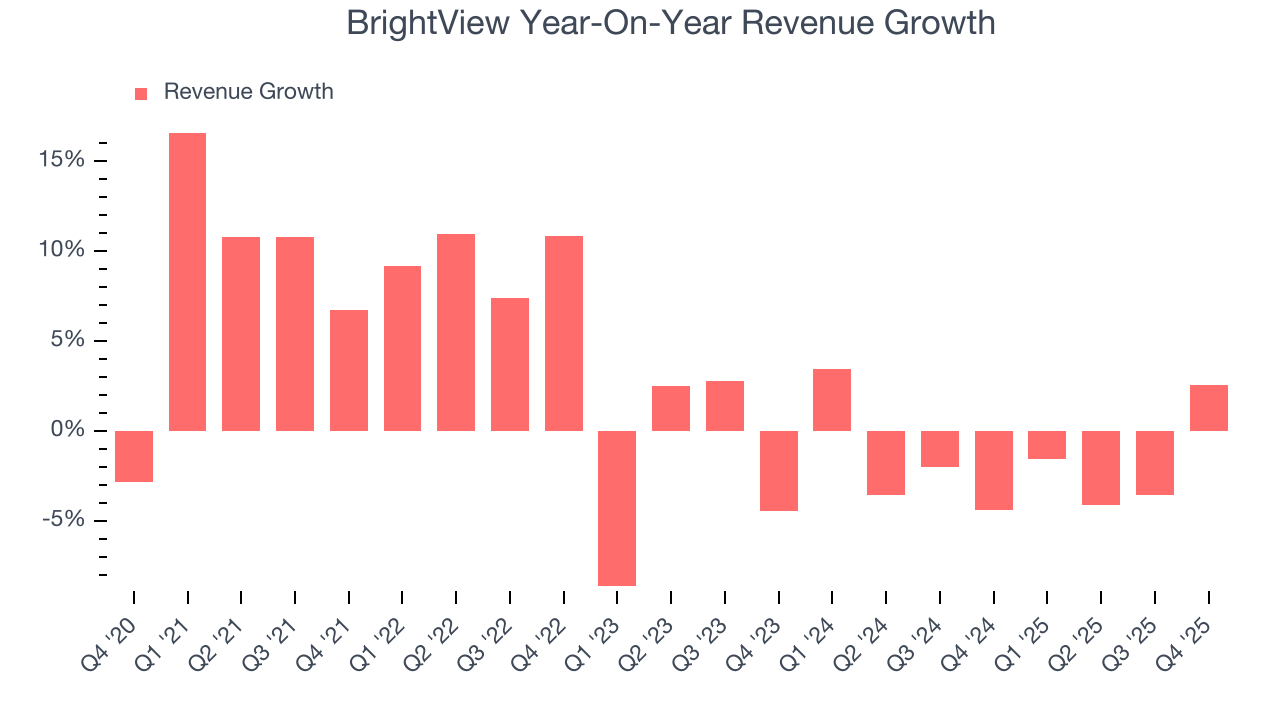
This quarter, BrightView reported modest year-on-year revenue growth of 2.6% but beat Wall Street’s estimates by 4.2%.
Looking ahead, sell-side analysts expect revenue to remain flat over the next 12 months. Although this projection indicates its newer products and services will spur better top-line performance, it is still below the sector average.
6. Gross Margin & Pricing Power
BrightView has bad unit economics for an industrials company, giving it less room to reinvest and develop new offerings. As you can see below, it averaged a 23.8% gross margin over the last five years. That means BrightView paid its suppliers a lot of money ($76.16 for every $100 in revenue) to run its business. 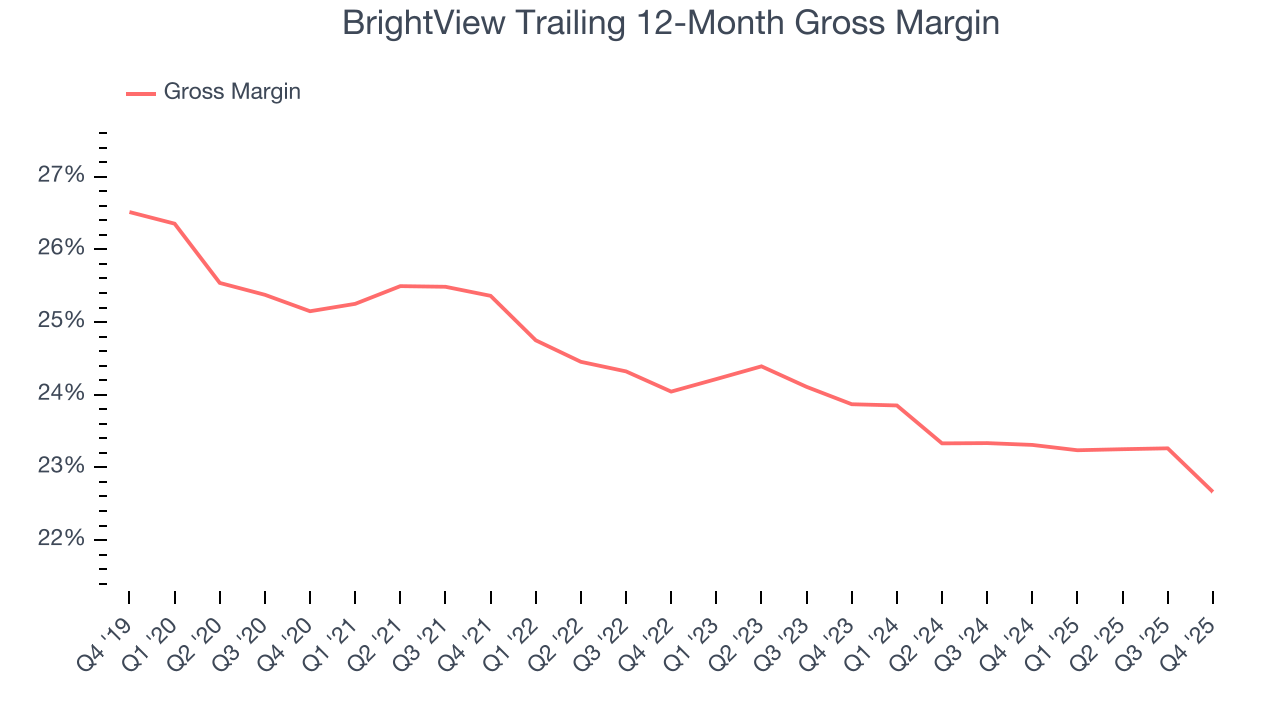
In Q4, BrightView produced a 18.6% gross profit margin, marking a 2.6 percentage point decrease from 21.2% in the same quarter last year. On a wider time horizon, the company’s full-year margin has remained steady over the past four quarters, suggesting its input costs (such as raw materials and manufacturing expenses) have been stable and it isn’t under pressure to lower prices.
7. Operating Margin
BrightView was profitable over the last five years but held back by its large cost base. Its average operating margin of 4.2% was weak for an industrials business. This result isn’t too surprising given its low gross margin as a starting point.
On the plus side, BrightView’s operating margin rose by 1.5 percentage points over the last five years, as its sales growth gave it operating leverage.
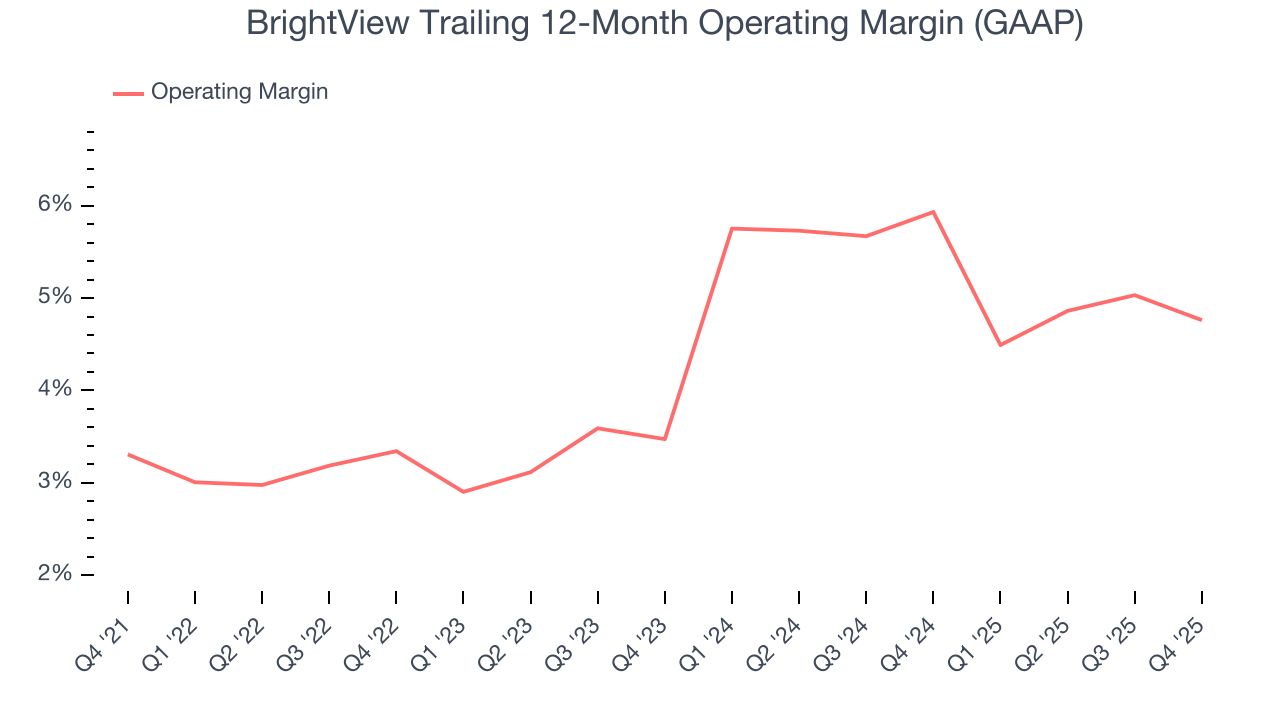
In Q4, BrightView generated an operating margin profit margin of negative 1.2%, down 1.1 percentage points year on year. Since BrightView’s gross margin decreased more than its operating margin, we can assume its recent inefficiencies were driven more by weaker leverage on its cost of sales rather than increased marketing, R&D, and administrative overhead expenses.
8. Earnings Per Share
Revenue trends explain a company’s historical growth, but the long-term change in earnings per share (EPS) points to the profitability of that growth – for example, a company could inflate its sales through excessive spending on advertising and promotions.
Sadly for BrightView, its EPS declined by 3.3% annually over the last five years while its revenue grew by 2.9%. We can see the difference stemmed from higher interest expenses or taxes as the company actually improved its operating margin and repurchased its shares during this time.
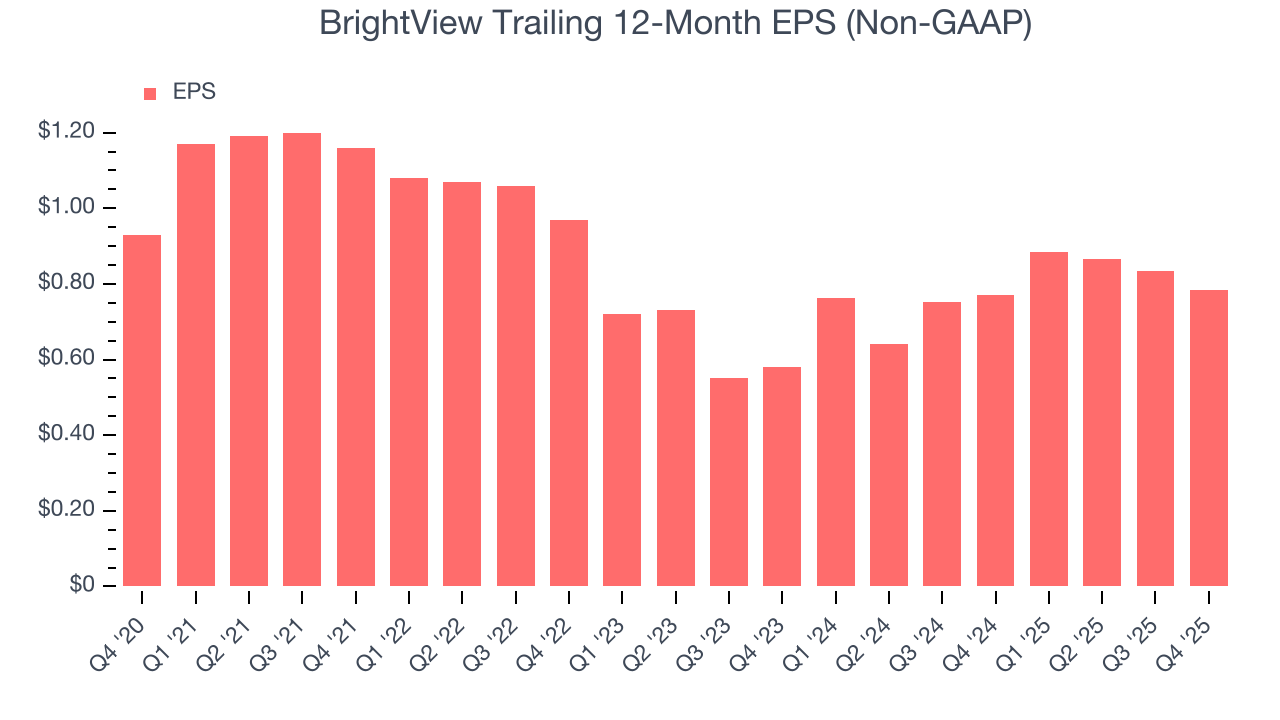
Like with revenue, we analyze EPS over a more recent period because it can provide insight into an emerging theme or development for the business.
For BrightView, its two-year annual EPS growth of 16.3% was higher than its five-year trend. This acceleration made it one of the faster-growing industrials companies in recent history.
In Q4, BrightView reported adjusted EPS of negative $0.01, down from $0.04 in the same quarter last year. This print missed analysts’ estimates. Over the next 12 months, Wall Street expects BrightView’s full-year EPS of $0.79 to shrink by 1.3%.
9. Cash Is King
If you’ve followed StockStory for a while, you know we emphasize free cash flow. Why, you ask? We believe that in the end, cash is king, and you can’t use accounting profits to pay the bills.
BrightView has shown poor cash profitability over the last five years, giving the company limited opportunities to return capital to shareholders. Its free cash flow margin averaged 2.8%, lousy for an industrials business.
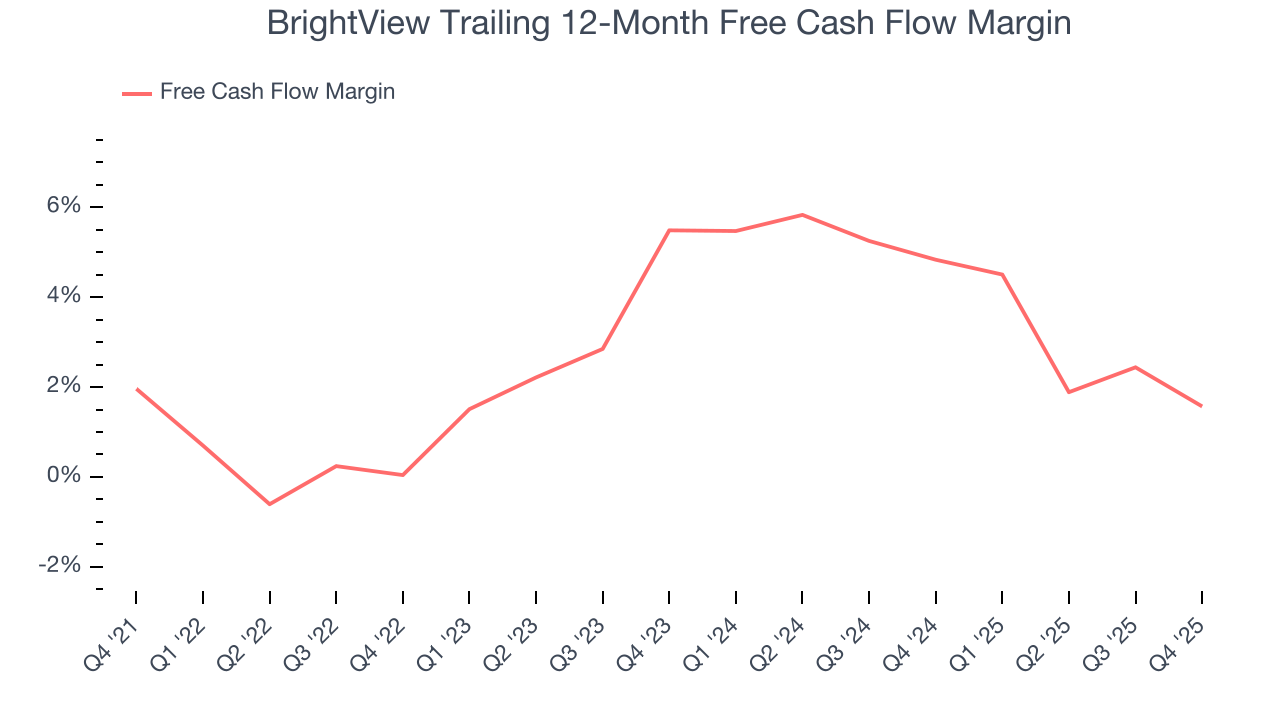
BrightView burned through $18.6 million of cash in Q4, equivalent to a negative 3% margin. The company’s cash burn increased meaningfully year on year and is a deviation from its longer-term margin, indicating it is a seasonal business that must build up inventory during certain quarters.
10. Return on Invested Capital (ROIC)
EPS and free cash flow tell us whether a company was profitable while growing its revenue. But was it capital-efficient? A company’s ROIC explains this by showing how much operating profit it makes compared to the money it has raised (debt and equity).
BrightView historically did a mediocre job investing in profitable growth initiatives. Its five-year average ROIC was 3%, lower than the typical cost of capital (how much it costs to raise money) for industrials companies.
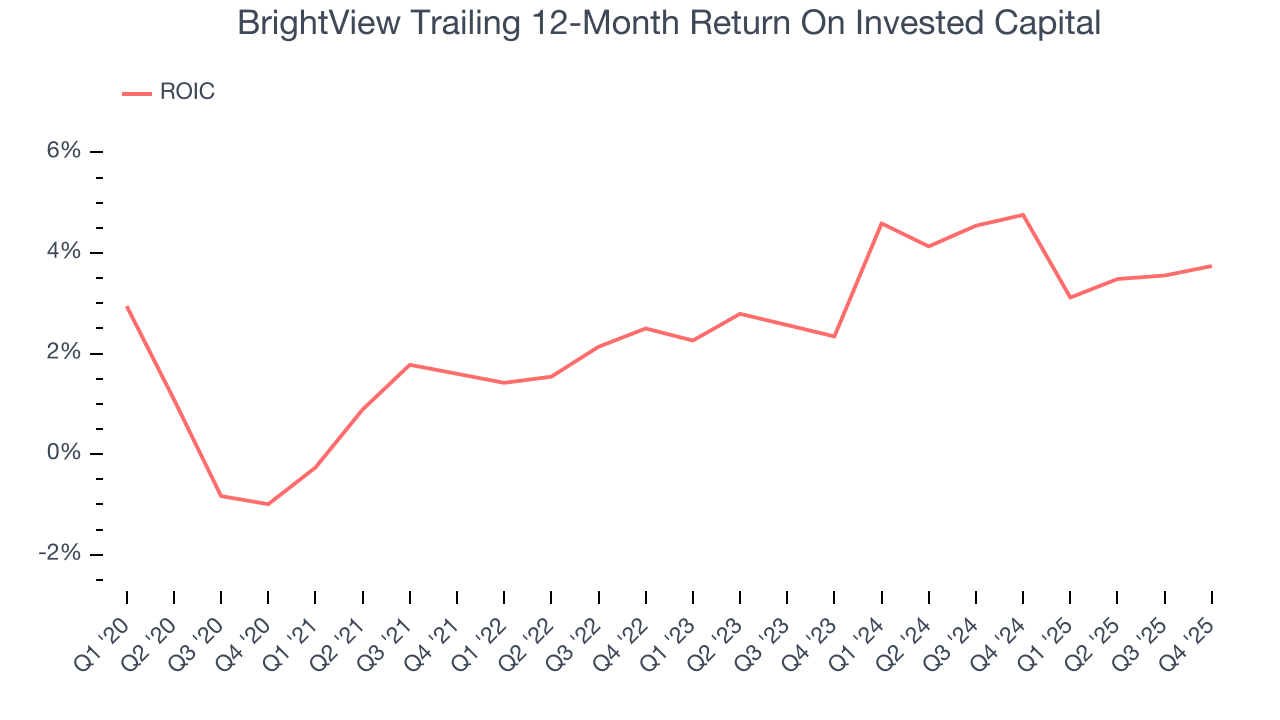
We like to invest in businesses with high returns, but the trend in a company’s ROIC is what often surprises the market and moves the stock price. Fortunately, BrightView’s ROIC averaged 2.2 percentage point increases over the last few years. This is a good sign, and we hope the company can continue improving.
11. Balance Sheet Assessment
BrightView reported $37 million of cash and $881.9 million of debt on its balance sheet in the most recent quarter. As investors in high-quality companies, we primarily focus on two things: 1) that a company’s debt level isn’t too high and 2) that its interest payments are not excessively burdening the business.
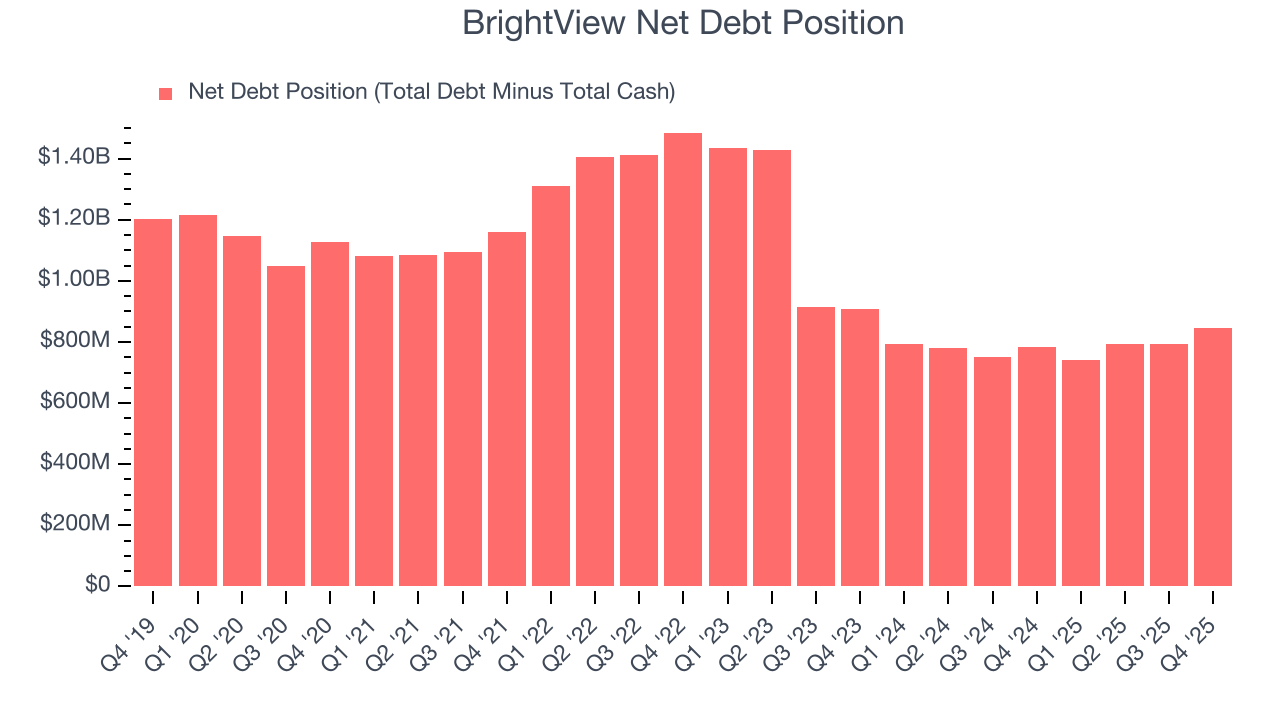
With $353.7 million of EBITDA over the last 12 months, we view BrightView’s 2.4× net-debt-to-EBITDA ratio as safe. We also see its $26 million of annual interest expenses as appropriate. The company’s profits give it plenty of breathing room, allowing it to continue investing in growth initiatives.
12. Key Takeaways from BrightView’s Q4 Results
We were impressed by how significantly BrightView blew past analysts’ revenue expectations this quarter. On the other hand, its EPS was in line and its EBITDA fell short of Wall Street’s estimates. Overall, this was a softer quarter. The stock traded down 1.5% to $13.45 immediately after reporting.
13. Is Now The Time To Buy BrightView?
Updated: March 15, 2026 at 11:58 PM EDT
Before deciding whether to buy BrightView or pass, we urge investors to consider business quality, valuation, and the latest quarterly results.
We cheer for all companies making their customers lives easier, but in the case of BrightView, we’ll be cheering from the sidelines. First off, its revenue growth was weak over the last five years, and analysts expect its demand to deteriorate over the next 12 months. While its expanding operating margin shows the business has become more efficient, the downside is its relatively low ROIC suggests management has struggled to find compelling investment opportunities. On top of that, its projected EPS for the next year is lacking.
BrightView’s P/E ratio based on the next 12 months is 15.5x. While this valuation is reasonable, we don’t see a big opportunity at the moment. There are better stocks to buy right now.
Wall Street analysts have a consensus one-year price target of $16.46 on the company (compared to the current share price of $11.82).
Although the price target is bullish, readers should exercise caution because analysts tend to be overly optimistic. The firms they work for, often big banks, have relationships with companies that extend into fundraising, M&A advisory, and other rewarding business lines. As a result, they typically hesitate to say bad things for fear they will lose out. We at StockStory do not suffer from such conflicts of interest, so we’ll always tell it like it is.