
Quest Resource (QRHC)
We wouldn’t buy Quest Resource. Its weak sales growth and low returns on capital show it struggled to generate demand and profits.― StockStory Analyst Team
1. News
2. Summary
Why We Think Quest Resource Will Underperform
Recycling corporate waste to help companies be more sustainable, Quest Resource (NASDAQ:QRHC) is a provider of waste and recycling services.
- Annual sales declines of 6.9% for the past two years show its products and services struggled to connect with the market during this cycle
- Earnings per share have dipped by 75.4% annually over the past five years, which is concerning because stock prices follow EPS over the long term
- 7× net-debt-to-EBITDA ratio shows it’s overleveraged and increases the probability of shareholder dilution if things turn unexpectedly


Quest Resource doesn’t pass our quality test. You should search for better opportunities.
Why There Are Better Opportunities Than Quest Resource


Quest Resource is trading at $1.13 per share, or 8.3x forward EV-to-EBITDA. Quest Resource’s valuation may seem like a bargain, especially when stacked up against other industrials companies. We remind you that you often get what you pay for, though.
Cheap stocks can look like great bargains at first glance, but you often get what you pay for. These mediocre businesses often have less earnings power, meaning there is more reliance on a re-rating to generate good returns - an unlikely scenario for low-quality companies.
3. Quest Resource (QRHC) Research Report: Q4 CY2025 Update
Waste and recycling services provider Quest Resource (NASDAQ:QRHC) fell short of the market’s revenue expectations in Q4 CY2025, with sales falling 15.8% year on year to $58.91 million. Its GAAP loss of $0.08 per share was in line with analysts’ consensus estimates.
Quest Resource (QRHC) Q4 CY2025 Highlights:
- Revenue: $58.91 million vs analyst estimates of $61.21 million (15.8% year-on-year decline, 3.8% miss)
- EPS (GAAP): -$0.08 vs analyst estimates of -$0.08 (in line)
- Adjusted EBITDA: $2.12 million vs analyst estimates of $2.74 million (3.6% margin, relatively in line)
- Operating Margin: 0.9%, up from -2.2% in the same quarter last year
- Market Capitalization: $32.97 million
Company Overview
Recycling corporate waste to help companies be more sustainable, Quest Resource (NASDAQ:QRHC) is a provider of waste and recycling services.
Founded in 2002, Quest Resource creates customer-specific programs for the collection, processing, recycling, disposal, and tracking of waste streams and recyclables. The company operates through two primary service offerings: Waste and Recycling Services and Data and Reporting.
In the Waste and Recycling Services segment, Quest Resource provides a single-source solution for the reuse, recycling, and disposal of waste streams and recyclables generated by its customers' operations. This includes services for cardboard, paper, metals, used motor oil, scrap tires, plastics, grease, cooking oil, food waste, glass, and various other materials.
Quest Resource serves a range of industries, including automotive, industrial/manufacturing, distribution and logistics, hospitality and retail, property management, and construction and demolition. Additionally, it has made a few notable acquisitions in recent years, including the purchase of Green Remedies Waste and Recycling in 2020 and RWS Facility Services in 2021. These acquisitions expanded Quest's range of environmental services and product lines, adding new capabilities in waste management, recycling, and facility services.
4. Waste Management
Waste management companies can possess licenses permitting them to handle hazardous materials. Furthermore, many services are performed through contracts and statutorily mandated, non-discretionary, or recurring, leading to more predictable revenue streams. However, regulation can be a headwind, rendering existing services obsolete or forcing companies to invest precious capital to comply with new, more environmentally-friendly rules. Lastly, waste management companies are at the whim of economic cycles. Interest rates, for example, can greatly impact industrial production or commercial projects that create waste and byproducts.
Competitors of Quest Resource include Waste Management (NYSE:WM), Republic Services (NYSE:RSG), and Waste Connections (NYSE:WCN).
5. Revenue Growth
Examining a company’s long-term performance can provide clues about its quality. Any business can experience short-term success, but top-performing ones enjoy sustained growth for years. Luckily, Quest Resource’s sales grew at an incredible 20.5% compounded annual growth rate over the last five years. Its growth beat the average industrials company and shows its offerings resonate with customers.
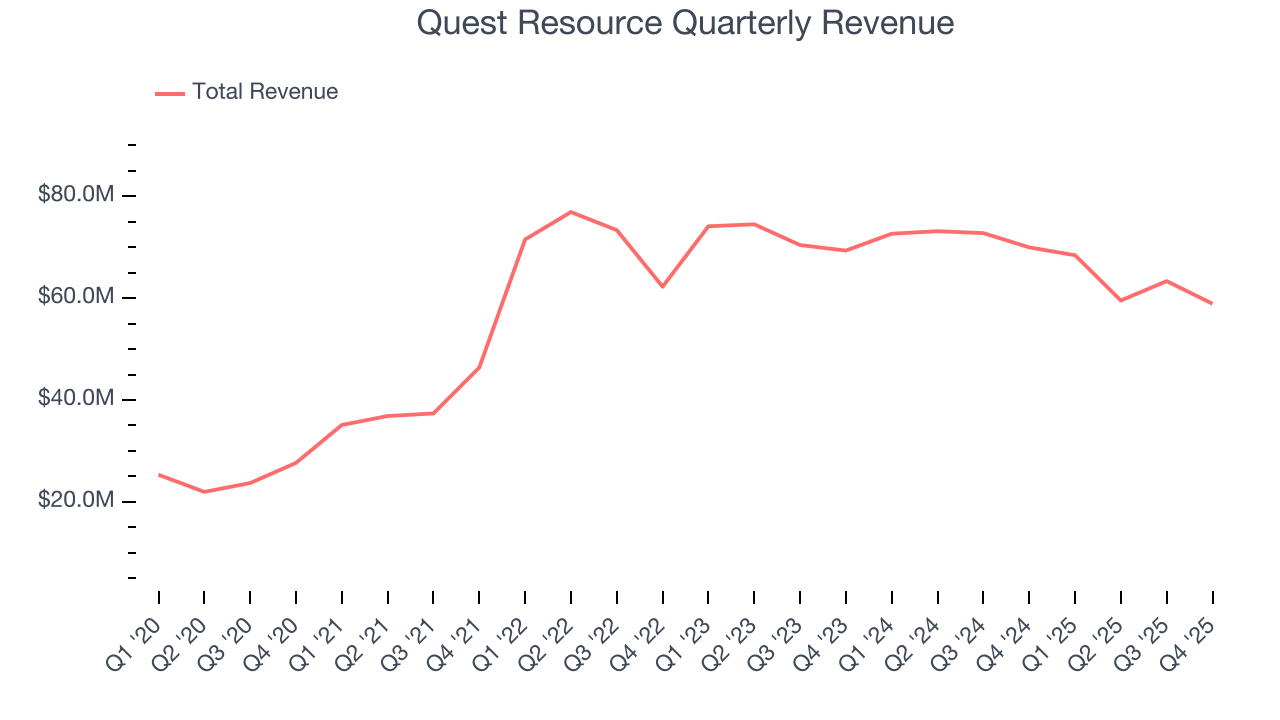
Long-term growth is the most important, but within industrials, a half-decade historical view may miss new industry trends or demand cycles. Quest Resource’s recent performance marks a sharp pivot from its five-year trend as its revenue has shown annualized declines of 6.9% over the last two years. 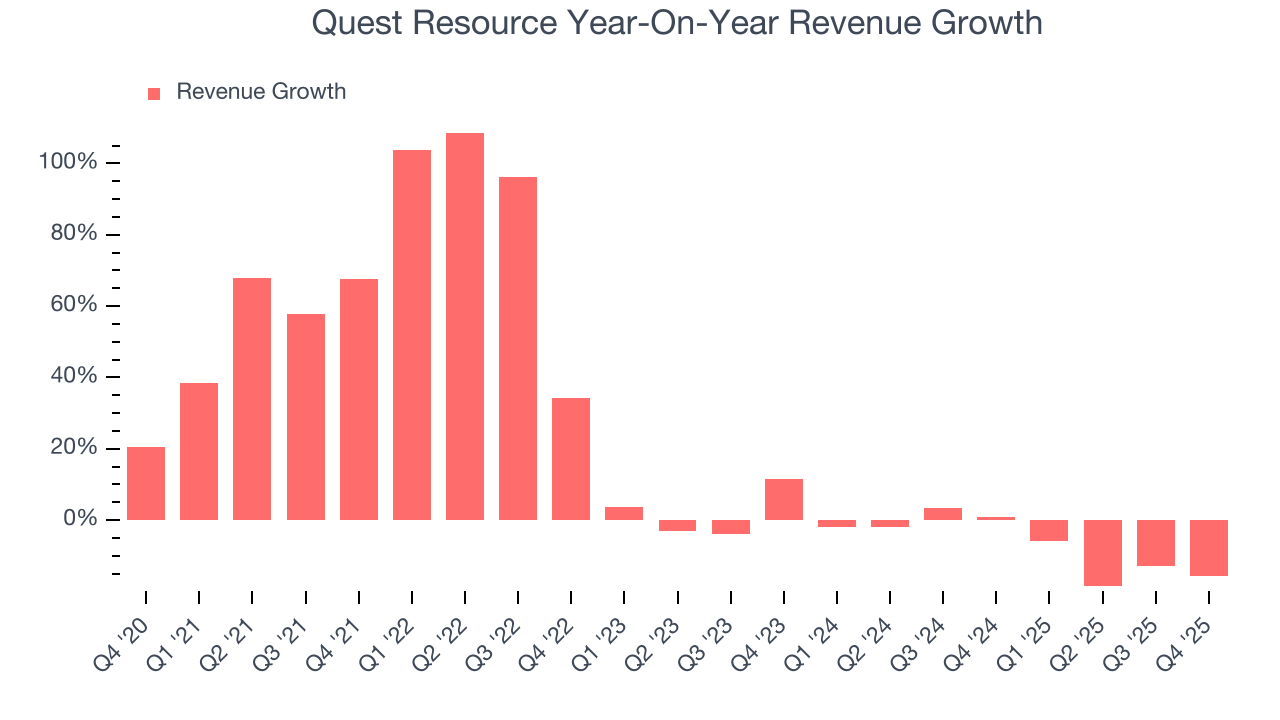
This quarter, Quest Resource missed Wall Street’s estimates and reported a rather uninspiring 15.8% year-on-year revenue decline, generating $58.91 million of revenue.
Looking ahead, sell-side analysts expect revenue to grow 3.2% over the next 12 months. While this projection indicates its newer products and services will catalyze better top-line performance, it is still below the sector average.
6. Gross Margin & Pricing Power
All else equal, we prefer higher gross margins because they usually indicate that a company sells more differentiated products and commands stronger pricing power.
Quest Resource has bad unit economics for an industrials business, signaling it operates in a competitive market. As you can see below, it averaged a 17.4% gross margin over the last five years. Said differently, Quest Resource had to pay a chunky $82.62 to its suppliers for every $100 in revenue. 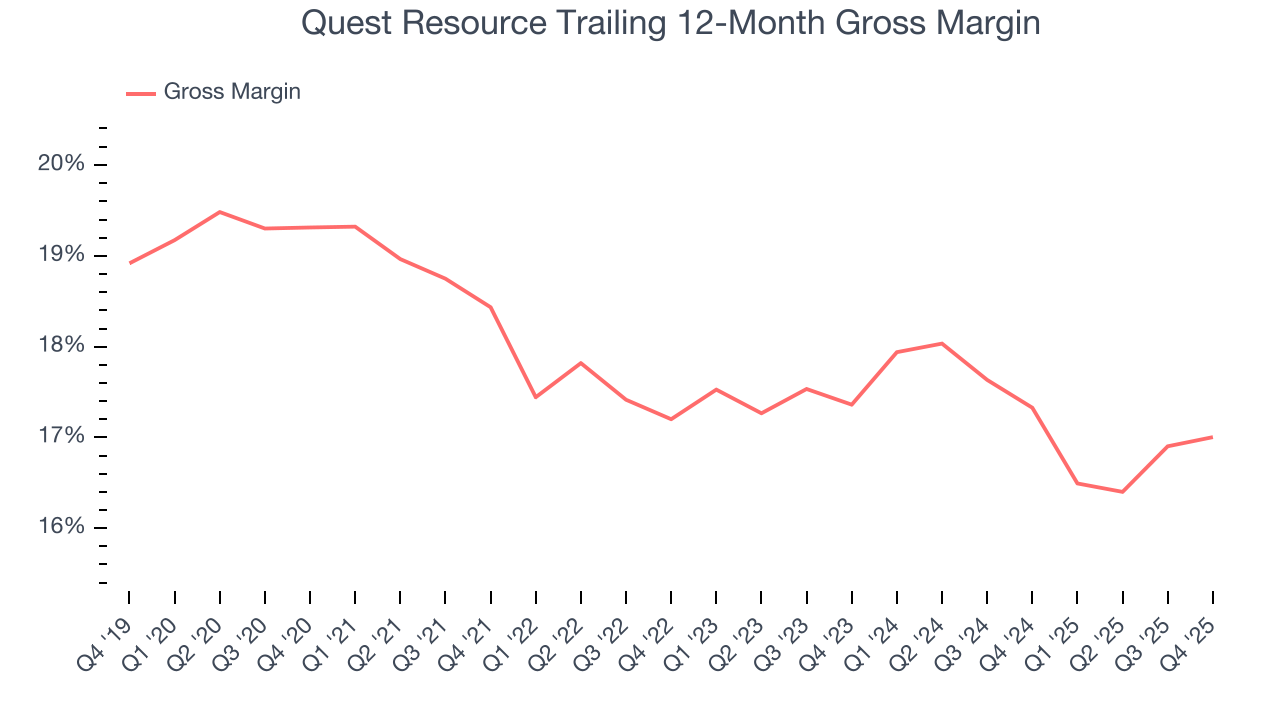
Quest Resource produced a 15.5% gross profit margin in Q4, in line with the same quarter last year. On a wider time horizon, the company’s full-year margin has remained steady over the past four quarters, suggesting its input costs (such as raw materials and manufacturing expenses) have been stable and it isn’t under pressure to lower prices.
7. Operating Margin
Operating margin is an important measure of profitability as it shows the portion of revenue left after accounting for all core expenses – everything from the cost of goods sold to advertising and wages. It’s also useful for comparing profitability across companies with different levels of debt and tax rates because it excludes interest and taxes.
Quest Resource was profitable over the last five years but held back by its large cost base. Its average operating margin of 1.2% was weak for an industrials business. This result isn’t too surprising given its low gross margin as a starting point.
Analyzing the trend in its profitability, Quest Resource’s operating margin decreased by 4.1 percentage points over the last five years. This raises questions about the company’s expense base because its revenue growth should have given it leverage on its fixed costs, resulting in better economies of scale and profitability. Quest Resource’s performance was poor no matter how you look at it - it shows that costs were rising and it couldn’t pass them onto its customers.
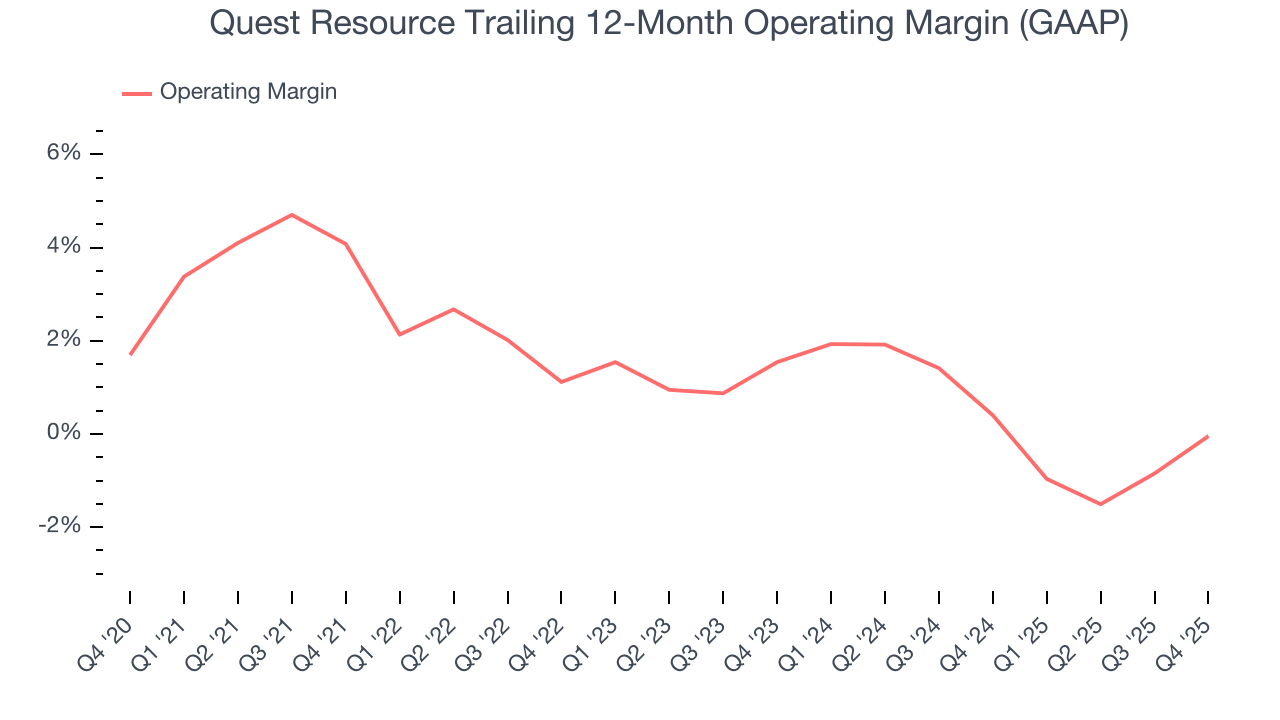
In Q4, Quest Resource’s breakeven margin was 0.9%, up 3.2 percentage points year on year. The increase was encouraging, and because its operating margin rose more than its gross margin, we can infer it was more efficient with expenses such as marketing, R&D, and administrative overhead.
8. Earnings Per Share
We track the long-term change in earnings per share (EPS) for the same reason as long-term revenue growth. Compared to revenue, however, EPS highlights whether a company’s growth is profitable.
Sadly for Quest Resource, its EPS declined by 75.4% annually over the last five years while its revenue grew by 20.5%. This tells us the company became less profitable on a per-share basis as it expanded.
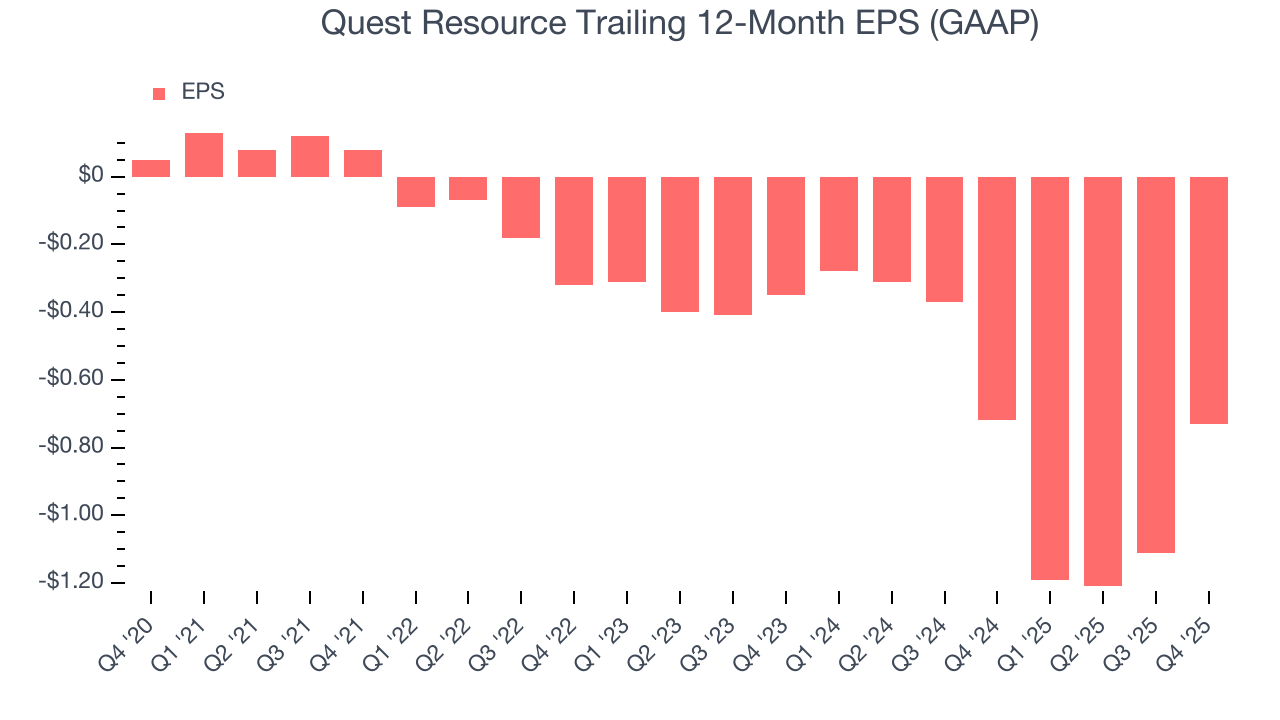
We can take a deeper look into Quest Resource’s earnings to better understand the drivers of its performance. As we mentioned earlier, Quest Resource’s operating margin expanded this quarter but declined by 4.1 percentage points over the last five years. Its share count also grew by 12.3%, meaning the company not only became less efficient with its operating expenses but also diluted its shareholders. 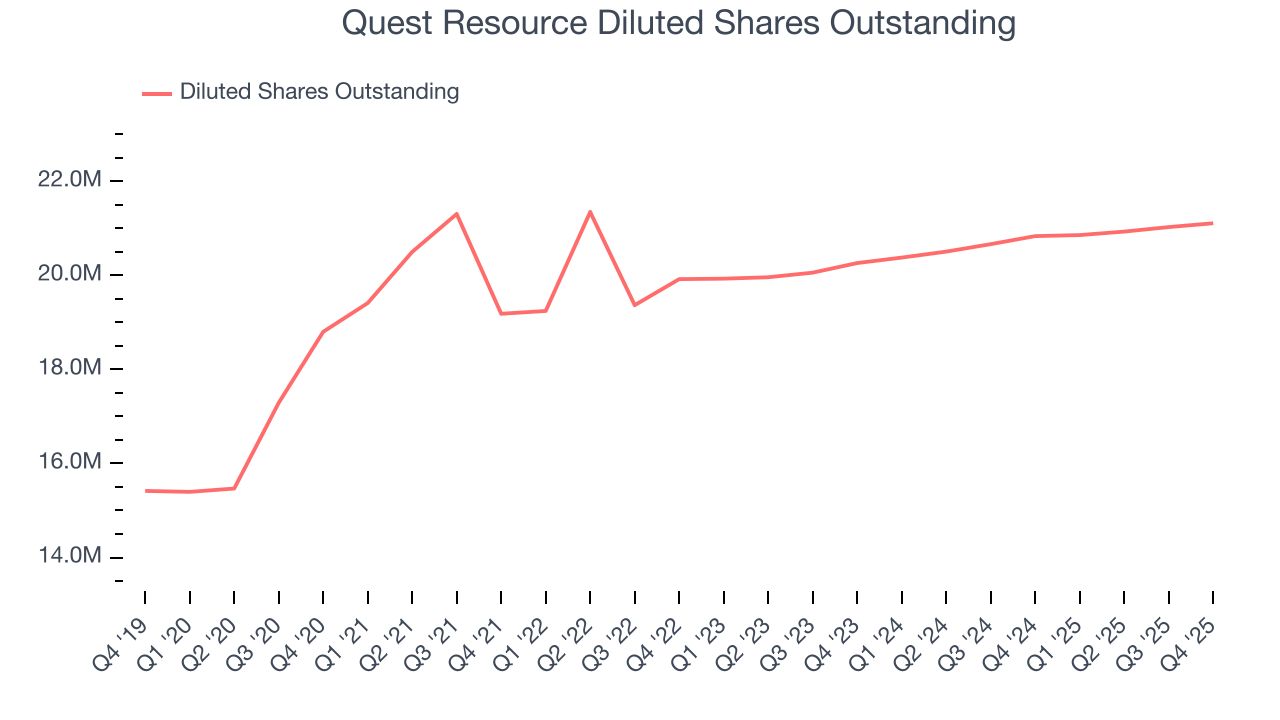
Like with revenue, we analyze EPS over a shorter period to see if we are missing a change in the business.
For Quest Resource, its two-year annual EPS declines of 44.4% show it’s still underperforming. These results were bad no matter how you slice the data.
In Q4, Quest Resource reported EPS of negative $0.08, up from negative $0.46 in the same quarter last year. Despite growing year on year, this print missed analysts’ estimates. Over the next 12 months, Wall Street expects Quest Resource to improve its earnings losses. Analysts forecast its full-year EPS of negative $0.73 will advance to negative $0.24.
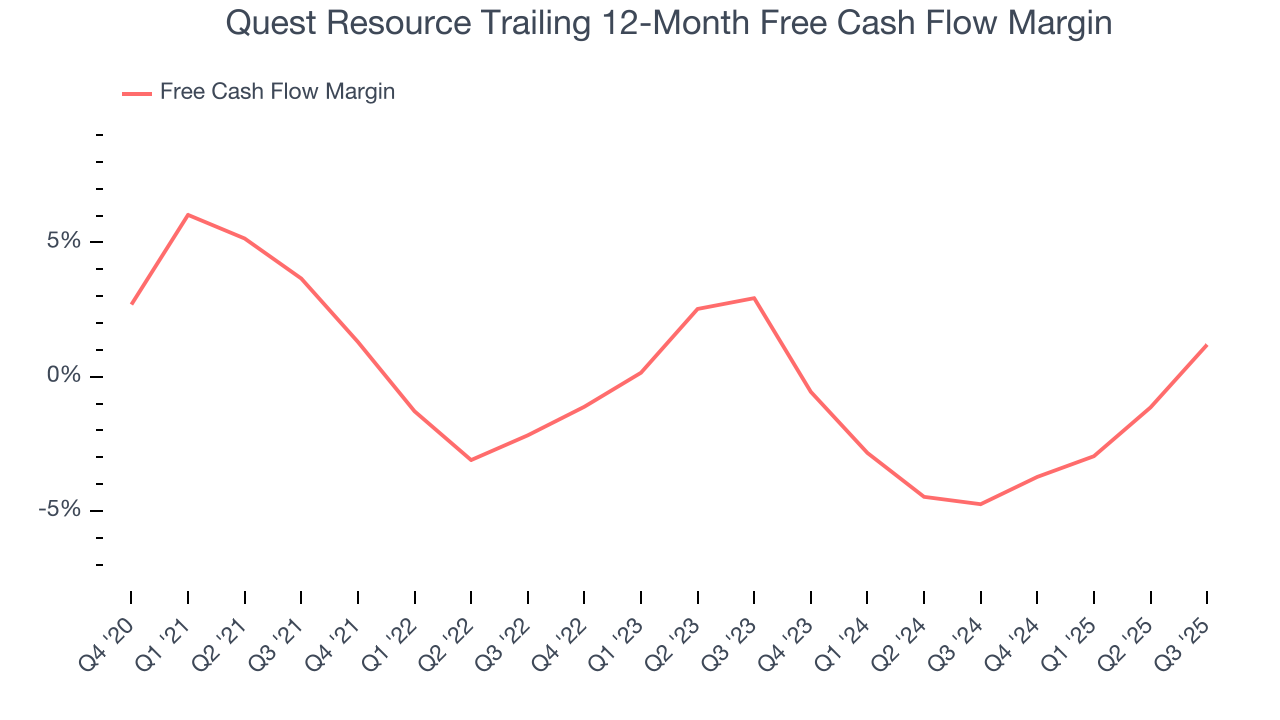
9. Cash Is King
If you’ve followed StockStory for a while, you know we emphasize free cash flow. Why, you ask? We believe that in the end, cash is king, and you can’t use accounting profits to pay the bills.
Quest Resource broke even from a free cash flow perspective over the last five years, giving the company limited opportunities to return capital to shareholders.
Taking a step back, an encouraging sign is that Quest Resource’s margin expanded by 1.7 percentage points during that time. The company’s improvement shows it’s heading in the right direction, and we can see it became a less capital-intensive business because its free cash flow profitability rose while its operating profitability fell.
10. Return on Invested Capital (ROIC)
EPS and free cash flow tell us whether a company was profitable while growing its revenue. But was it capital-efficient? A company’s ROIC explains this by showing how much operating profit it makes compared to the money it has raised (debt and equity).
Quest Resource historically did a mediocre job investing in profitable growth initiatives. Its five-year average ROIC was 2.5%, lower than the typical cost of capital (how much it costs to raise money) for industrials companies.
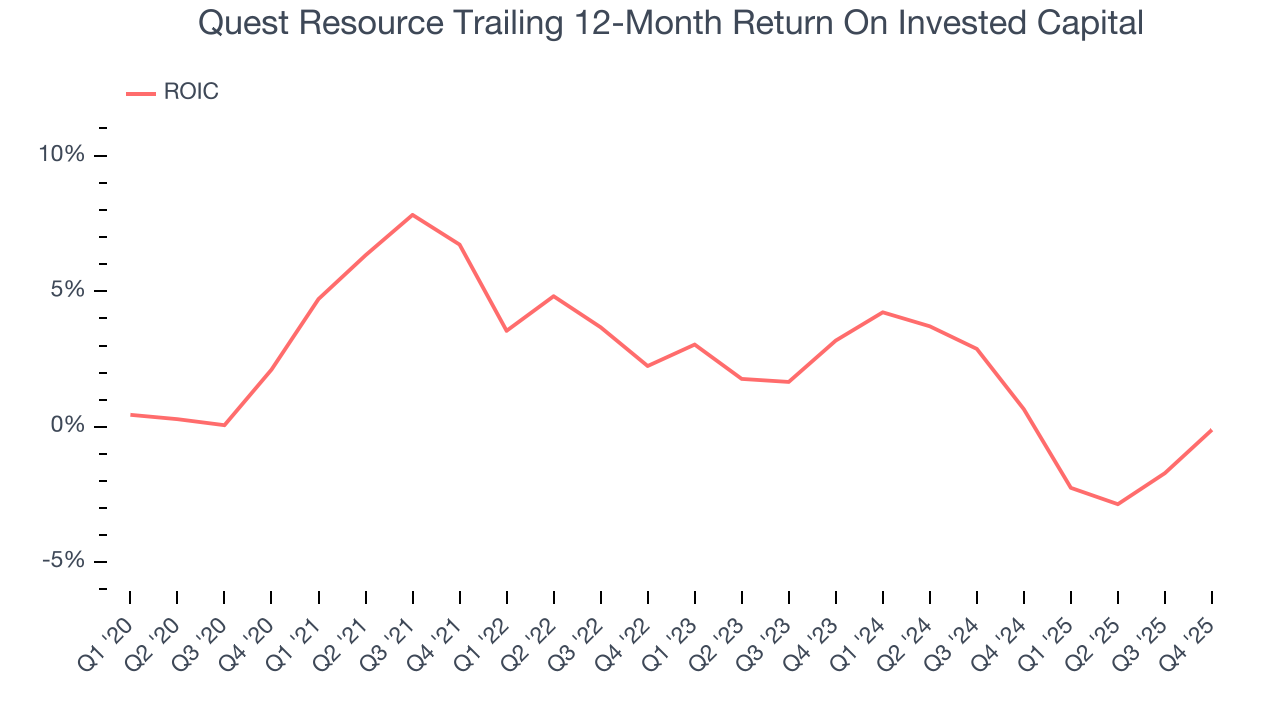
We like to invest in businesses with high returns, but the trend in a company’s ROIC is what often surprises the market and moves the stock price. On average, Quest Resource’s ROIC decreased by 4.2 percentage points annually each year over the last few years. Paired with its already low returns, these declines suggest its profitable growth opportunities are few and far between.
11. Balance Sheet Risk
As long-term investors, the risk we care about most is the permanent loss of capital, which can happen when a company goes bankrupt or raises money from a disadvantaged position. This is separate from short-term stock price volatility, something we are much less bothered by.
Quest Resource’s $65.01 million of debt exceeds the $1.01 million of cash on its balance sheet. Furthermore, its 7× net-debt-to-EBITDA ratio (based on its EBITDA of $9.30 million over the last 12 months) shows the company is overleveraged.
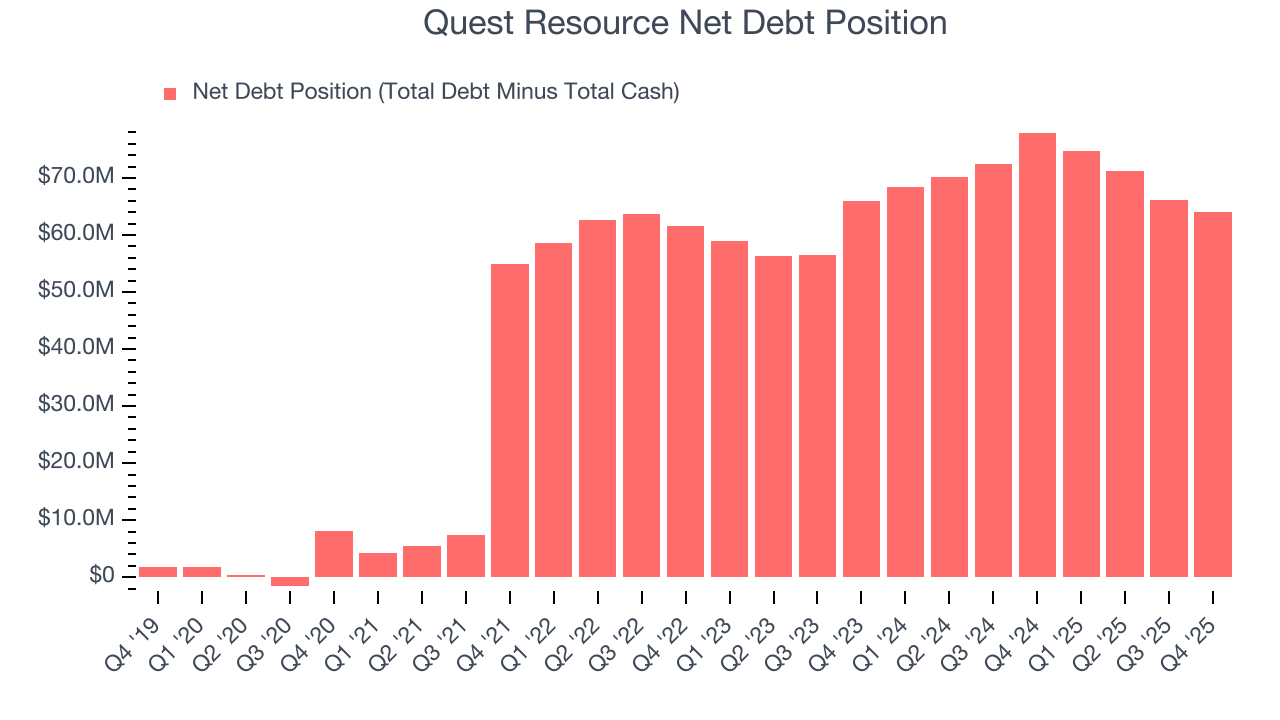
At this level of debt, incremental borrowing becomes increasingly expensive and credit agencies could downgrade the company’s rating if profitability falls. Quest Resource could also be backed into a corner if the market turns unexpectedly – a situation we seek to avoid as investors in high-quality companies.
We hope Quest Resource can improve its balance sheet and remain cautious until it increases its profitability or pays down its debt.
12. Key Takeaways from Quest Resource’s Q4 Results
We struggled to find many positives in these results. Its revenue missed and its EBITDA fell short of Wall Street’s estimates. Overall, this was a weaker quarter. The stock traded down 1% to $1.45 immediately following the results.
13. Is Now The Time To Buy Quest Resource?
Updated: March 13, 2026 at 11:16 PM EDT
A common mistake we notice when investors are deciding whether to buy a stock or not is that they simply look at the latest earnings results. Business quality and valuation matter more, so we urge you to understand these dynamics as well.
We see the value of companies helping their customers, but in the case of Quest Resource, we’re out. Although its revenue growth was exceptional over the last five years, it’s expected to deteriorate over the next 12 months and its relatively low ROIC suggests management has struggled to find compelling investment opportunities. And while the company’s projected EPS for the next year implies the company’s fundamentals will improve, the downside is its declining EPS over the last five years makes it a less attractive asset to the public markets.
Quest Resource’s EV-to-EBITDA ratio based on the next 12 months is 8.3x. This valuation tells us a lot of optimism is priced in - you can find more timely opportunities elsewhere.
Wall Street analysts have a consensus one-year price target of $2.92 on the company (compared to the current share price of $1.13).
Although the price target is bullish, readers should exercise caution because analysts tend to be overly optimistic. The firms they work for, often big banks, have relationships with companies that extend into fundraising, M&A advisory, and other rewarding business lines. As a result, they typically hesitate to say bad things for fear they will lose out. We at StockStory do not suffer from such conflicts of interest, so we’ll always tell it like it is.