Clean Harbors (CLH)
We aren’t fans of Clean Harbors. Its decelerating revenue growth and even worse EPS performance give us little confidence it can beat the market.― StockStory Analyst Team
1. News
2. Summary
Why Clean Harbors Is Not Exciting
Established in 1980, Clean Harbors (NYSE:CLH) provides environmental and industrial services like hazardous and non-hazardous waste disposal and emergency spill cleanups.
- Estimated sales growth of 3.4% for the next 12 months implies demand will slow from its two-year trend
- A silver lining is that its earnings per share grew by 26% annually over the last five years, outpacing its peers


Clean Harbors’s quality doesn’t meet our bar. We see more favorable opportunities in the market.
Why There Are Better Opportunities Than Clean Harbors


Clean Harbors is trading at $288.94 per share, or 35.1x forward P/E. This multiple is higher than most industrials companies, and we think it’s quite expensive for the quality you get.
We prefer to invest in similarly-priced but higher-quality companies with superior earnings growth.
3. Clean Harbors (CLH) Research Report: Q4 CY2025 Update
Environmental and industrial services company Clean Harbors (NYSE:CLH) reported Q4 CY2025 results exceeding the market’s revenue expectations, with sales up 4.8% year on year to $1.5 billion. Its GAAP profit of $1.62 per share was 0.9% above analysts’ consensus estimates.
Clean Harbors (CLH) Q4 CY2025 Highlights:
- Revenue: $1.5 billion vs analyst estimates of $1.46 billion (4.8% year-on-year growth, 2.5% beat)
- EPS (GAAP): $1.62 vs analyst estimates of $1.61 (0.9% beat)
- Adjusted EBITDA: $278.7 million vs analyst estimates of $274 million (18.6% margin, 1.7% beat)
- EBITDA guidance for the upcoming financial year 2026 is $1.23 billion at the midpoint, in line with analyst expectations
- Operating Margin: 10.6%, in line with the same quarter last year
- Free Cash Flow Margin: 15.6%, down from 17.3% in the same quarter last year
- Market Capitalization: $14.38 billion
Company Overview
Established in 1980, Clean Harbors (NYSE:CLH) provides environmental and industrial services like hazardous and non-hazardous waste disposal and emergency spill cleanups.
Clean Harbors initially focused on the clean-up of environmental spills and contamination, primarily in the northeastern United States. Over the decades, Clean Harbors expanded significantly through numerous acquisitions, becoming one of North America’s largest hazardous waste disposal companies. The acquisition of Safety-Kleen for $1.25 billion in 2012 marked a significant expansion into recycling and re-refining oil.
Today, Clean Harbors provides a suite of environmental and industrial services. Its offerings span the entire lifecycle of waste management, from collection and transport to treatment and disposal. This includes managing hazardous and non-hazardous waste through a network of disposal facilities, such as incinerators and landfills, ensuring compliance with environmental regulations and reducing ecological footprints. In addition to traditional waste services, Clean Harbors offers recycling and reusing materials services, particularly through their Safety-Kleen Sustainability Solutions (SKSS) business. This division focuses on the recovery and re-refining of used oil, transforming it into lubricants and other products.
Recurring revenue is a key component of Clean Harbors' financial model. Many customers have recurring needs due to continuous waste generation, regulatory compliance requirements, and environmental policies. This leads to stable, long-term service contracts, particularly in the SKSS segment where the collection of used oil provides a steady feedstock for its oil re-refining and recycling operations, thus further supporting the recurring revenue model.
Central to Clean Harbor’s business is an acquisition strategy centered on enhancing and expanding its portfolio through strategic purchases. These acquisitions range from small-scale "tuck-ins" to larger operations, chosen for its potential to enhance service offerings, increase market share, and extend the company's reach in existing and new markets.
4. Waste Management
Waste management companies can possess licenses permitting them to handle hazardous materials. Furthermore, many services are performed through contracts and statutorily mandated, non-discretionary, or recurring, leading to more predictable revenue streams. However, regulation can be a headwind, rendering existing services obsolete or forcing companies to invest precious capital to comply with new, more environmentally-friendly rules. Lastly, waste management companies are at the whim of economic cycles. Interest rates, for example, can greatly impact industrial production or commercial projects that create waste and byproducts.
Top competitors against Clean Harbors in the environmental services industry include Waste Management (NYSE:WM), Republic Services (NYSE:RSG), and Velia Environnement (EPA:VIE).
5. Revenue Growth
A company’s long-term sales performance is one signal of its overall quality. Any business can experience short-term success, but top-performing ones enjoy sustained growth for years. Luckily, Clean Harbors’s sales grew at an exceptional 13.9% compounded annual growth rate over the last five years. Its growth beat the average industrials company and shows its offerings resonate with customers.
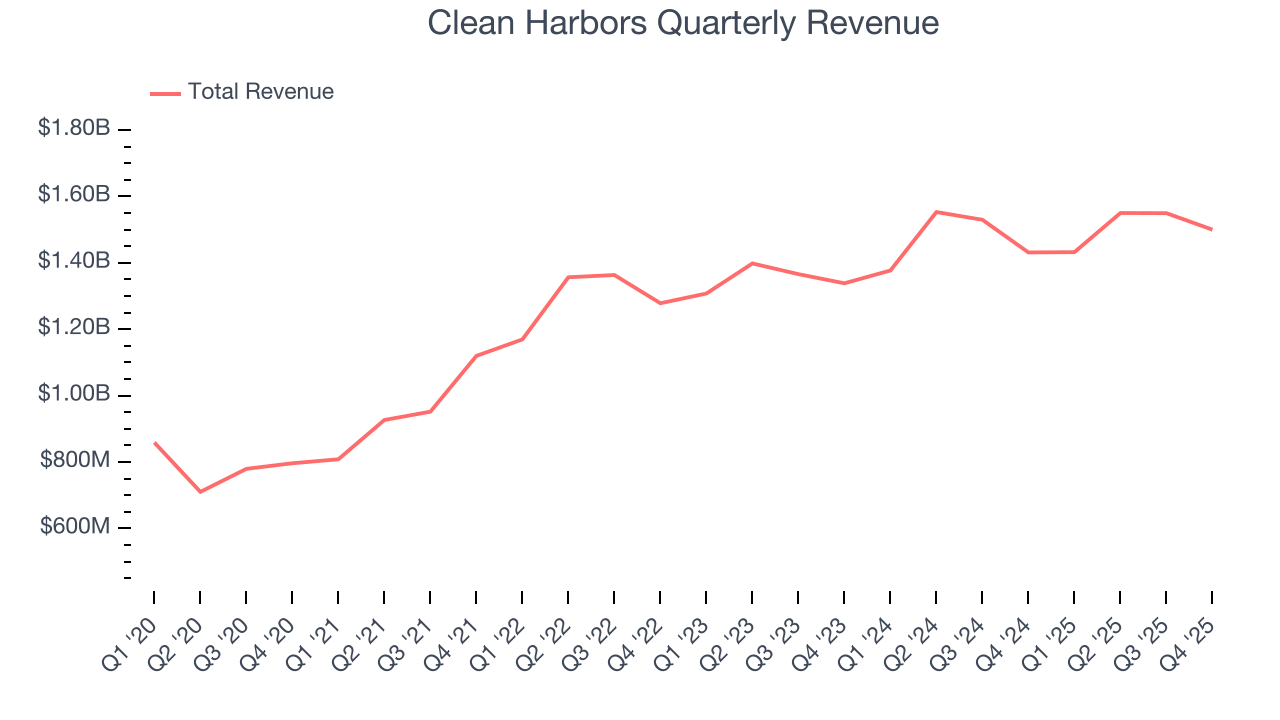
We at StockStory place the most emphasis on long-term growth, but within industrials, a half-decade historical view may miss cycles, industry trends, or a company capitalizing on catalysts such as a new contract win or a successful product line. Clean Harbors’s recent performance shows its demand has slowed significantly as its annualized revenue growth of 5.6% over the last two years was well below its five-year trend. 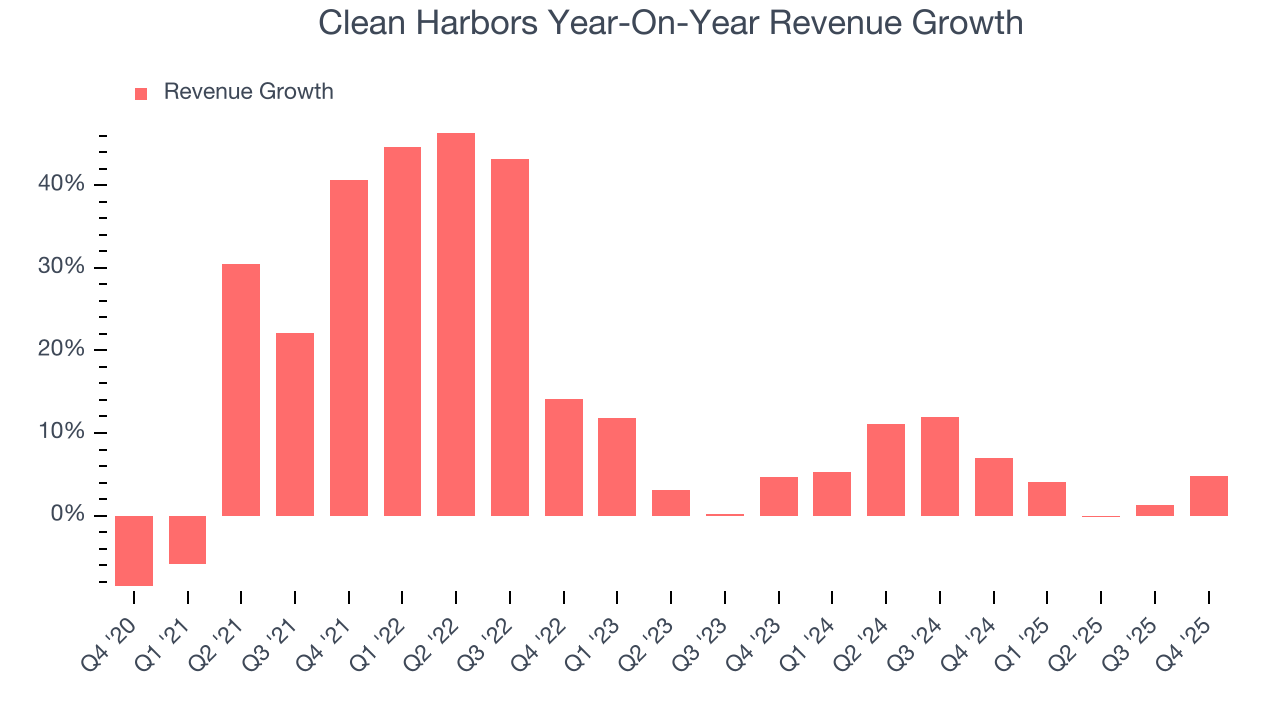
This quarter, Clean Harbors reported modest year-on-year revenue growth of 4.8% but beat Wall Street’s estimates by 2.5%.
Looking ahead, sell-side analysts expect revenue to grow 3.2% over the next 12 months, a slight deceleration versus the last two years. This projection is underwhelming and suggests its products and services will see some demand headwinds.
6. Gross Margin & Pricing Power
Clean Harbors’s unit economics are better than the typical industrials business, signaling its products are somewhat differentiated through quality or brand.As you can see below, it averaged a decent 31.1% gross margin over the last five years. Said differently, Clean Harbors paid its suppliers $68.85 for every $100 in revenue. 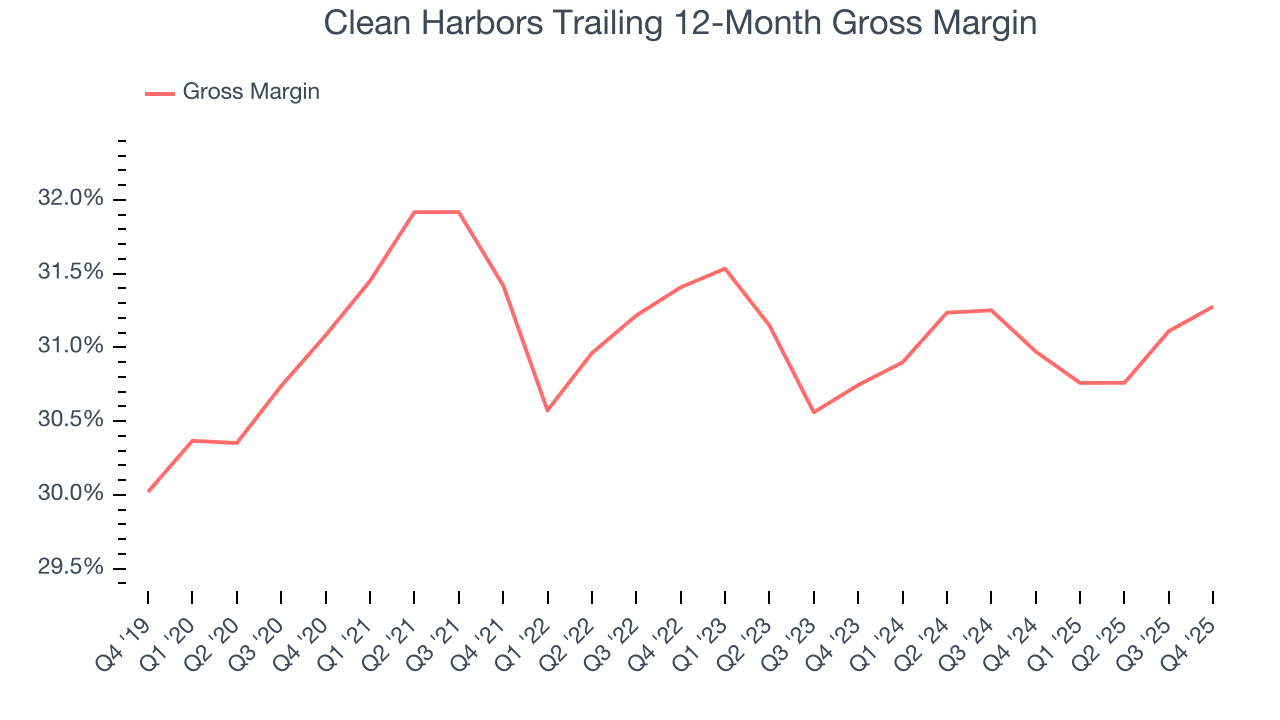
Clean Harbors’s gross profit margin came in at 30.6% this quarter, in line with the same quarter last year. On a wider time horizon, the company’s full-year margin has remained steady over the past four quarters, suggesting its input costs (such as raw materials and manufacturing expenses) have been stable and it isn’t under pressure to lower prices.
7. Operating Margin
Operating margin is a key measure of profitability. Think of it as net income - the bottom line - excluding the impact of taxes and interest on debt, which are less connected to business fundamentals.
Clean Harbors has managed its cost base well over the last five years. It demonstrated solid profitability for an industrials business, producing an average operating margin of 11.2%.
Analyzing the trend in its profitability, Clean Harbors’s operating margin rose by 2 percentage points over the last five years, as its sales growth gave it operating leverage.
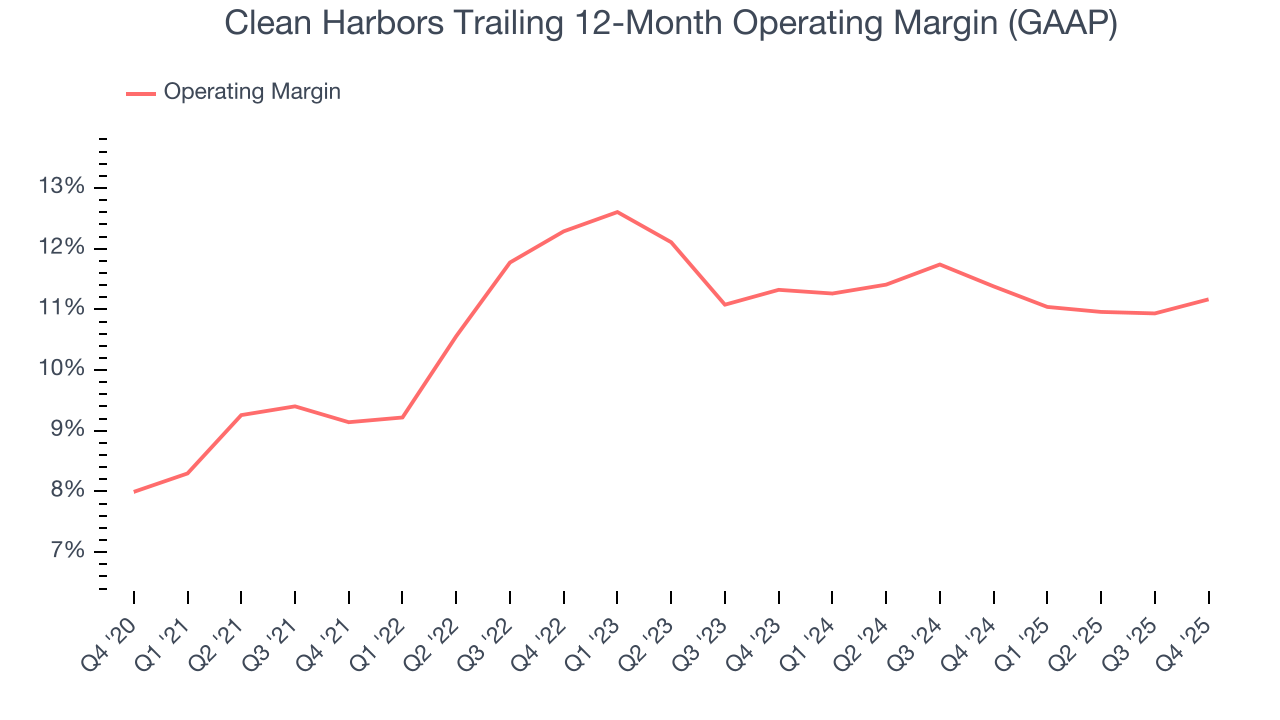
This quarter, Clean Harbors generated an operating margin profit margin of 10.6%, in line with the same quarter last year. This indicates the company’s cost structure has recently been stable.
8. Earnings Per Share
We track the long-term change in earnings per share (EPS) for the same reason as long-term revenue growth. Compared to revenue, however, EPS highlights whether a company’s growth is profitable.
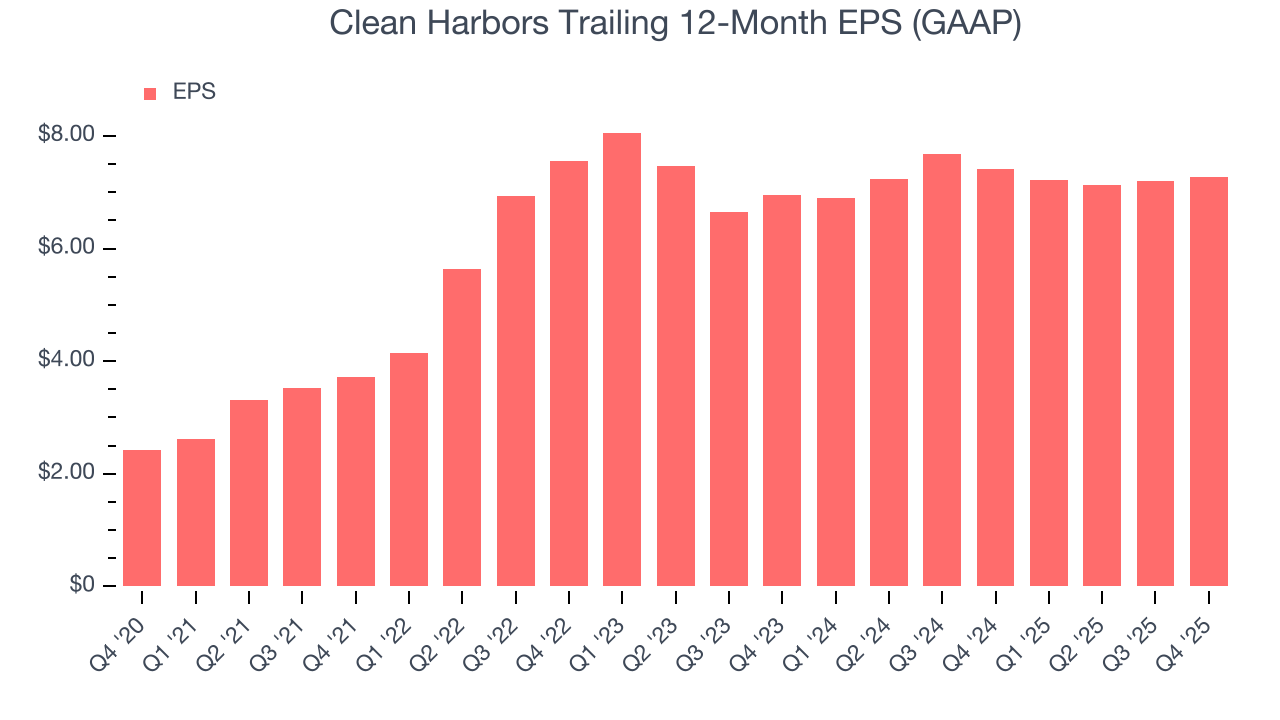
Clean Harbors’s EPS grew at an astounding 24.6% compounded annual growth rate over the last five years, higher than its 13.9% annualized revenue growth. This tells us the company became more profitable on a per-share basis as it expanded.
Diving into the nuances of Clean Harbors’s earnings can give us a better understanding of its performance. As we mentioned earlier, Clean Harbors’s operating margin was flat this quarter but expanded by 2 percentage points over the last five years. On top of that, its share count shrank by 3.4%. These are positive signs for shareholders because improving profitability and share buybacks turbocharge EPS growth relative to revenue growth. 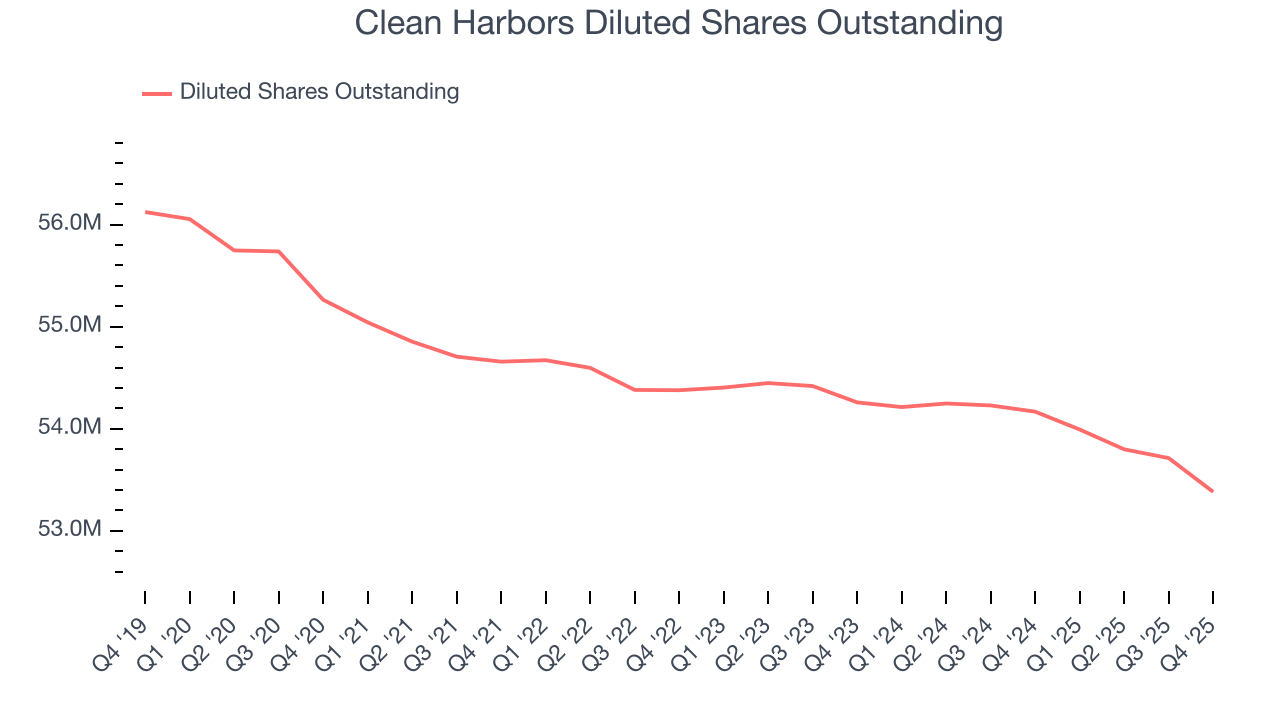
Like with revenue, we analyze EPS over a more recent period because it can provide insight into an emerging theme or development for the business.
For Clean Harbors, its two-year annual EPS growth of 2.3% was lower than its five-year trend. We hope its growth can accelerate in the future.
In Q4, Clean Harbors reported EPS of $1.62, up from $1.55 in the same quarter last year. This print was close to analysts’ estimates. Over the next 12 months, Wall Street expects Clean Harbors’s full-year EPS of $7.28 to grow 10.7%.
9. Cash Is King
Free cash flow isn't a prominently featured metric in company financials and earnings releases, but we think it's telling because it accounts for all operating and capital expenses, making it tough to manipulate. Cash is king.
Clean Harbors has shown decent cash profitability, giving it some flexibility to reinvest or return capital to investors. The company’s free cash flow margin averaged 6.8% over the last five years, slightly better than the broader industrials sector.
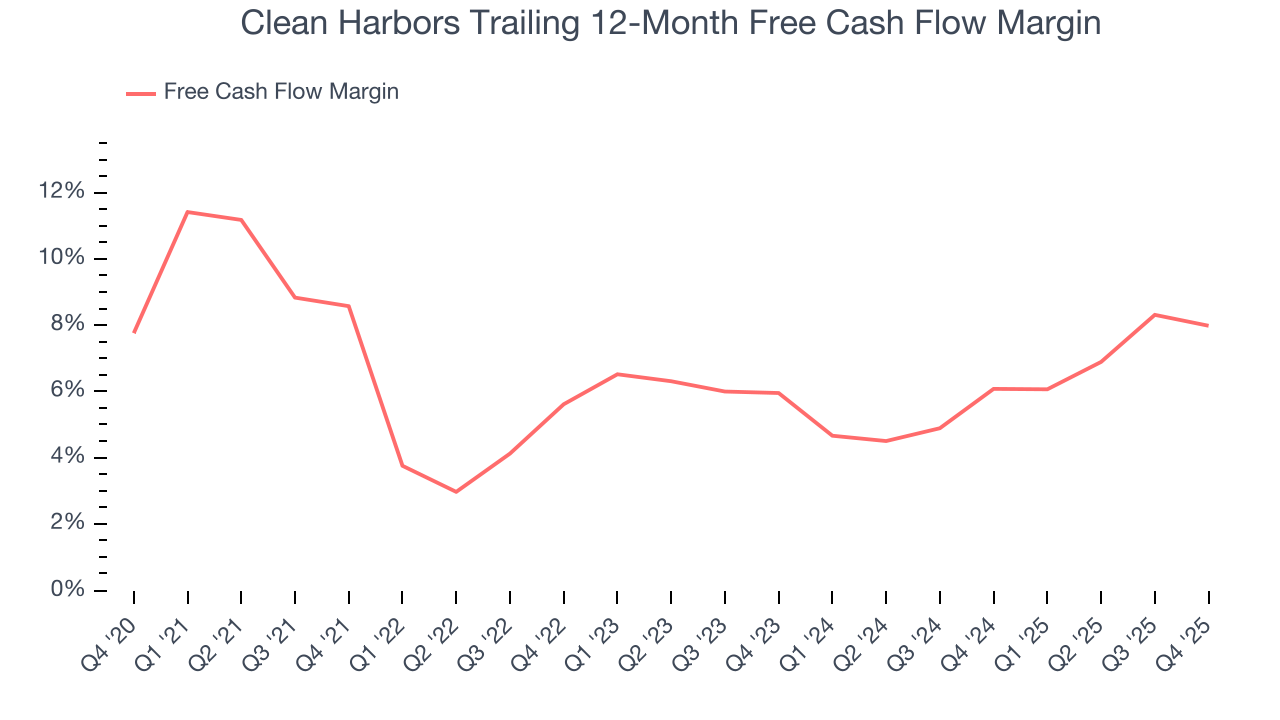
Clean Harbors’s free cash flow clocked in at $233.3 million in Q4, equivalent to a 15.6% margin. The company’s cash profitability regressed as it was 1.7 percentage points lower than in the same quarter last year, but it’s still above its five-year average. We wouldn’t read too much into this quarter’s decline because investment needs can be seasonal, leading to short-term swings. Long-term trends are more important.
10. Return on Invested Capital (ROIC)
EPS and free cash flow tell us whether a company was profitable while growing its revenue. But was it capital-efficient? A company’s ROIC explains this by showing how much operating profit it makes compared to the money it has raised (debt and equity).
Clean Harbors’s management team makes decent investment decisions and generates value for shareholders. Its five-year average ROIC was 11.4%, slightly better than typical industrials business.
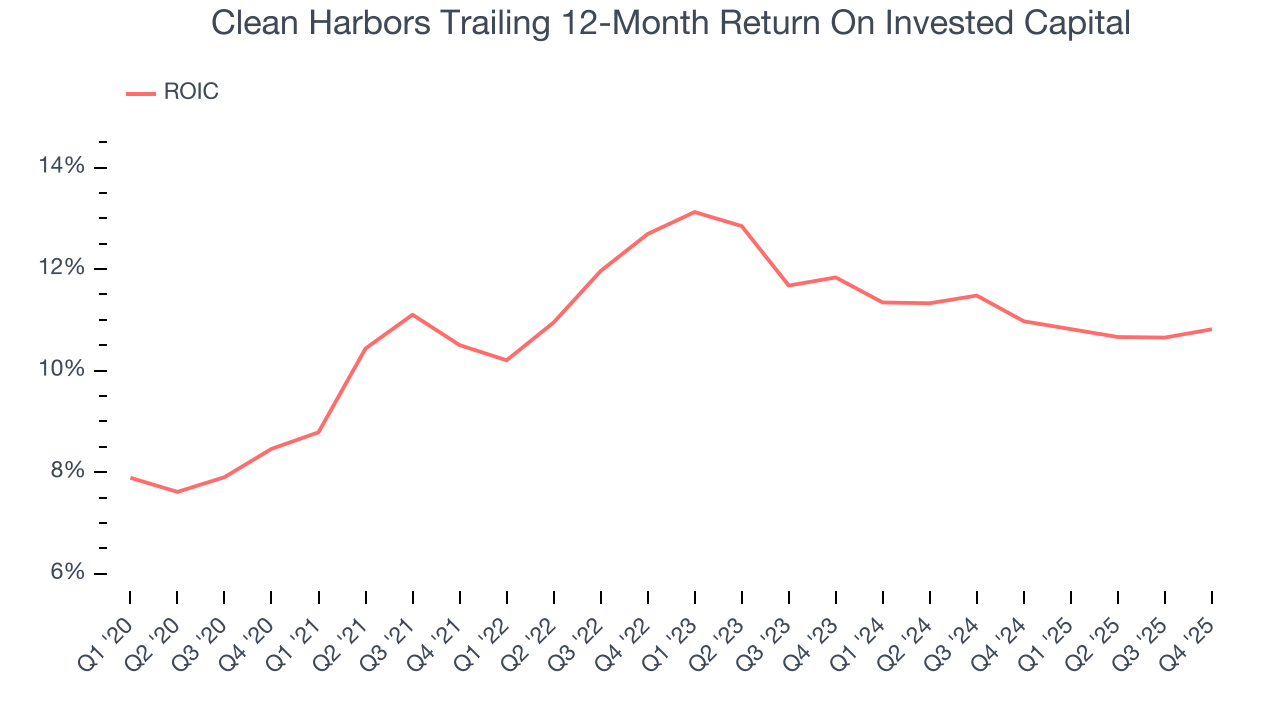
We like to invest in businesses with high returns, but the trend in a company’s ROIC is what often surprises the market and moves the stock price. Uneventfully, Clean Harbors’s ROIC has stayed the same over the last few years. Given the company’s underwhelming financial performance in other areas, we’d like to see its returns improve before recommending the stock.
11. Balance Sheet Assessment
Clean Harbors reported $953.7 million of cash and $3.04 billion of debt on its balance sheet in the most recent quarter. As investors in high-quality companies, we primarily focus on two things: 1) that a company’s debt level isn’t too high and 2) that its interest payments are not excessively burdening the business.
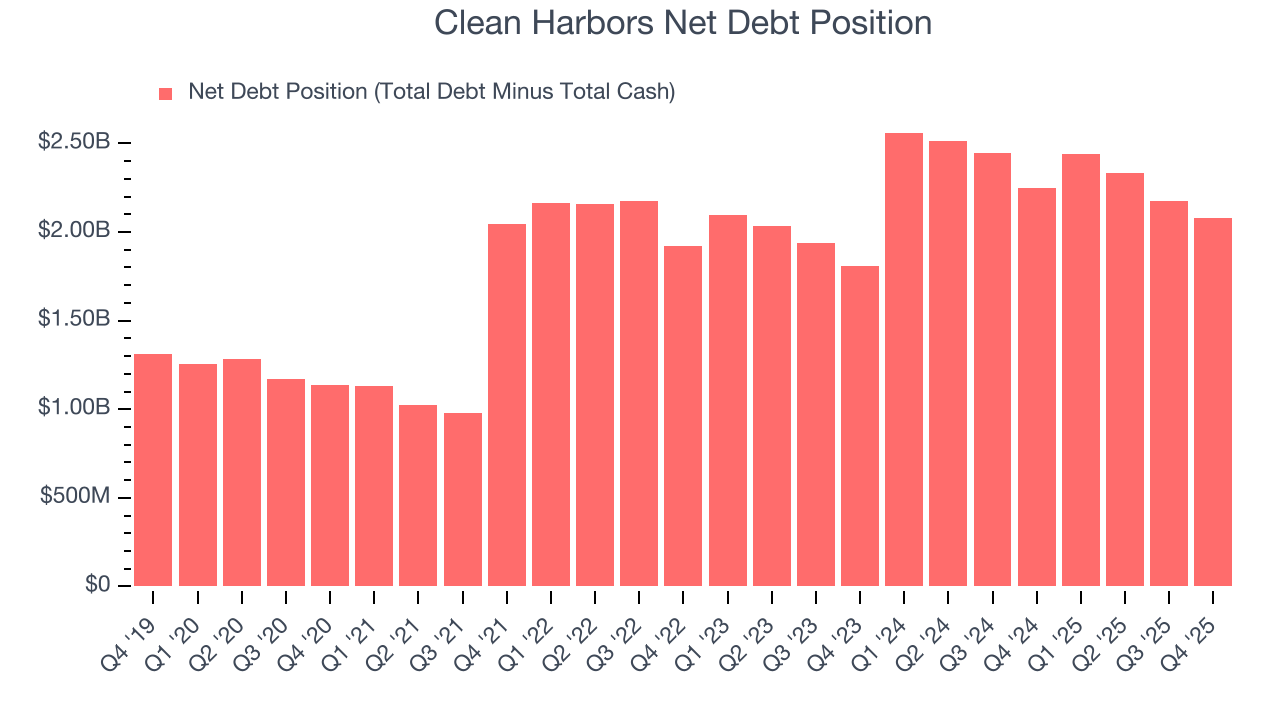
With $1.17 billion of EBITDA over the last 12 months, we view Clean Harbors’s 1.8× net-debt-to-EBITDA ratio as safe. We also see its $143.1 million of annual interest expenses as appropriate. The company’s profits give it plenty of breathing room, allowing it to continue investing in growth initiatives.
12. Key Takeaways from Clean Harbors’s Q4 Results
We enjoyed seeing Clean Harbors beat analysts’ revenue expectations this quarter. We were also happy its EBITDA outperformed Wall Street’s estimates. Overall, this print had some key positives. The stock remained flat at $267.08 immediately following the results.
13. Is Now The Time To Buy Clean Harbors?
Updated: March 14, 2026 at 11:04 PM EDT
We think that the latest earnings result is only one piece of the bigger puzzle. If you’re deciding whether to own Clean Harbors, you should also grasp the company’s longer-term business quality and valuation.
Clean Harbors isn’t a bad business, but we have other favorites. To kick things off, its revenue growth was exceptional over the last five years. On top of that, Clean Harbors’s astounding EPS growth over the last five years shows its profits are trickling down to shareholders, and its projected EPS for the next year implies the company will continue generating shareholder value.
Clean Harbors’s P/E ratio based on the next 12 months is 35.1x. Beauty is in the eye of the beholder, but we don’t really see a big opportunity at the moment. We're fairly confident there are better stocks to buy right now.
Wall Street analysts have a consensus one-year price target of $300.69 on the company (compared to the current share price of $288.94).