
Cars.com (CARS)
We’re skeptical of Cars.com. Its revenue and earnings have underwhelmed, suggesting weak business fundamentals.― StockStory Analyst Team
1. News


2. Summary
Why Cars.com Is Not Exciting
Originally started as a joint venture between several media companies including The Washington Post and The New York Times, Cars.com (NYSE:CARS) is a digital marketplace that connects new and used car buyers and sellers.
- Earnings per share have dipped by 2% annually over the past three years, which is concerning because stock prices follow EPS over the long term
- Marketing and advertising budgets likely need to increase for penetration to accelerate as its dealer customers were flat over the last two years
- On the plus side, its successful business model is illustrated by its impressive EBITDA margin


Cars.com falls below our quality standards. We believe there are better businesses elsewhere.
Why There Are Better Opportunities Than Cars.com


Cars.com’s stock price of $11.60 implies a valuation ratio of 5.2x forward EV/EBITDA. Cars.com’s valuation may seem like a bargain, but we think there are valid reasons why it’s so cheap.
It’s better to pay up for high-quality businesses with higher long-term earnings potential rather than to buy lower-quality stocks because they appear cheap. These challenged businesses often don’t re-rate, a phenomenon known as a “value trap”.
3. Cars.com (CARS) Research Report: Q3 CY2025 Update
Online new and used car marketplace Cars.com (NYSE:CARS) met Wall Streets revenue expectations in Q3 CY2025, with sales up 1.1% year on year to $181.6 million. Its non-GAAP profit of $0.48 per share was in line with analysts’ consensus estimates.
Cars.com (CARS) Q3 CY2025 Highlights:
- Revenue: $181.6 million vs analyst estimates of $181.4 million (1.1% year-on-year growth, in line)
- Adjusted EPS: $0.48 vs analyst estimates of $0.49 (in line)
- Adjusted EBITDA: $54.63 million vs analyst estimates of $53.51 million (30.1% margin, 2.1% beat)
- Operating Margin: 9.3%, up from 6.4% in the same quarter last year
- Free Cash Flow Margin: 29%, up from 10.2% in the previous quarter
- Dealer Customers: 19,526, up 271 year on year
- Market Capitalization: $639.6 million
Company Overview
Originally started as a joint venture between several media companies including The Washington Post and The New York Times, Cars.com (NYSE:CARS) is a digital marketplace that connects new and used car buyers and sellers.
The company's primary product is its website, which allows users to search for new and used cars, research vehicles, and connect with dealerships. Cars.com provides a centralized platform that helps customers make more informed decisions amd simplifies the car buying process.
First, customers can search for cars based on preferences, such as model, price range, and location. This eliminates the need to visit multiple dealerships. Second, the platform provides information about each car, including photos and specifications. This allows consumers to make more informed decisions. Third, the platform provides tools that allow buyers to connect with local dealerships to ask follow-up questions and schedule test drives. This allows buyers to find the right dealership and car. Finally, the platform offers resources such as financing and insurance options. This closes the loop on an actual transaction.
While the platform aims to optimize the buyer experience, Cars.com generates revenue primarily from car dealers who pay for marketplace subscription advertising products. Specifically, dealers pay to have their inventory listed and featured on the Cars.com platform. Other revenue generators include dealer website hosting and reputation management products.
4. Online Marketplace
Marketplaces have existed for centuries. Where once it was a main street in a small town or a mall in the suburbs, sellers benefitted from proximity to one another because they could draw customers by offering convenience and selection. Today, a myriad of online marketplaces fulfill that same role, aggregating large customer bases, which attracts commission-paying sellers, generating flywheel scale effects that feed back into further customer acquisition.
Competitors in the online auto market include Carvana (NYSE:CVNA), CarGurus (NASDAQ:CARG), and Vroom (NASDAQ:VRM).
5. Revenue Growth
A company’s long-term sales performance can indicate its overall quality. Any business can experience short-term success, but top-performing ones enjoy sustained growth for years. Unfortunately, Cars.com’s 3.8% annualized revenue growth over the last three years was sluggish. This fell short of our benchmark for the consumer internet sector and is a poor baseline for our analysis.
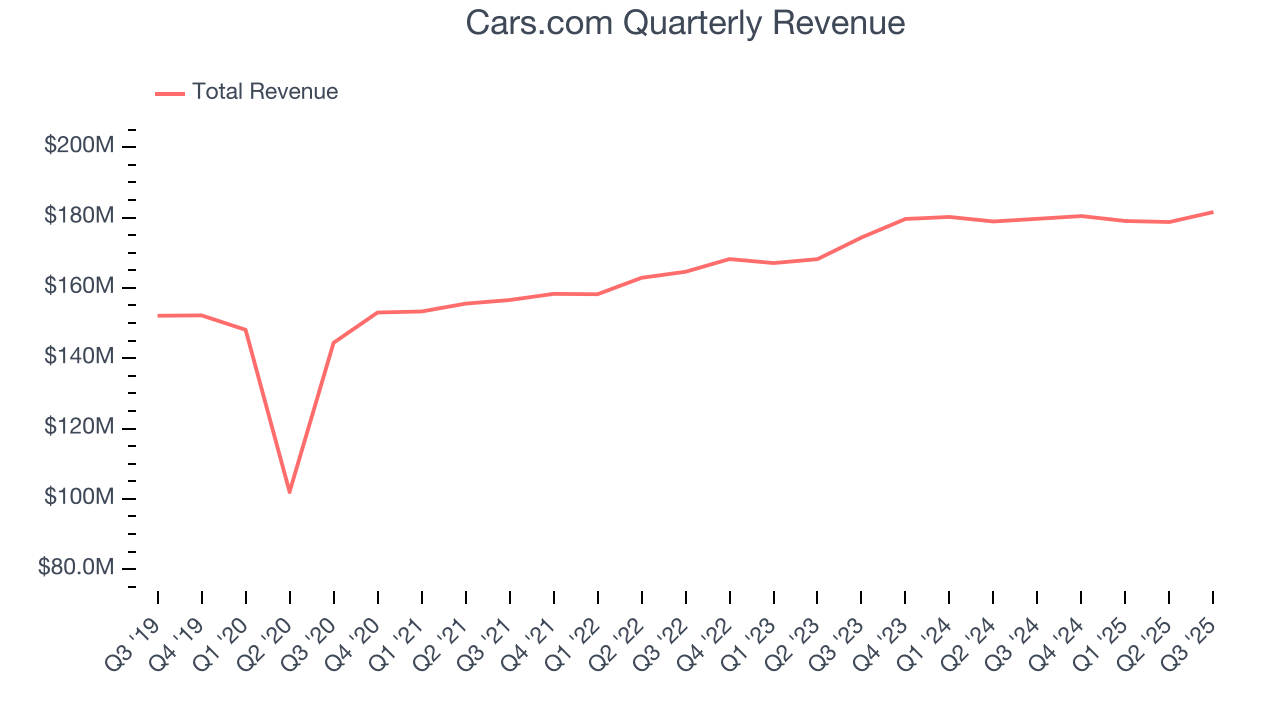
This quarter, Cars.com grew its revenue by 1.1% year on year, and its $181.6 million of revenue was in line with Wall Street’s estimates.
Looking ahead, sell-side analysts expect revenue to grow 2.4% over the next 12 months, similar to its three-year rate. This projection doesn't excite us and implies its products and services will face some demand challenges.
6. Dealer Customers
Buyer Growth
As an online marketplace, Cars.com generates revenue growth by increasing both the number of users on its platform and the average order size in dollars.
Cars.com struggled with new customer acquisition over the last two years as its dealer customers were flat at 19,526. This performance isn't ideal because internet usage is secular, meaning there are typically unaddressed market opportunities. If Cars.com wants to accelerate growth, it likely needs to enhance the appeal of its current offerings or innovate with new products. 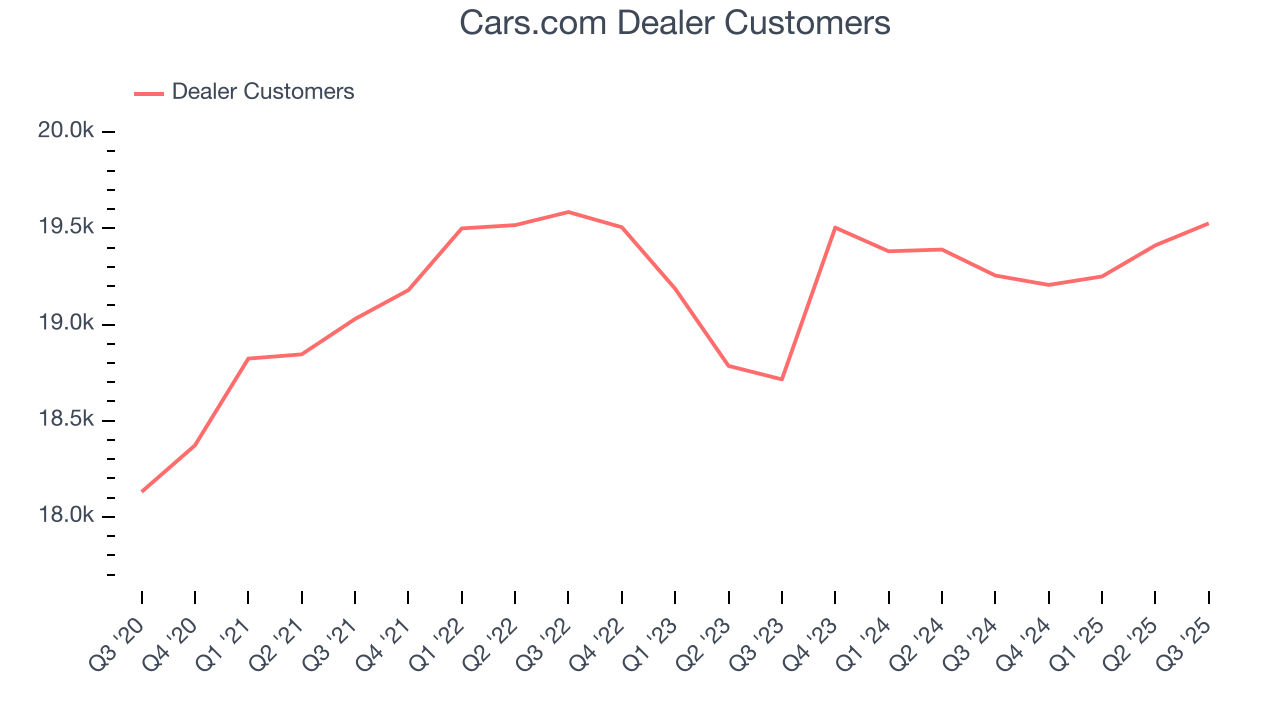
Luckily, Cars.com added 271 dealer customers in Q3, leading to 1.4% year-on-year growth. The quarterly print isn’t too different from its two-year result, suggesting its new initiatives aren’t accelerating buyer growth just yet.
Revenue Per Buyer
Average revenue per buyer (ARPB) is a critical metric to track because it measures how much the company earns in transaction fees from each buyer. ARPB also gives us unique insights into a user’s average order size and Cars.com’s take rate, or "cut", on each order.
Cars.com’s ARPB has been roughly flat over the last two years. This raises questions about its platform’s health when paired with its inability to grow dealer customers. If Cars.com wants to increase its buyers, it must either develop new features or provide some existing ones for free. 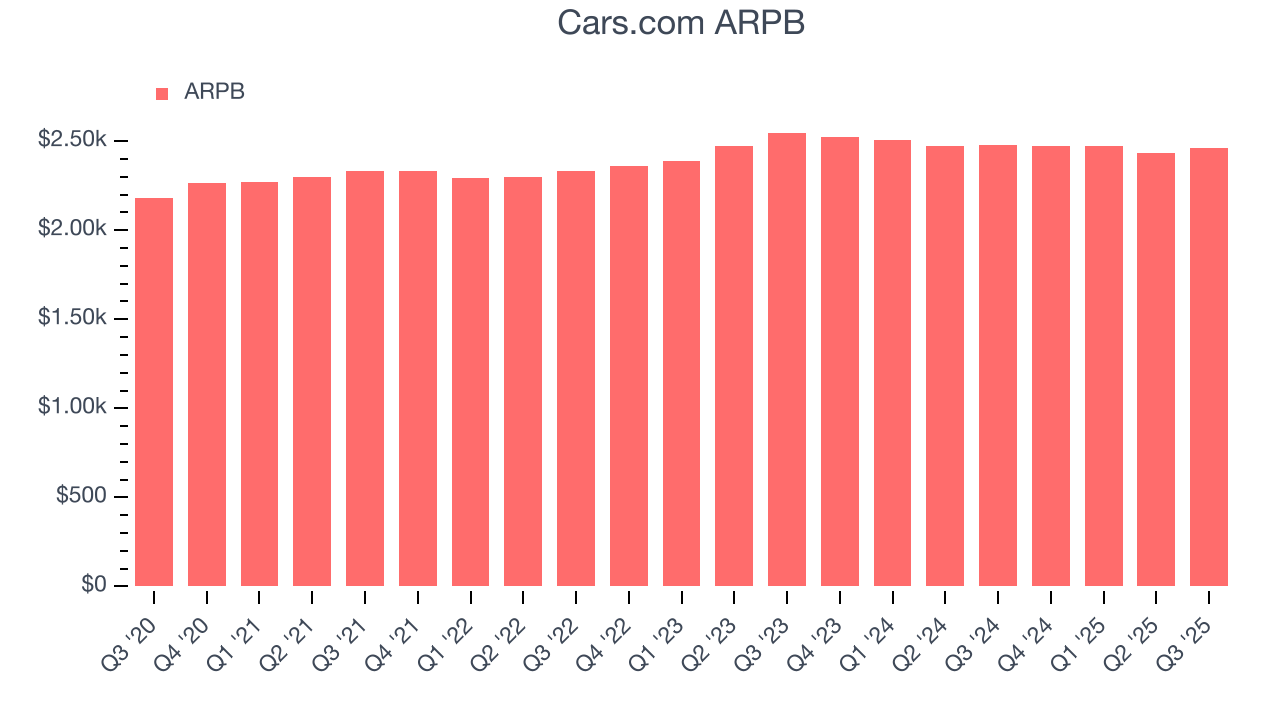
This quarter, Cars.com’s ARPB clocked in at $2,460. It was flat year on year, worse than the change in its dealer customers.
7. Gross Margin & Pricing Power
For online marketplaces like Cars.com, gross profit tells us how much money the company gets to keep after covering the base cost of its products and services, which typically include payment processing, hosting, and bandwidth fees in addition to the costs necessary to onboard buyers and sellers, such as identity verification.
Cars.com has robust unit economics, an output of its asset-lite business model and pricing power. Its margin is better than the broader consumer internet industry and enables the company to fund large investments in new products and marketing during periods of rapid growth to achieve higher profits in the future. As you can see below, it averaged an excellent 67.3% gross margin over the last two years. That means Cars.com only paid its providers $32.73 for every $100 in revenue. 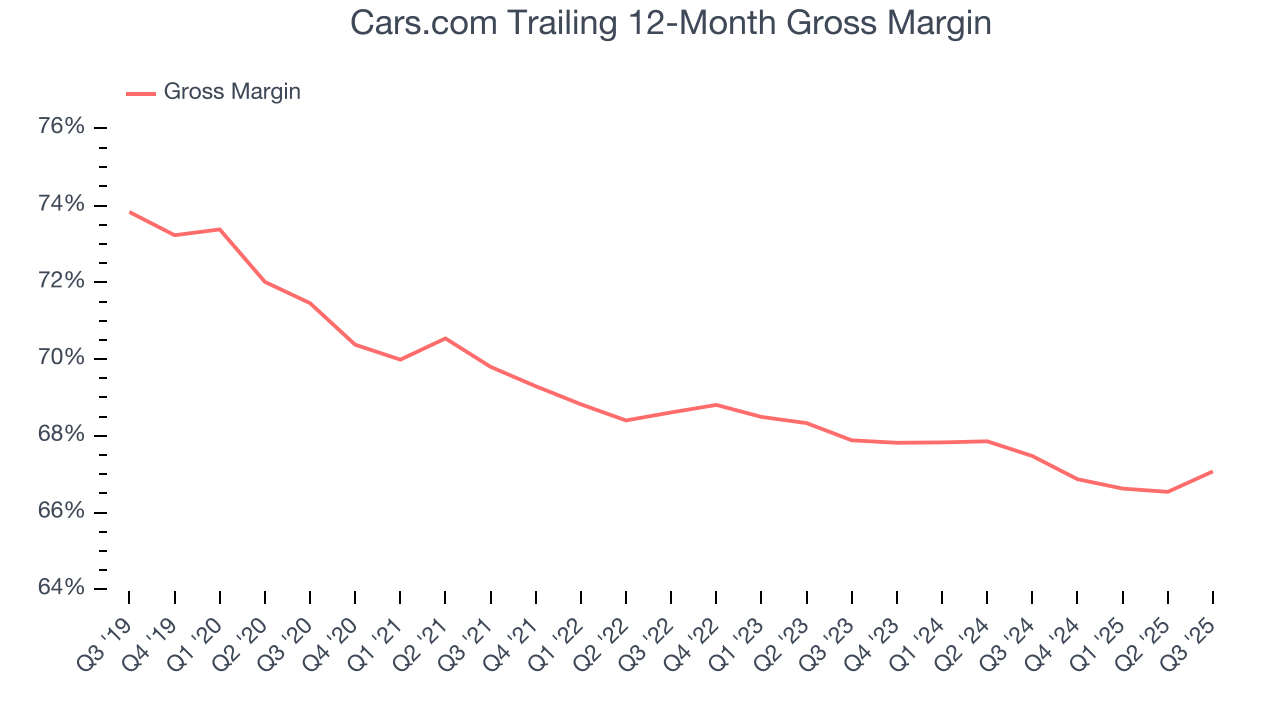
In Q3, Cars.com produced a 68.3% gross profit margin, marking a 2.1 percentage point increase from 66.1% in the same quarter last year. Zooming out, the company’s full-year margin has remained steady over the past 12 months, suggesting its input costs have been stable and it isn’t under pressure to lower prices.
8. User Acquisition Efficiency
Unlike enterprise software that’s typically sold by dedicated sales teams, consumer internet businesses like Cars.com grow from a combination of product virality, paid advertisement, and incentives.
It’s relatively expensive for Cars.com to acquire new users as the company has spent 47.9% of its gross profit on sales and marketing expenses over the last year. This inefficiency indicates that Cars.com operates in a competitive market and must continue investing to maintain an acceptable growth trajectory. 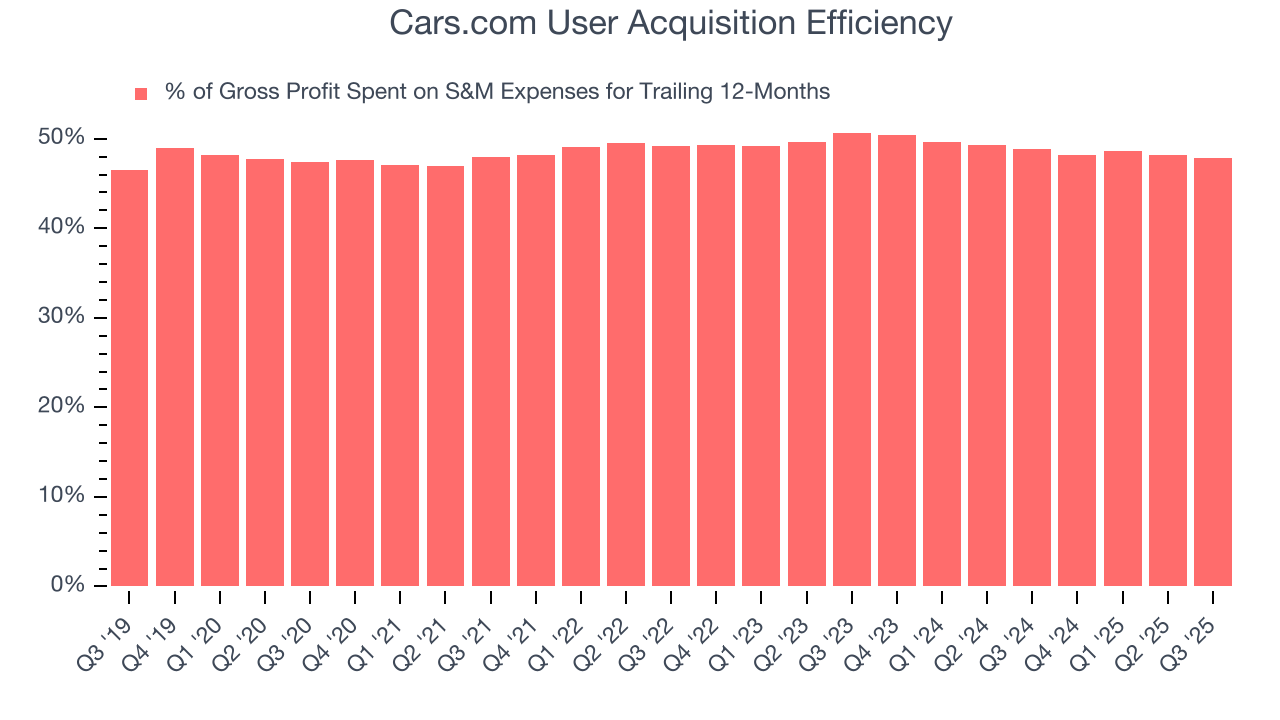
9. EBITDA
Investors frequently analyze operating income to understand a business’s core profitability. Similar to operating income, EBITDA is a common profitability metric for consumer internet companies because it removes various one-time or non-cash expenses, offering a more normalized view of profit potential.
Cars.com’s EBITDA margin might fluctuated slightly over the last 12 months but has remained more or less the same, averaging 29.3% over the last two years. This profitability was elite for a consumer internet business thanks to its efficient cost structure and economies of scale. This result isn’t surprising as its high gross margin gives it a favorable starting point.
Looking at the trend in its profitability, Cars.com’s EBITDA margin might fluctuated slightly but has generally stayed the same over the last few years. This raises questions about the company’s expense base because its revenue growth should have given it leverage on its fixed costs, resulting in better economies of scale and profitability.
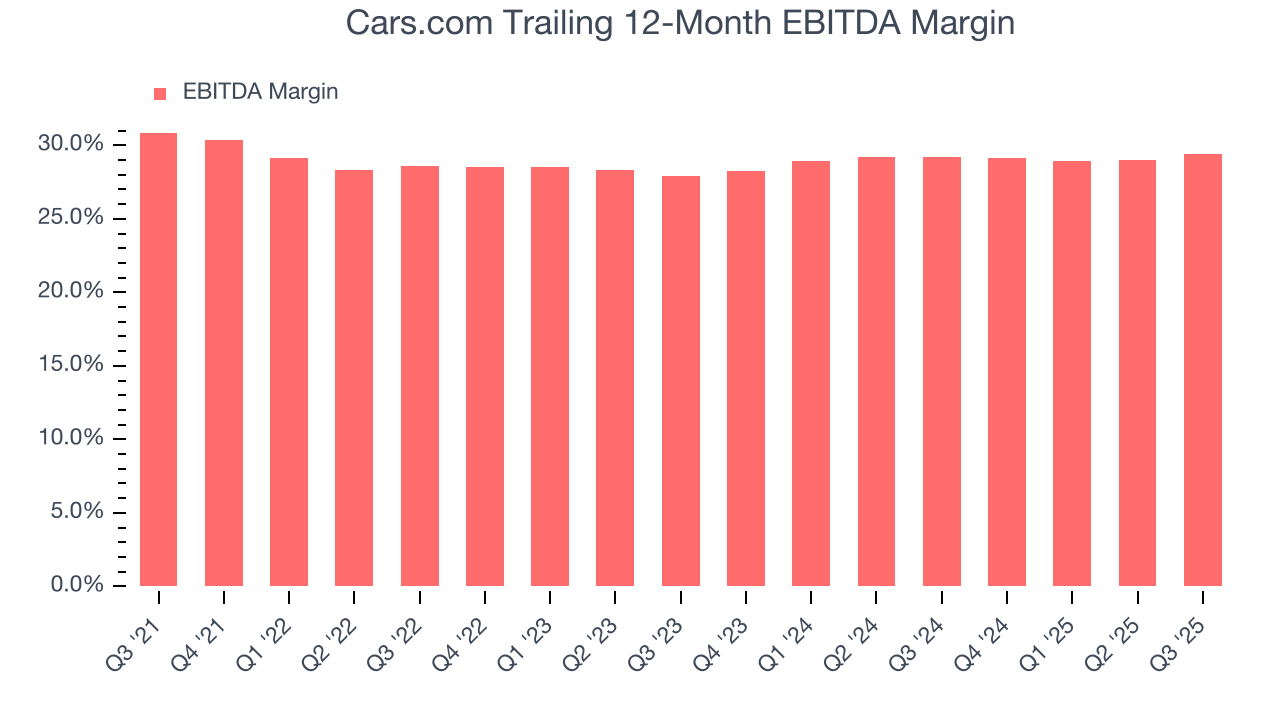
This quarter, Cars.com generated an EBITDA margin profit margin of 30.1%, up 1.6 percentage points year on year. Since its gross margin expanded more than its EBITDA margin, we can infer that leverage on its cost of sales was the primary driver behind the recently higher efficiency.
10. Earnings Per Share
Revenue trends explain a company’s historical growth, but the change in earnings per share (EPS) points to the profitability of that growth – for example, a company could inflate its sales through excessive spending on advertising and promotions.
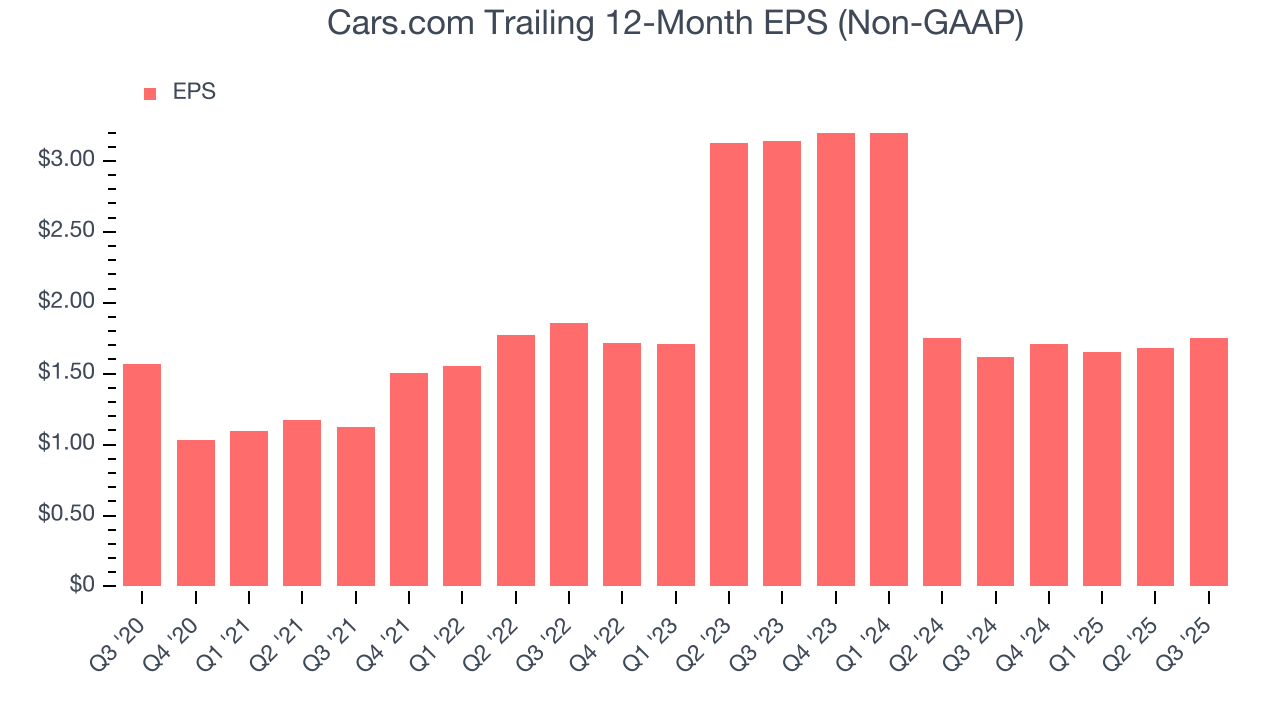
In Q3, Cars.com reported adjusted EPS of $0.48, up from $0.41 in the same quarter last year. Despite growing year on year, this print slightly missed analysts’ estimates. Over the next 12 months, Wall Street expects Cars.com’s full-year EPS of $1.75 to grow 25.5%.
11. Cash Is King
Although EBITDA is undoubtedly valuable for assessing company performance, we believe cash is king because you can’t use accounting profits to pay the bills.
Cars.com has shown robust cash profitability, driven by its attractive business model that enables it to reinvest or return capital to investors while maintaining a cash cushion. The company’s free cash flow margin averaged 18.3% over the last two years, quite impressive for a consumer internet business.
Taking a step back, we can see that Cars.com’s margin expanded by 1.4 percentage points over the last few years. This is encouraging because it gives the company more optionality.
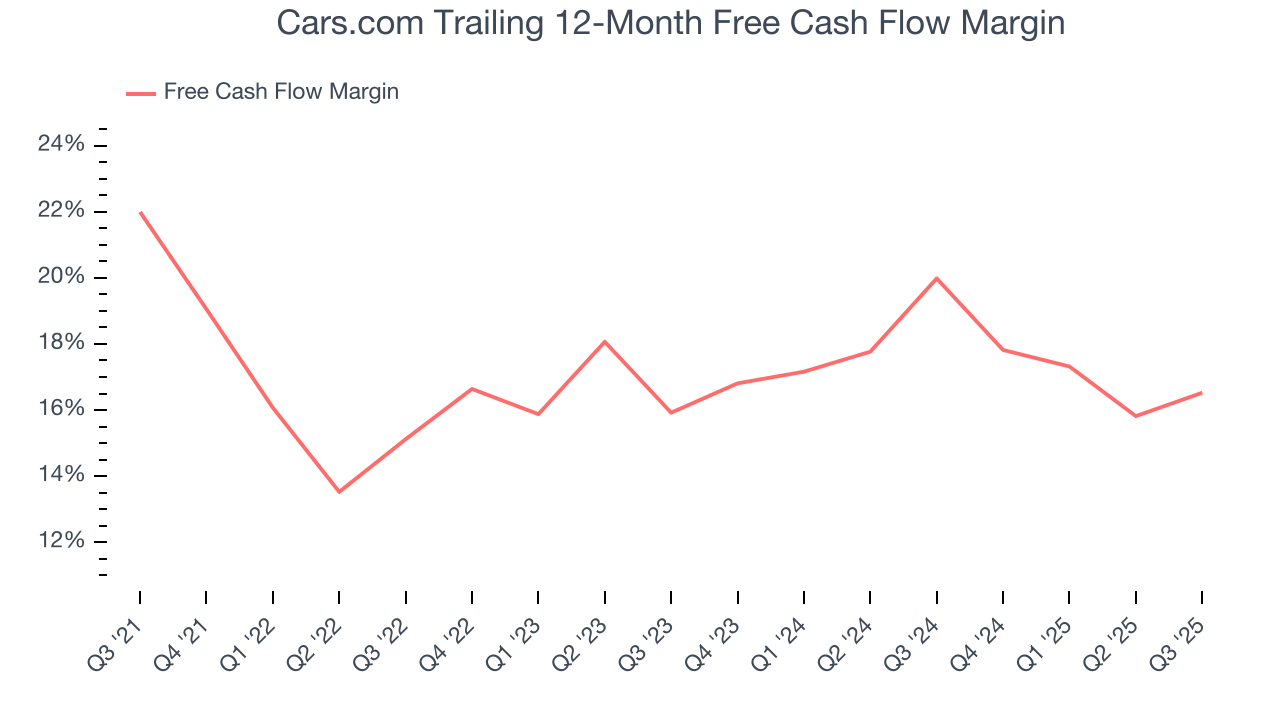
Cars.com’s free cash flow clocked in at $52.64 million in Q3, equivalent to a 29% margin. This result was good as its margin was 2.7 percentage points higher than in the same quarter last year, building on its favorable historical trend.
12. Balance Sheet Assessment
Cars.com reported $55.07 million of cash and $451.2 million of debt on its balance sheet in the most recent quarter. As investors in high-quality companies, we primarily focus on two things: 1) that a company’s debt level isn’t too high and 2) that its interest payments are not excessively burdening the business.
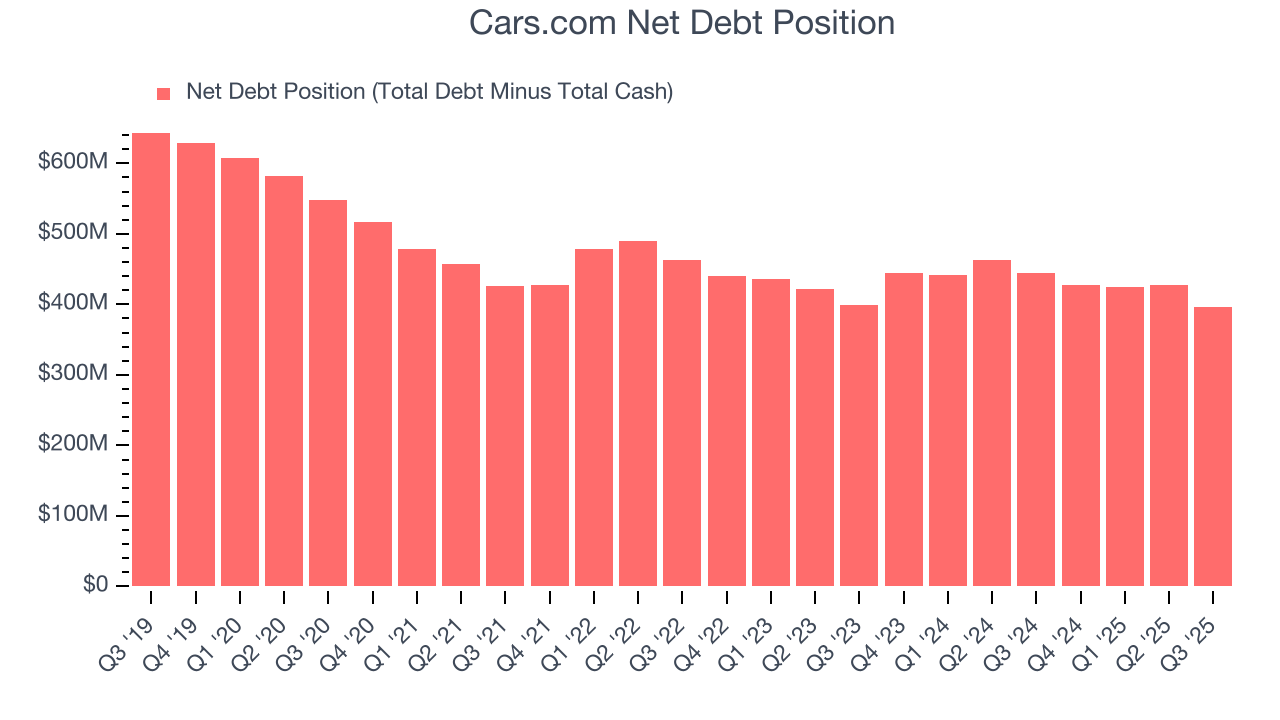
With $211.7 million of EBITDA over the last 12 months, we view Cars.com’s 1.9× net-debt-to-EBITDA ratio as safe. We also see its $30.68 million of annual interest expenses as appropriate. The company’s profits give it plenty of breathing room, allowing it to continue investing in growth initiatives.
13. Key Takeaways from Cars.com’s Q3 Results
It was encouraging to see Cars.com beat analysts’ EBITDA expectations this quarter.Zooming out, we think this was a decent quarter. The stock traded up 5.3% to $10.93 immediately after reporting.
14. Is Now The Time To Buy Cars.com?
Updated: January 20, 2026 at 9:27 PM EST
Before making an investment decision, investors should account for Cars.com’s business fundamentals and valuation in addition to what happened in the latest quarter.
Cars.com isn’t a terrible business, but it doesn’t pass our bar. For starters, its revenue growth was weak over the last three years, and analysts expect its demand to deteriorate over the next 12 months. And while its impressive EBITDA margins show it has a highly efficient business model, the downside is its declining EPS over the last three years makes it a less attractive asset to the public markets. On top of that, its active buyers were flat.
Cars.com’s EV/EBITDA ratio based on the next 12 months is 5.2x. While this valuation is reasonable, we don’t really see a big opportunity at the moment. We're fairly confident there are better investments elsewhere.
Wall Street analysts have a consensus one-year price target of $16.79 on the company (compared to the current share price of $11.60).
Although the price target is bullish, readers should exercise caution because analysts tend to be overly optimistic. The firms they work for, often big banks, have relationships with companies that extend into fundraising, M&A advisory, and other rewarding business lines. As a result, they typically hesitate to say bad things for fear they will lose out. We at StockStory do not suffer from such conflicts of interest, so we’ll always tell it like it is.