
Compass (COMP)
We’re wary of Compass. Its underwhelming revenue growth and failure to generate meaningful free cash flow is a concerning trend.― StockStory Analyst Team
1. News
2. Summary
Why We Think Compass Will Underperform
Fueled by its mission to replace the "paper-driven, antiquated workflow" of buying a house, Compass (NYSE:COMP) is a digital-first company operating a residential real estate brokerage in the United States.
- Muted 13.3% annual revenue growth over the last five years shows its demand lagged behind its consumer discretionary peers
- Historical operating margin losses point to an inefficient cost structure
- One positive is that its market share is on track to rise over the next 12 months as its 99.1% projected revenue growth implies demand will accelerate from its two-year trend


Compass’s quality doesn’t meet our expectations. We’d search for superior opportunities elsewhere.
Why There Are Better Opportunities Than Compass


Compass is trading at $8.35 per share, or 15.4x forward P/E. This multiple is lower than most consumer discretionary companies, but for good reason.
We’d rather pay up for companies with elite fundamentals than get a bargain on weak ones. Cheap stocks can be value traps, and as their performance deteriorates, they will stay cheap or get even cheaper.
3. Compass (COMP) Research Report: Q4 CY2025 Update
Real estate technology company Compass (NYSE:COMP) announced better-than-expected revenue in Q4 CY2025, with sales up 23.1% year on year to $1.7 billion. The company expects next quarter’s revenue to be around $2.65 billion, close to analysts’ estimates. Its GAAP loss of $0.07 per share was 18.1% below analysts’ consensus estimates.
Compass (COMP) Q4 CY2025 Highlights:
- Revenue: $1.7 billion vs analyst estimates of $1.67 billion (23.1% year-on-year growth, 1.8% beat)
- EPS (GAAP): -$0.07 vs analyst expectations of -$0.06 (18.1% miss)
- Adjusted EBITDA: $58.3 million vs analyst estimates of $49.71 million (3.4% margin, 17.3% beat)
- Revenue Guidance for Q1 CY2026 is $2.65 billion at the midpoint, roughly in line with what analysts were expecting
- EBITDA guidance for Q1 CY2026 is $25 million at the midpoint, below analyst estimates of $43.08 million
- Operating Margin: -2.5%, in line with the same quarter last year
- Free Cash Flow Margin: 2.5%, similar to the same quarter last year
- Transactions: 60,328, up 9,917 year on year
- Market Capitalization: $5.36 billion
Company Overview
Fueled by its mission to replace the "paper-driven, antiquated workflow" of buying a house, Compass (NYSE:COMP) is a digital-first company operating a residential real estate brokerage in the United States.
While the company operates like a traditional real estate brokerage on the surface by hiring agents and holding physical offices, Compass prides itself on its proprietary software platform designed to increase the productivity of its agents. Its integrated suite of software applications, from marketing and client relationship management tools to data analytics and workflow automation, aims to simplify the various stages of the real estate transaction process.
Compass’s agent-centric philosophy extends to its support and development programs. The company invests in the professional development of its agents, offering training and support that emphasize real estate expertise and technology utilization. This approach along with the increased efficiency from its software platform has historically attracted agents to the company (which, in theory, should lead to more transactions).
Compass generates revenue from transaction fees and supplements its core brokerage business with title, escrow, and financing services.
4. Consumer Discretionary - Real Estate Services
The Consumer Discretionary sector, by definition, is made up of companies selling non-essential goods and services. When economic conditions deteriorate or tastes shift, consumers can easily cut back or eliminate these purchases. For long-term investors with five-year holding periods, this creates a structural challenge: the sector is inherently hit-driven, with low switching costs and fickle customers. As a result, only a handful of companies can reliably grow demand and compound earnings over long periods, which is why our bar is high and High Quality ratings are rare.
Real estate services companies provide brokerage, property management, appraisal, and advisory services, earning transaction-based commissions and recurring management fees. Tailwinds include long-term housing demand driven by demographic growth, technology platforms that expand market access, and commercial real estate complexity that sustains advisory needs. Headwinds are pronounced: rising interest rates directly suppress transaction volumes by reducing housing affordability and commercial deal activity. Commission-rate compression, driven by discount brokerages and regulatory changes, erodes per-transaction revenue. The industry is highly cyclical, with revenue swings amplified by leverage. PropTech (property technology) disruptors threaten traditional intermediary models.
Compass's primary competitors include Zillow (NASDAQ:ZG), Redfin (NASDAQ:RDFN), and eXp World (NASDAQ:EXPI).
5. Revenue Growth
Examining a company’s long-term performance can provide clues about its quality. Even a bad business can shine for one or two quarters, but a top-tier one grows for years. Over the last five years, Compass grew its sales at a 13.3% annual rate. Though this growth is acceptable on an absolute basis, we need to see more than just topline growth for the consumer discretionary sector, which can display significant earnings volatility. This means our bar for the sector is particularly high, reflecting the non-essential and hit-driven nature of the products and services offered. Additionally, five-year CAGR starts around Covid, when revenue was depressed then rebounded.
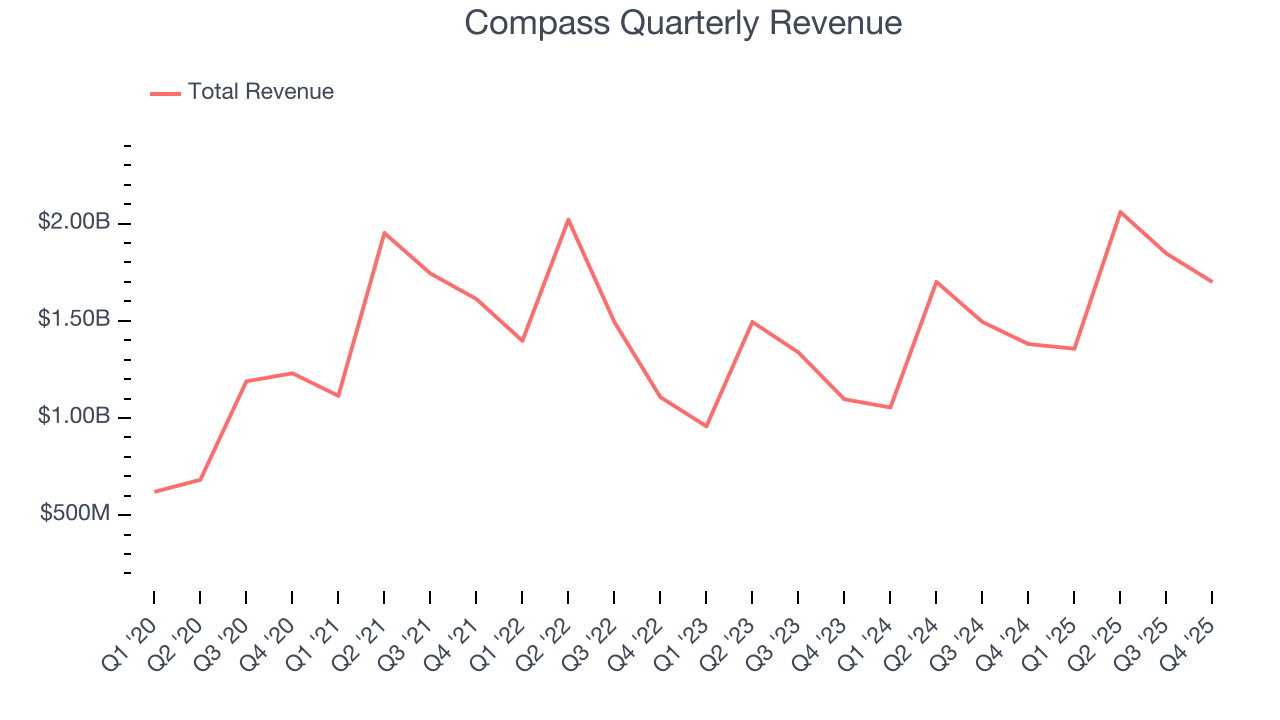
Long-term growth is the most important, but within consumer discretionary, product cycles are short and revenue can be hit-driven due to rapidly changing trends and consumer preferences. Compass’s annualized revenue growth of 19.4% over the last two years is above its five-year trend, which is encouraging. 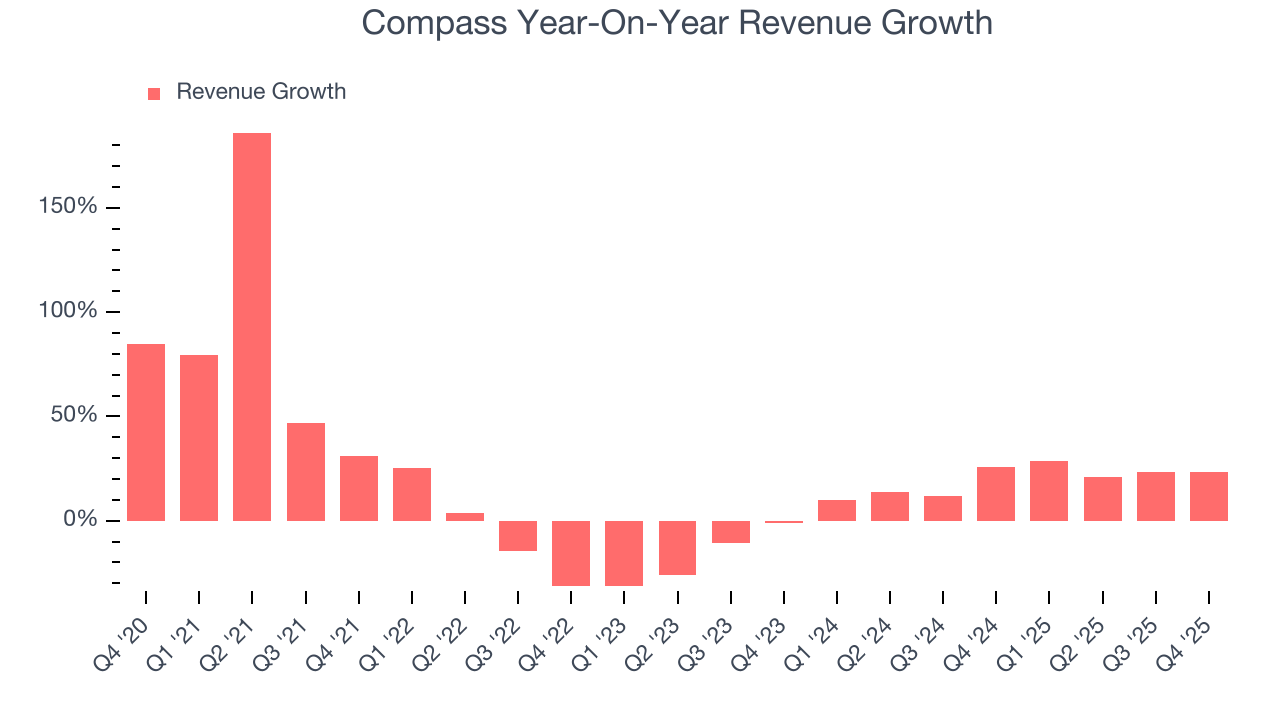
We can dig further into the company’s revenue dynamics by analyzing its number of transactions, which reached 60,328 in the latest quarter. Over the last two years, Compass’s transactions averaged 21.7% year-on-year growth. Because this number is higher than its revenue growth during the same period, we can see the company’s monetization has fallen. 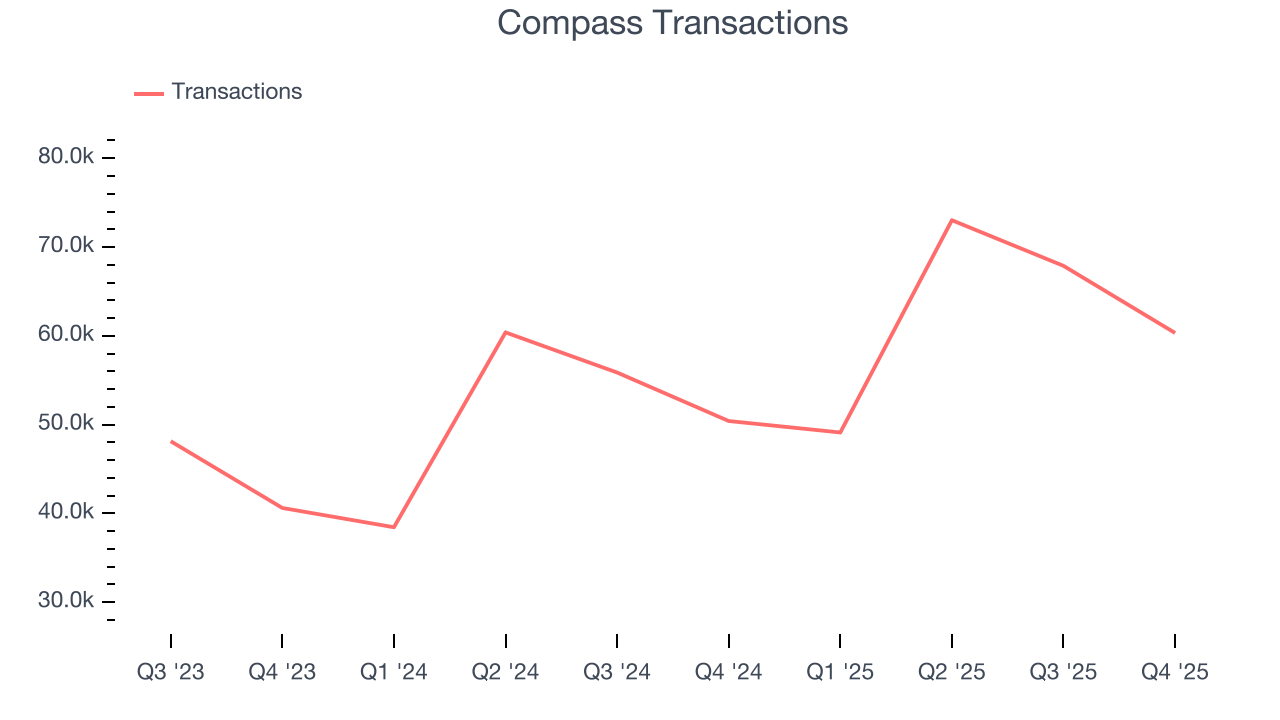
This quarter, Compass reported robust year-on-year revenue growth of 23.1%, and its $1.7 billion of revenue topped Wall Street estimates by 1.8%. Company management is currently guiding for a 95.4% year-on-year increase in sales next quarter.
Looking further ahead, sell-side analysts expect revenue to grow 100% over the next 12 months, an improvement versus the last two years. This projection is eye-popping and suggests its newer products and services will spur better top-line performance.
6. Operating Margin
Compass’s operating margin has been trending up over the last 12 months, but it still averaged negative 1.7% over the last two years. This is due to its large expense base and inefficient cost structure.
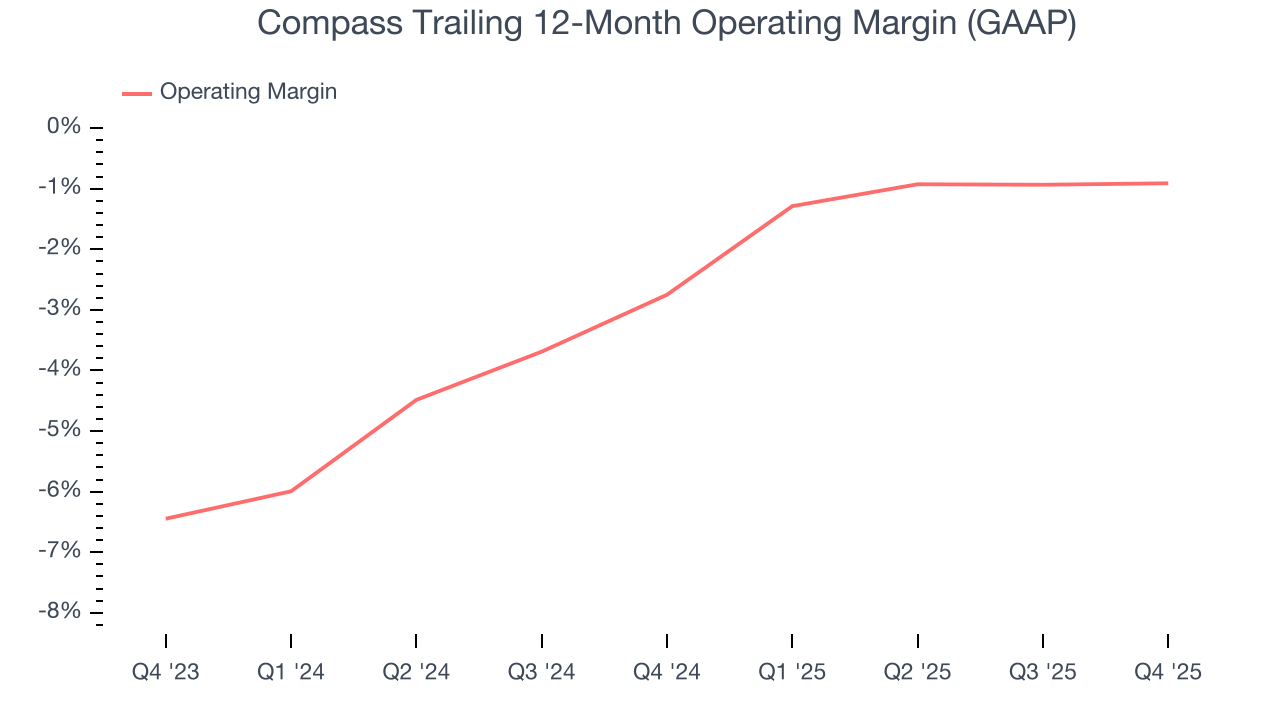
This quarter, Compass generated a negative 2.5% operating margin. The company's consistent lack of profits raise a flag.
7. Earnings Per Share
Revenue trends explain a company’s historical growth, but the long-term change in earnings per share (EPS) points to the profitability of that growth – for example, a company could inflate its sales through excessive spending on advertising and promotions.
Although Compass’s full-year earnings are still negative, it reduced its losses and improved its EPS by 47.3% annually over the last five years. The next few quarters will be critical for assessing its long-term profitability.
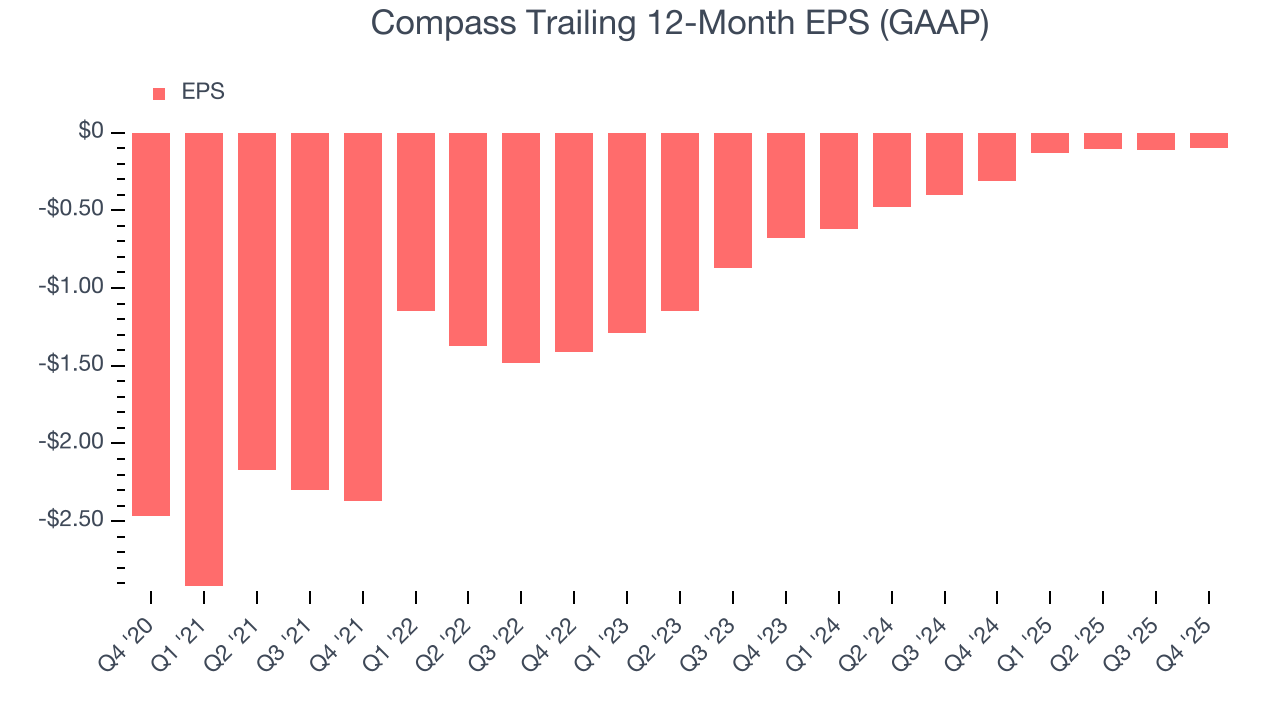
In Q4, Compass reported EPS of negative $0.07, up from negative $0.08 in the same quarter last year. Despite growing year on year, this print missed analysts’ estimates. Over the next 12 months, Wall Street is optimistic. Analysts forecast Compass’s full-year EPS of negative $0.10 will flip to positive $0.32.
8. Cash Is King
Although earnings are undoubtedly valuable for assessing company performance, we believe cash is king because you can’t use accounting profits to pay the bills.
Compass has shown poor cash profitability over the last two years, giving the company limited opportunities to return capital to shareholders. Its free cash flow margin averaged 2.5%, lousy for a consumer discretionary business.
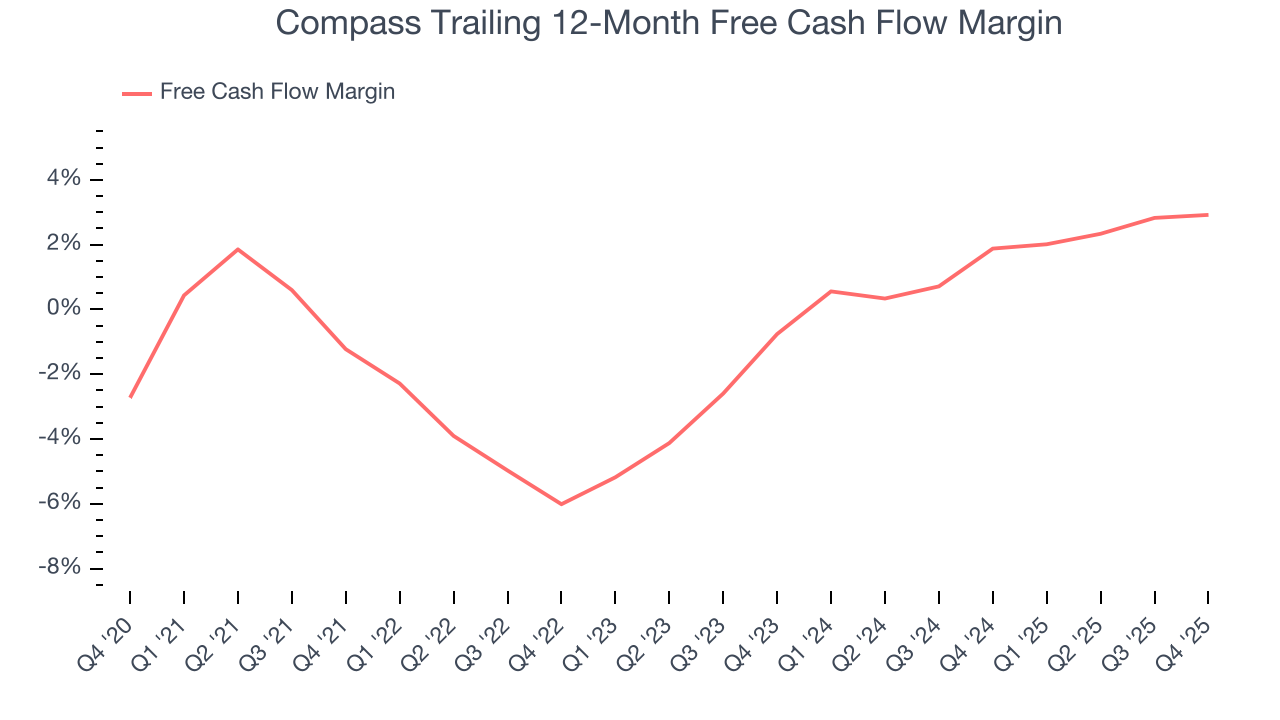
Compass’s free cash flow clocked in at $42.2 million in Q4, equivalent to a 2.5% margin. This cash profitability was in line with the comparable period last year and its two-year average.
9. Balance Sheet Assessment
Compass reported $199 million of cash and $476.2 million of debt on its balance sheet in the most recent quarter. As investors in high-quality companies, we primarily focus on two things: 1) that a company’s debt level isn’t too high and 2) that its interest payments are not excessively burdening the business.
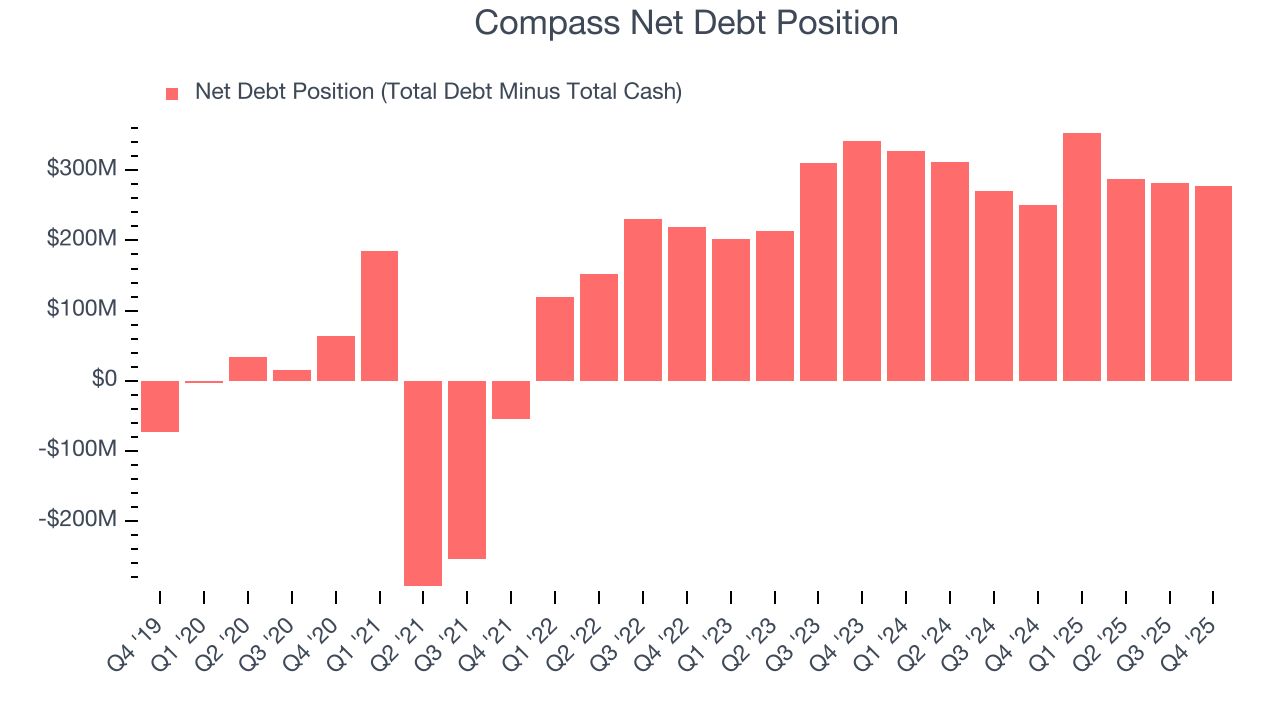
With $293.4 million of EBITDA over the last 12 months, we view Compass’s 0.9× net-debt-to-EBITDA ratio as safe. We also see its $1.6 million of annual interest expenses as appropriate. The company’s profits give it plenty of breathing room, allowing it to continue investing in growth initiatives.
10. Key Takeaways from Compass’s Q4 Results
We enjoyed seeing Compass beat analysts’ EBITDA expectations this quarter. We were also happy its revenue outperformed Wall Street’s estimates. On the other hand, its EPS missed and its EBITDA guidance for next quarter fell short of Wall Street’s estimates. Overall, this was a weaker quarter. The stock traded down 2.9% to $9.71 immediately following the results.
11. Is Now The Time To Buy Compass?
Updated: March 14, 2026 at 10:10 PM EDT
The latest quarterly earnings matters, sure, but we actually think longer-term fundamentals and valuation matter more. Investors should consider all these pieces before deciding whether or not to invest in Compass.
Compass isn’t a terrible business, but it isn’t one of our picks. While its projected EPS for the next year implies the company’s fundamentals will improve, the downside is its low free cash flow margins give it little breathing room. On top of that, its operating margins reveal poor profitability compared to other consumer discretionary companies.
Compass’s P/E ratio based on the next 12 months is 15.4x. This valuation is reasonable, but the company’s shakier fundamentals present too much downside risk. We're pretty confident there are more exciting stocks to buy at the moment.
Wall Street analysts have a consensus one-year price target of $14.09 on the company (compared to the current share price of $8.35).
Although the price target is bullish, readers should exercise caution because analysts tend to be overly optimistic. The firms they work for, often big banks, have relationships with companies that extend into fundraising, M&A advisory, and other rewarding business lines. As a result, they typically hesitate to say bad things for fear they will lose out. We at StockStory do not suffer from such conflicts of interest, so we’ll always tell it like it is.