
Disney (DIS)
We wouldn’t recommend Disney. Its weak sales growth and low returns on capital show it struggled to generate demand and profits.― StockStory Analyst Team
1. News
2. Summary
Why We Think Disney Will Underperform
Founded by brothers Walt and Roy, Disney (NYSE:DIS) is a multinational entertainment conglomerate, renowned for its theme parks, movies, television networks, and merchandise.
- Sizable revenue base leads to growth challenges as its 9.5% annual revenue increases over the last five years fell short of other consumer discretionary companies
- Low free cash flow margin gives it little breathing room, constraining its ability to self-fund growth or return capital to shareholders
- ROIC of 7.3% reflects management’s challenges in identifying attractive investment opportunities


Disney’s quality is inadequate. We’re looking for better stocks elsewhere.
Why There Are Better Opportunities Than Disney


At $104.86 per share, Disney trades at 16.4x forward P/E. This multiple is lower than most consumer discretionary companies, but for good reason.
We’d rather pay up for companies with elite fundamentals than get a bargain on weak ones. Cheap stocks can be value traps, and as their performance deteriorates, they will stay cheap or get even cheaper.
3. Disney (DIS) Research Report: Q4 CY2025 Update
Global entertainment and media company Disney (NYSE:DIS) announced better-than-expected revenue in Q4 CY2025, with sales up 5.2% year on year to $25.98 billion. Its non-GAAP profit of $1.63 per share was 3.4% above analysts’ consensus estimates.
Disney (DIS) Q4 CY2025 Highlights:
- Revenue: $25.98 billion vs analyst estimates of $25.78 billion (5.2% year-on-year growth, 0.8% beat)
- Adjusted EPS: $1.63 vs analyst estimates of $1.58 (3.4% beat)
- Adjusted EBITDA: $6.25 billion vs analyst estimates of $5.22 billion (24% margin, 19.8% beat)
- Operating Margin: 17.7%, in line with the same quarter last year
- Free Cash Flow was -$2.28 billion, down from $739 million in the same quarter last year
- Market Capitalization: $201.4 billion
Company Overview
Founded by brothers Walt and Roy, Disney (NYSE:DIS) is a multinational entertainment conglomerate, renowned for its theme parks, movies, television networks, and merchandise.
When it was founded in 1923, the Disney brothers' key focus was on animation, and the company gained wide acclaim for 'Steamboat Willie', an animated short film that was innovative for its time. In addition to that groundbreaking film, Disney created iconic characters such as Mickey Mouse, Donald Duck, and Pluto, paving the way for the company to move from animation to broader family entertainment.
Today, Disney's business encompasses areas such as traditional TV networks such as ABC and ESPN, theme parks and resorts, film production and distribution, streaming services, and consumer products such as toys. Because of these diverse business lines, Disney's presence is nearly ubiquitous to Americans and even the international consumer. The company therefore counts a wide range of ages and demographics as customers. Everyone from that toddler watching 'Frozen' for the 306th time on Disney+ to the avid sports fan who depends on ESPN to stay up on sports scores to the family visiting Disney World is a customer.
Disney's products and offerings are diverse, so it follows that how the company makes money is diverse as well. Some sources of revenue include tickets for theme parks, monthly subscriptions for Disney+, and toys. Other less-obvious revenue sources include advertising on its television networks and affiliate/retransmission fees from companies that carry its channels.
4. Media
The advent of the internet changed how shows, films, music, and overall information flow. As a result, many media companies now face secular headwinds as attention shifts online. Some have made concerted efforts to adapt by introducing digital subscriptions, podcasts, and streaming platforms. Time will tell if their strategies succeed and which companies will emerge as the long-term winners.
Competitors in the entertainment and media industry include Comcast (NASDAQ:CMCSA), Warner Bros. Discovery (NASDAQ:WBD), and Paramount Global (NASDAQ:PARA).
5. Revenue Growth
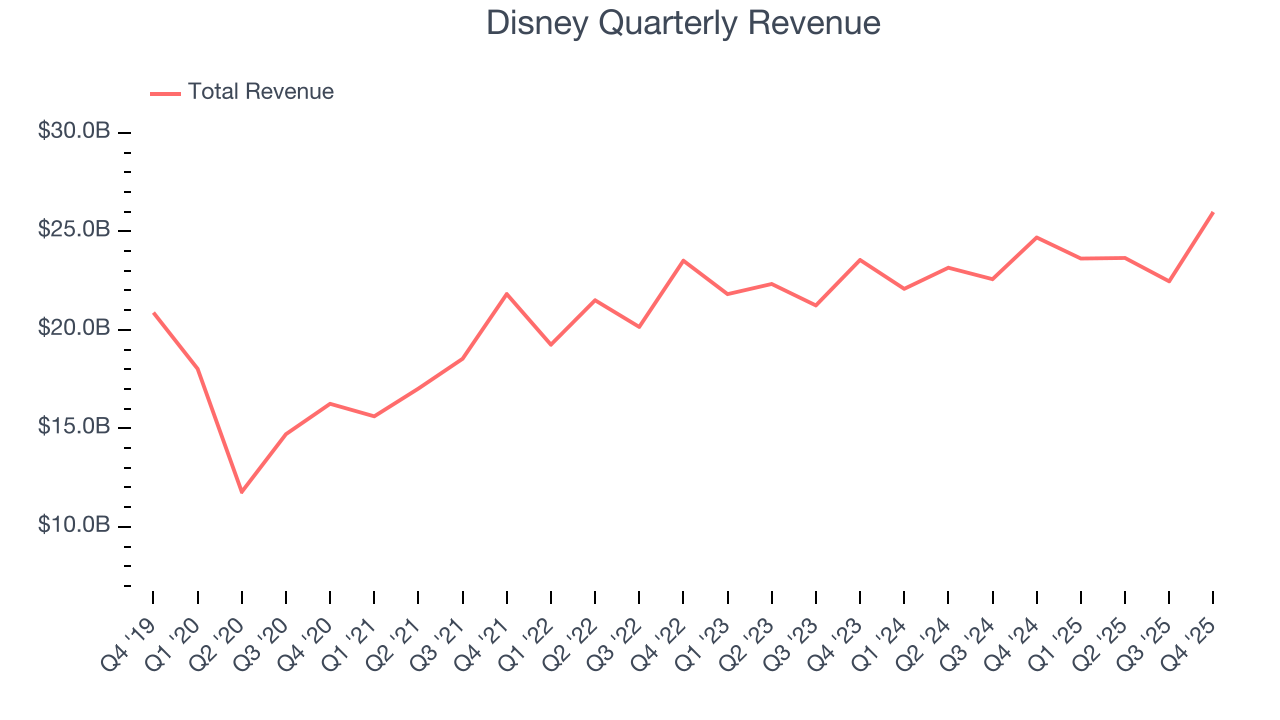
A company’s long-term performance is an indicator of its overall quality. Any business can put up a good quarter or two, but many enduring ones grow for years. Over the last five years, Disney grew its sales at a weak 9.5% compounded annual growth rate. This was below our standard for the consumer discretionary sector and is a poor baseline for our analysis.
Long-term growth is the most important, but within consumer discretionary, product cycles are short and revenue can be hit-driven due to rapidly changing trends and consumer preferences. Disney’s recent performance shows its demand has slowed as its annualized revenue growth of 3.7% over the last two years was below its five-year trend. 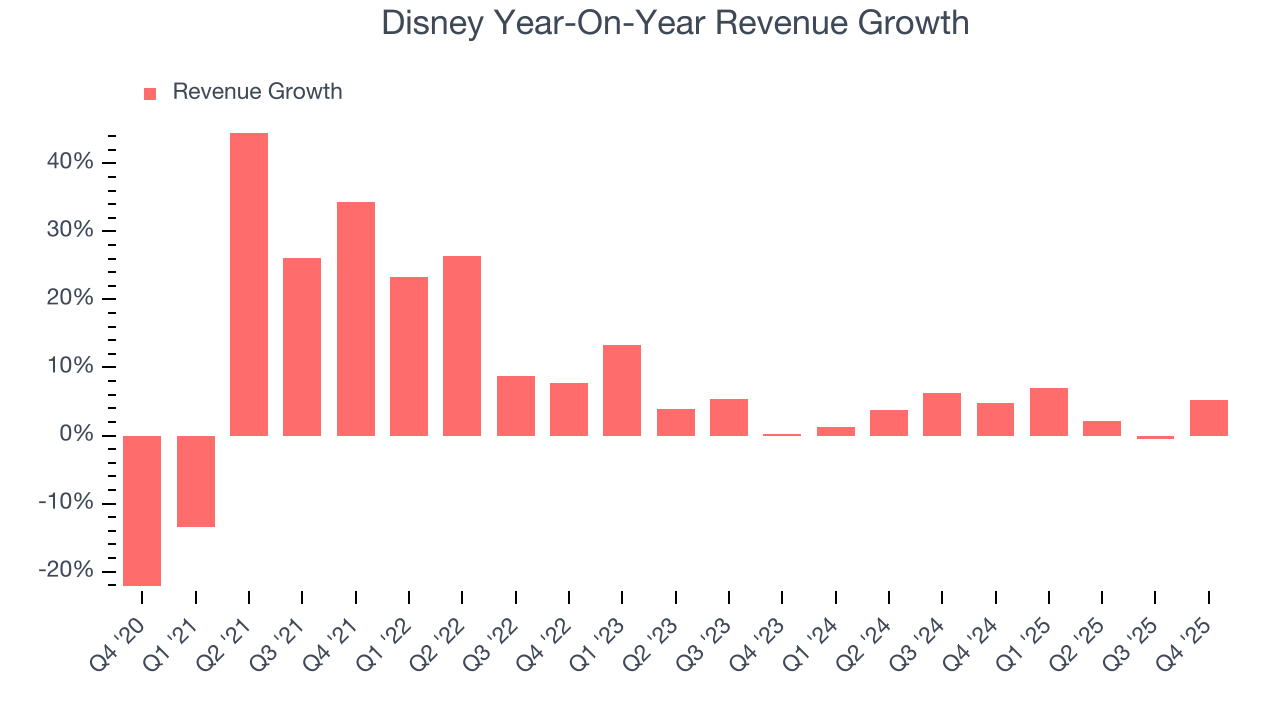
We can better understand the company’s revenue dynamics by analyzing its three most important segments: Entertainment, Sports, and Experiences, which are 44.7%, 18.9%, and 38.5% of revenue. Over the last two years, Disney’s revenues in all three segments increased. Its Entertainment revenue (movies, Disney+) averaged year-on-year growth of 4.2% while its Sports (ESPN, SEC Network) and Experiences (theme parks) revenues averaged 1.3% and 5.4%. 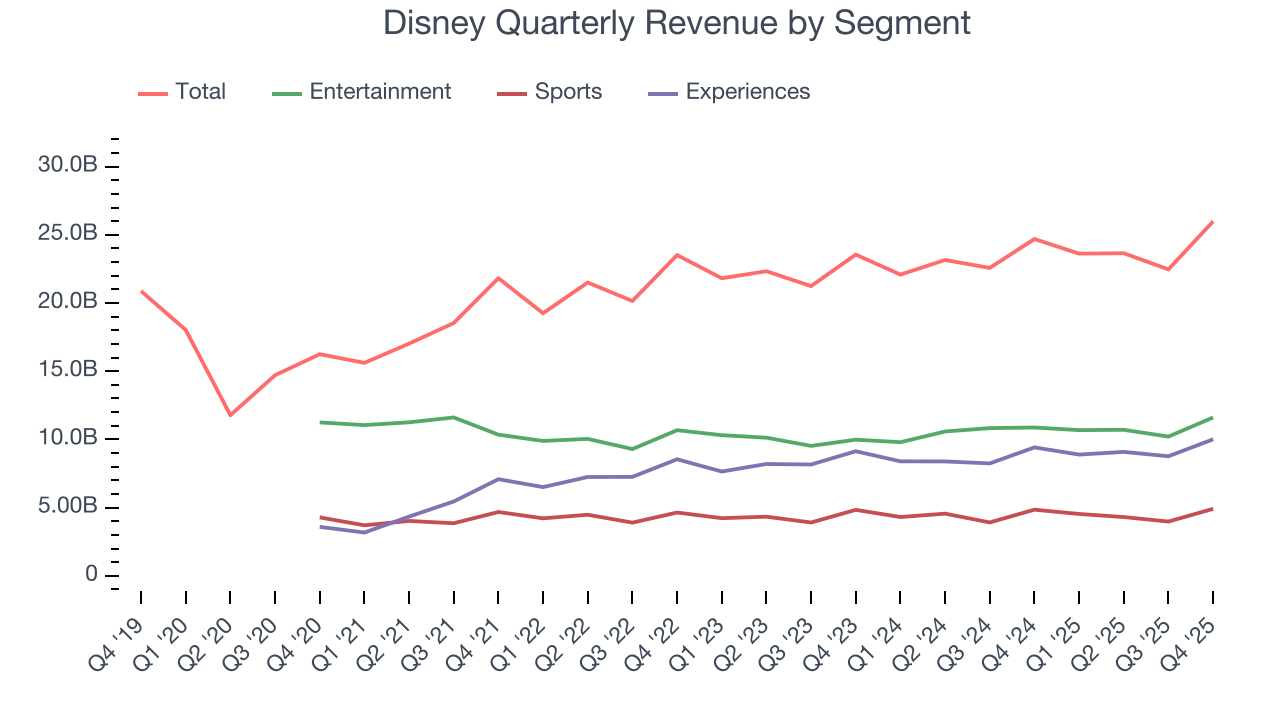
This quarter, Disney reported year-on-year revenue growth of 5.2%, and its $25.98 billion of revenue exceeded Wall Street’s estimates by 0.8%.
Looking ahead, sell-side analysts expect revenue to grow 7.1% over the next 12 months. Although this projection suggests its newer products and services will fuel better top-line performance, it is still below average for the sector.
6. Operating Margin
Disney’s operating margin might fluctuated slightly over the last 12 months but has remained more or less the same, averaging 15.1% over the last two years. This profitability was inadequate for a consumer discretionary business and caused by its suboptimal cost structure.
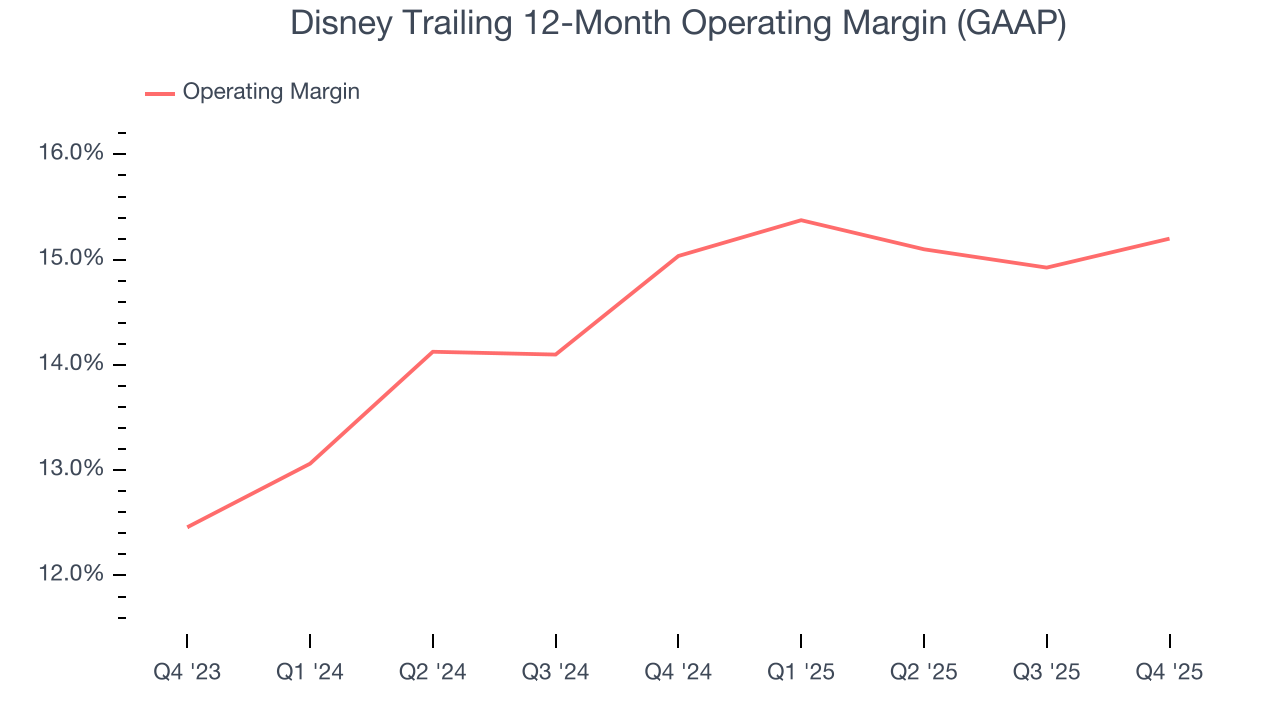
In Q4, Disney generated an operating margin profit margin of 17.7%, in line with the same quarter last year. This indicates the company’s overall cost structure has been relatively stable.
7. Earnings Per Share
Revenue trends explain a company’s historical growth, but the long-term change in earnings per share (EPS) points to the profitability of that growth – for example, a company could inflate its sales through excessive spending on advertising and promotions.
Disney’s EPS grew at a remarkable 48.6% compounded annual growth rate over the last five years, higher than its 9.5% annualized revenue growth. This tells us the company became more profitable on a per-share basis as it expanded.
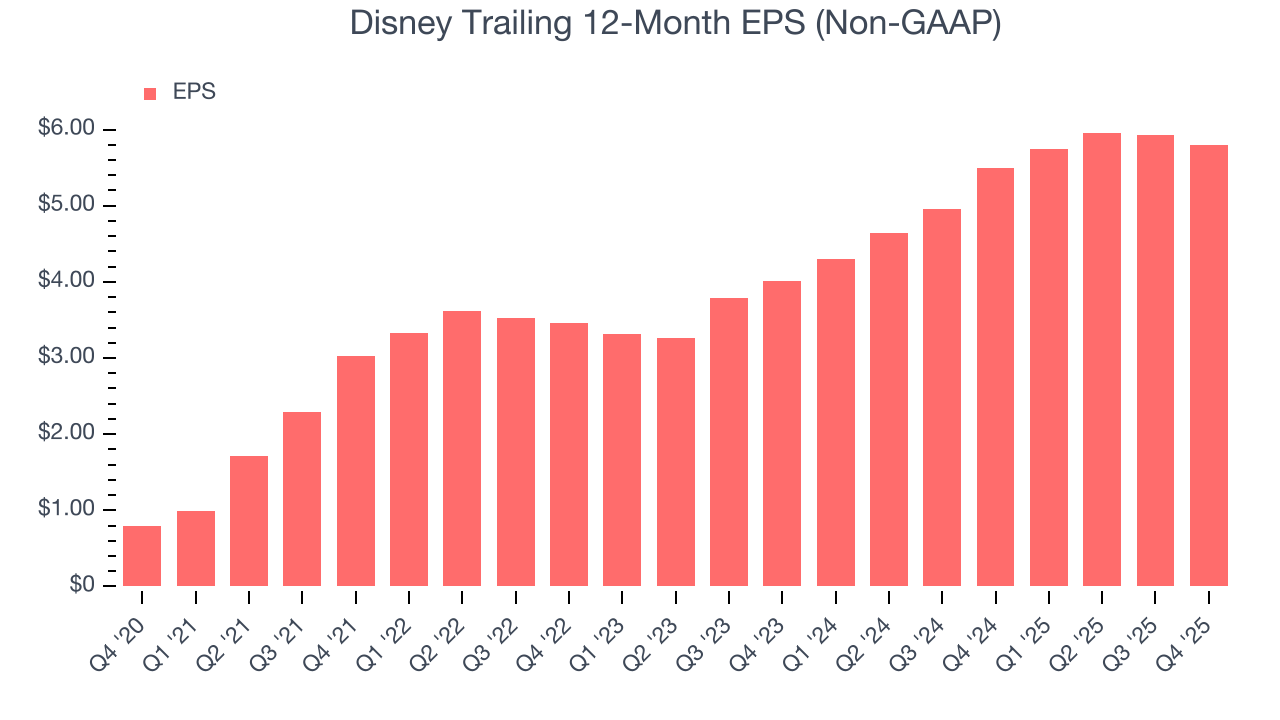
In Q4, Disney reported adjusted EPS of $1.63, down from $1.76 in the same quarter last year. Despite falling year on year, this print beat analysts’ estimates by 3.4%. Over the next 12 months, Wall Street expects Disney’s full-year EPS of $5.80 to grow 17.9%.
8. Cash Is King
Free cash flow isn't a prominently featured metric in company financials and earnings releases, but we think it's telling because it accounts for all operating and capital expenses, making it tough to manipulate. Cash is king.
Disney has shown poor cash profitability over the last two years, giving the company limited opportunities to return capital to shareholders. Its free cash flow margin averaged 8.2%, lousy for a consumer discretionary business.
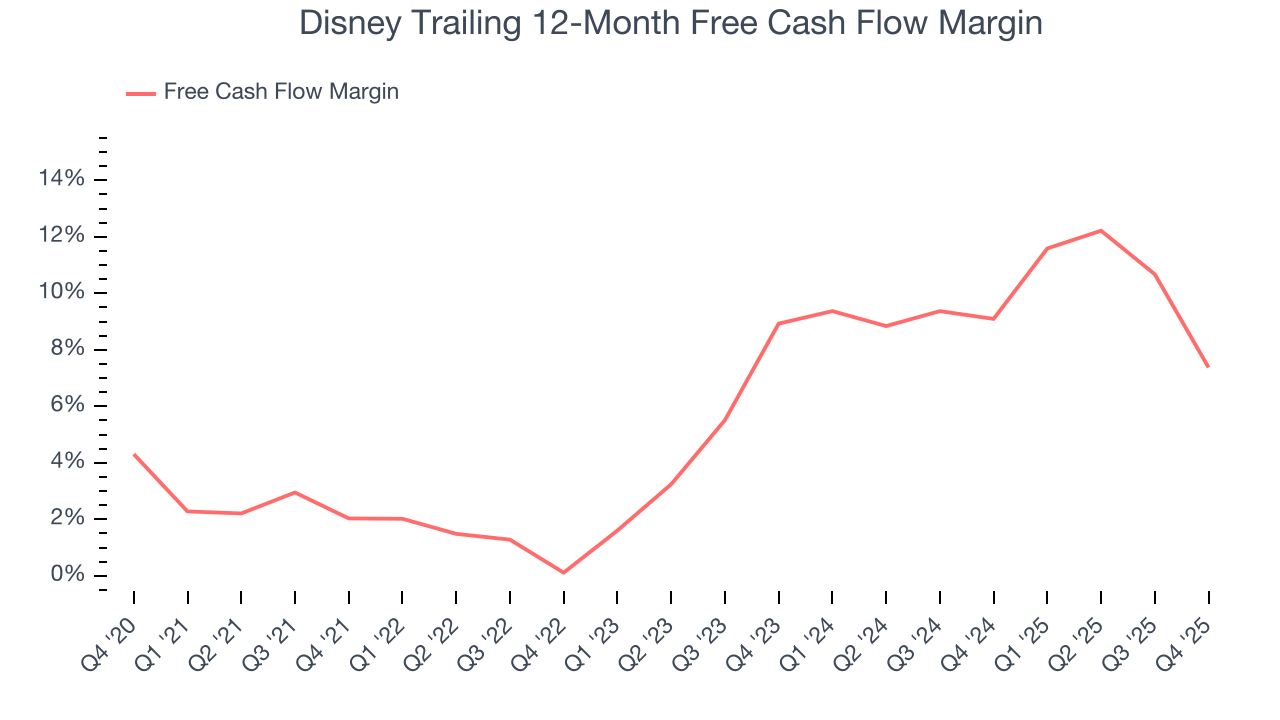
Disney burned through $2.28 billion of cash in Q4, equivalent to a negative 8.8% margin. The company’s cash flow turned negative after being positive in the same quarter last year, prompting us to pay closer attention. Short-term fluctuations typically aren’t a big deal because investment needs can be seasonal, but we’ll be watching to see if the trend extrapolates into future quarters.
Over the next year, analysts predict Disney’s cash conversion will improve. Their consensus estimates imply its free cash flow margin of 7.4% for the last 12 months will increase to 9.9%, giving it more flexibility for investments, share buybacks, and dividends.
9. Return on Invested Capital (ROIC)
EPS and free cash flow tell us whether a company was profitable while growing its revenue. But was it capital-efficient? Enter ROIC, a metric showing how much operating profit a company generates relative to the money it has raised (debt and equity).
Disney historically did a mediocre job investing in profitable growth initiatives. Its five-year average ROIC was 7.6%, somewhat low compared to the best consumer discretionary companies that consistently pump out 25%+.
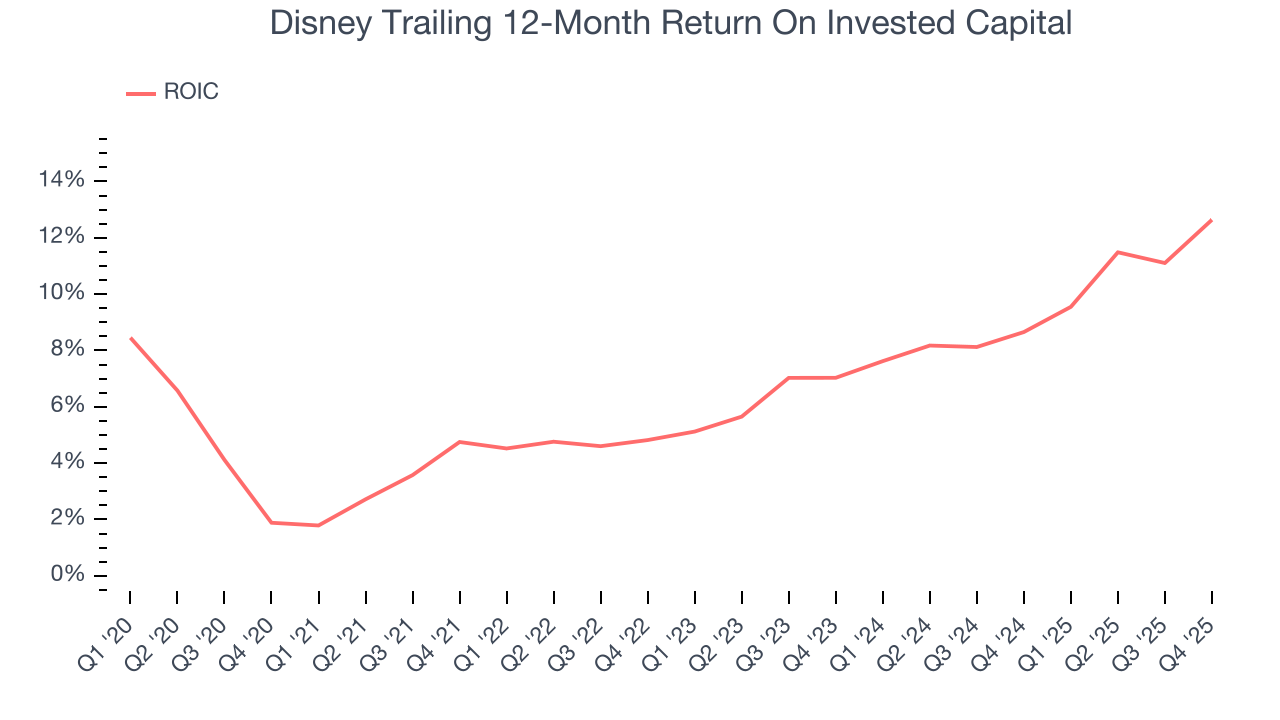
We like to invest in businesses with high returns, but the trend in a company’s ROIC is what often surprises the market and moves the stock price. Fortunately, Disney’s has increased over the last few years. This is a good sign, and we hope the company can continue improving.
10. Balance Sheet Assessment
Disney reported $5.68 billion of cash and $46.64 billion of debt on its balance sheet in the most recent quarter. As investors in high-quality companies, we primarily focus on two things: 1) that a company’s debt level isn’t too high and 2) that its interest payments are not excessively burdening the business.
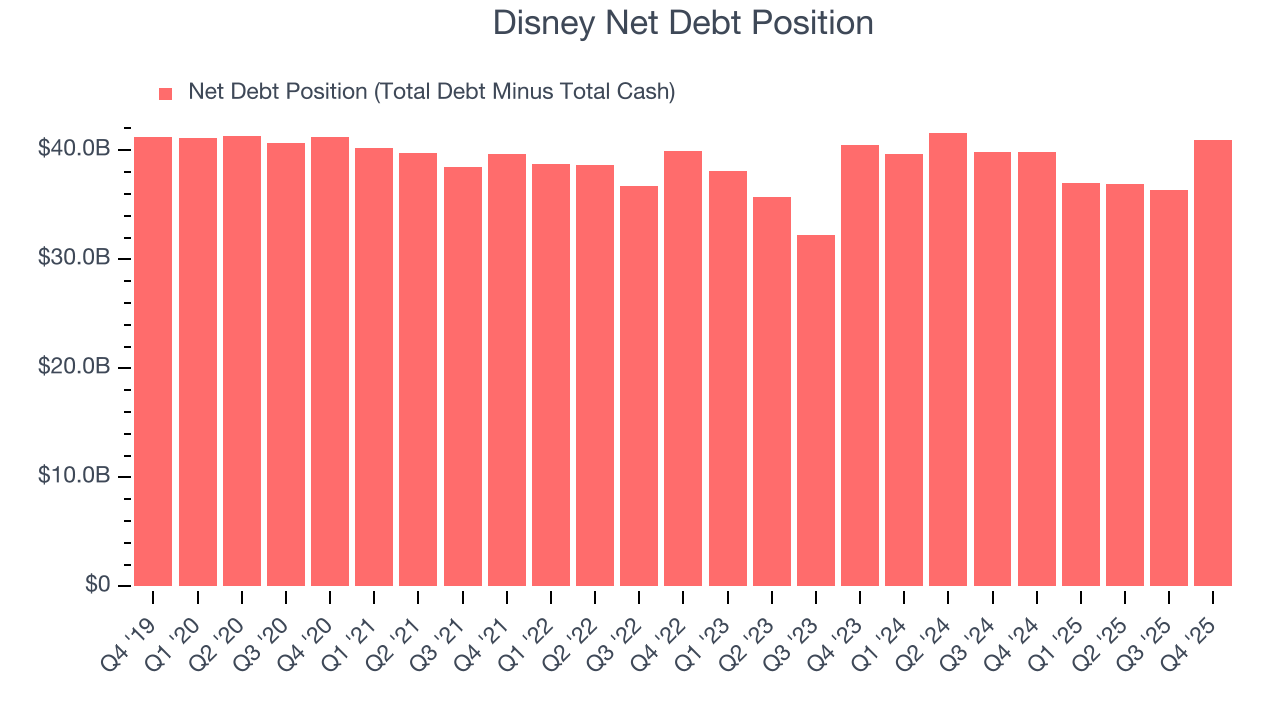
With $20.25 billion of EBITDA over the last 12 months, we view Disney’s 2.0× net-debt-to-EBITDA ratio as safe. We also see its $1.41 billion of annual interest expenses as appropriate. The company’s profits give it plenty of breathing room, allowing it to continue investing in growth initiatives.
11. Key Takeaways from Disney’s Q4 Results
We enjoyed seeing Disney beat analysts’ EBITDA expectations this quarter. We were also glad its EPS outperformed Wall Street’s estimates. On the other hand, its Sports revenue missed. Overall, we think this was a decent quarter with some key metrics above expectations. The stock traded up 3.8% to $117.08 immediately following the results.
12. Is Now The Time To Buy Disney?
Updated: February 2, 2026 at 9:42 PM EST
Before deciding whether to buy Disney or pass, we urge investors to consider business quality, valuation, and the latest quarterly results.
We see the value of companies helping consumers, but in the case of Disney, we’re out. First off, its revenue growth was weak over the last five years, and analysts expect its demand to deteriorate over the next 12 months. And while its remarkable EPS growth over the last five years shows its profits are trickling down to shareholders, the downside is its relatively low ROIC suggests management has struggled to find compelling investment opportunities. On top of that, its low free cash flow margins give it little breathing room.
Disney’s P/E ratio based on the next 12 months is 16.7x. This valuation multiple is fair, but we don’t have much confidence in the company. There are more exciting stocks to buy at the moment.
Wall Street analysts have a consensus one-year price target of $132.23 on the company (compared to the current share price of $104.86).
Although the price target is bullish, readers should exercise caution because analysts tend to be overly optimistic. The firms they work for, often big banks, have relationships with companies that extend into fundraising, M&A advisory, and other rewarding business lines. As a result, they typically hesitate to say bad things for fear they will lose out. We at StockStory do not suffer from such conflicts of interest, so we’ll always tell it like it is.