
Employers Holdings (EIG)
Employers Holdings is in for a bumpy ride. Its weak sales growth and low returns on capital show it struggled to generate demand and profits.― StockStory Analyst Team
1. News


2. Summary
Why We Think Employers Holdings Will Underperform
With roots in Nevada and a strong concentration in California where 45% of its premiums are generated, Employers Holdings (NYSE:EIG) is a specialty provider of workers' compensation insurance focused on small and select businesses engaged in low-to-medium hazard industries across the United States.
- Incremental sales over the last five years were much less profitable as its earnings per share fell by 21.9% annually while its revenue grew
- Day-to-day expenses have swelled relative to revenue over the last five years as its combined ratio increased by 22.6 percentage points
- Costs have risen faster than its revenue over the last two years, causing its combined ratio to worsen by 15.8 percentage points


Employers Holdings’s quality is inadequate. We see more lucrative opportunities elsewhere.
Why There Are Better Opportunities Than Employers Holdings


Employers Holdings’s stock price of $42.12 implies a valuation ratio of 0.8x forward P/B. This multiple is cheaper than most insurance peers, but we think this is justified.
It’s better to pay up for high-quality businesses with higher long-term earnings potential rather than to buy lower-quality stocks because they appear cheap. These challenged businesses often don’t re-rate, a phenomenon known as a “value trap”.
3. Employers Holdings (EIG) Research Report: Q4 CY2025 Update
Workers' compensation insurer Employers Holdings (NYSE:EIG) fell short of the market’s revenue expectations in Q4 CY2025, with sales falling 21.3% year on year to $170.5 million. Its non-GAAP profit of $0.66 per share was 32% above analysts’ consensus estimates.
Employers Holdings (EIG) Q4 CY2025 Highlights:
- Net Premiums Earned: $188.5 million vs analyst estimates of $190.2 million (flat year on year, 0.9% miss)
- Revenue: $170.5 million vs analyst estimates of $218.4 million (21.3% year-on-year decline, 21.9% miss)
- Combined Ratio: 106% vs analyst estimates of 107% (130 basis point beat)
- Adjusted EPS: $0.66 vs analyst estimates of $0.50 (32% beat)
- Book Value per Share: $46.98 (8% year-on-year growth)
- Market Capitalization: $947.7 million
Company Overview
With roots in Nevada and a strong concentration in California where 45% of its premiums are generated, Employers Holdings (NYSE:EIG) is a specialty provider of workers' compensation insurance focused on small and select businesses engaged in low-to-medium hazard industries across the United States.
The company operates through multiple insurance subsidiaries, providing coverage that pays for medical expenses and wage replacement when employees are injured on the job. For instance, if a restaurant employee slips in the kitchen and breaks an arm, Employers' policy would cover their medical treatment and partial wages during recovery.
Employers Holdings markets its products primarily through a network of approximately 2,500 traditional insurance agencies, which generate about two-thirds of its business. The company has also developed alternative distribution channels, including partnerships with payroll companies like ADP (which accounts for over 16% of premiums), digital marketplaces, and a direct-to-customer platform under its Cerity brand that caters to smaller businesses preferring online transactions.
The company differentiates itself through disciplined underwriting practices, using automated systems and experienced underwriters with local market knowledge to assess risks. Its claims management approach includes an outcome-based medical network that uses predictive analytics to identify superior healthcare providers, a pharmacy benefit management program, and an Injured Employee Hotline staffed by nurses. These services aim to reduce claims costs and help injured workers return to work faster.
Employers Holdings generates revenue by collecting premiums from policyholders, with rates based on factors including the type of business, payroll size, and the policyholder's claims history. The company operates throughout the United States, except in four states served exclusively by state funds.
4. Property & Casualty Insurance
Property & Casualty (P&C) insurers protect individuals and businesses against financial loss from damage to property or from legal liability. This is a cyclical industry, and the sector benefits when there is 'hard market', characterized by strong premium rate increases that outpace loss and cost inflation, resulting in robust underwriting margins. The opposite is true in a 'soft market'. Interest rates also matter, as they determine the yields earned on fixed-income portfolios. On the other hand, P&C insurers face a major secular headwind from the increasing frequency and severity of catastrophe losses due to climate change. Furthermore, the liability side of the business is pressured by 'social inflation'—the trend of rising litigation costs and larger jury awards.
Employers Holdings competes with other workers' compensation specialists like Amerisafe (NASDAQ:AMSF) and ICW Group, as well as larger commercial insurers that offer workers' compensation among broader product lines, including The Hartford (NYSE:HIG), Travelers (NYSE:TRV), and Liberty Mutual.
5. Revenue Growth
Big picture, insurers generate revenue from three key sources. The first is the core business of underwriting policies. The second source is income from investing the “float” (premiums collected upfront not yet paid out as claims) in assets such as fixed-income assets and equities. The third is fees from various sources such as policy administration, annuities, or other value-added services. Unfortunately, Employers Holdings’s 3.8% annualized revenue growth over the last five years was sluggish. This was below our standard for the insurance sector and is a tough starting point for our analysis.
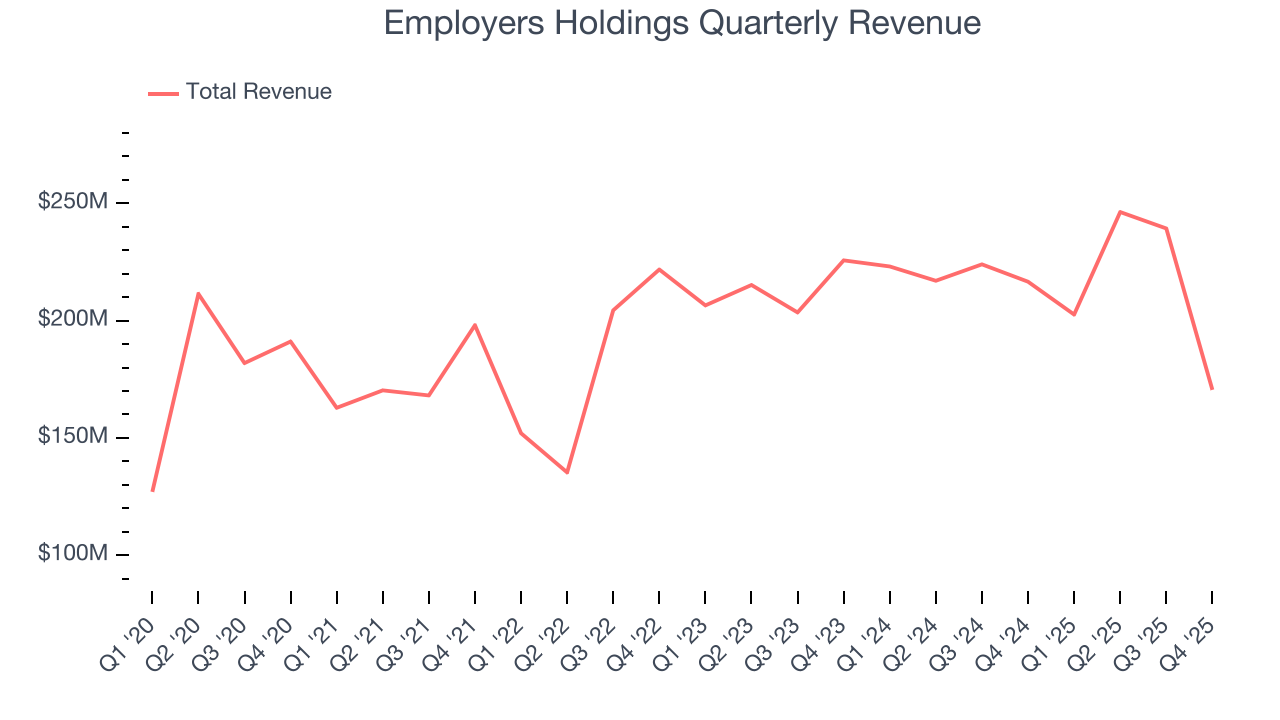
Long-term growth is the most important, but within financials, a half-decade historical view may miss recent interest rate changes and market returns. Employers Holdings’s recent performance shows its demand has slowed as its revenue was flat over the last two years. 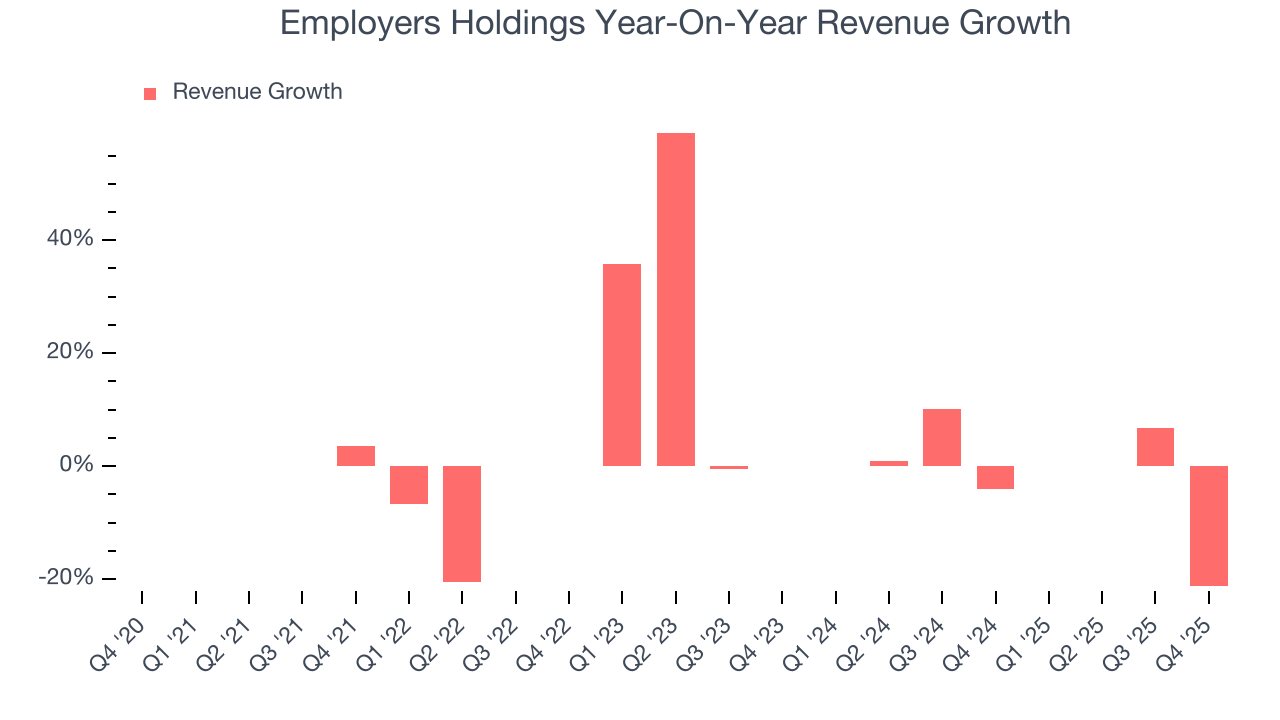 Note: Quarters not shown were determined to be outliers, impacted by outsized investment gains/losses that are not indicative of the recurring fundamentals of the business.
This quarter, Employers Holdings missed Wall Street’s estimates and reported a rather uninspiring 21.3% year-on-year revenue decline, generating $170.5 million of revenue.
Net premiums earned made up 87% of the company’s total revenue during the last five years, meaning Employers Holdings barely relies on non-insurance activities to drive its overall growth.
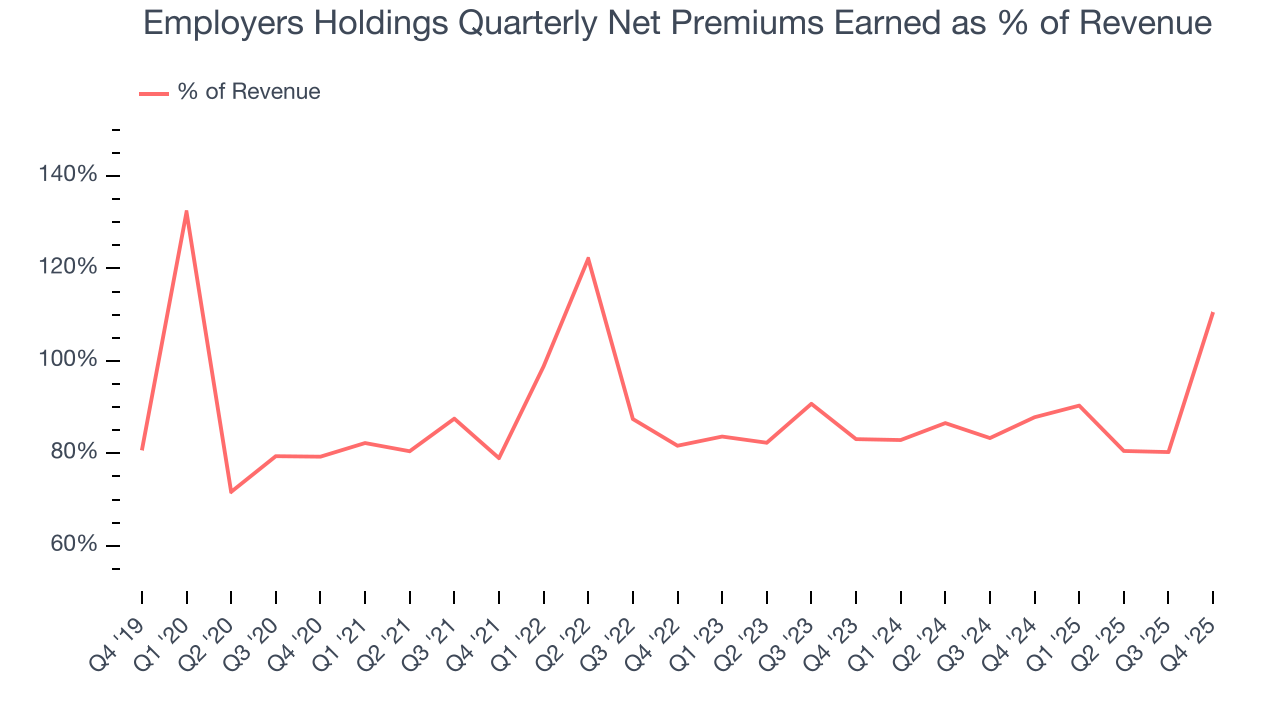
While insurers generate revenue from multiple sources, investors view net premiums earned as the cornerstone - its direct link to core operations stands in sharp contrast to the unpredictability of investment returns and fees.
6. Net Premiums Earned
When insurers sell policies, they protect themselves from extremely large losses or an outsized accumulation of losses with reinsurance (insurance for insurance companies). Net premiums earned are:
- Gross premiums - what’s ceded to reinsurers as a risk mitigation and transfer strategy
Employers Holdings’s net premiums earned has grown at a 4.4% annualized rate over the last five years, worse than the broader insurance industry and in line with its total revenue.
When analyzing Employers Holdings’s net premiums earned over the last two years, we can see that growth decelerated to 2.7% annually. Since two-year net premiums earned grew faster than total revenue over this period, it's implied that other line items such as investment income grew at a slower rate. While these additional streams certainly contribute to the bottom line, their impact can vary. Some firms have shown greater success and long-term consistency in investing their float compared to peers. However, sharp fluctuations in the fixed income and equity markets can significantly affect short-term performance.
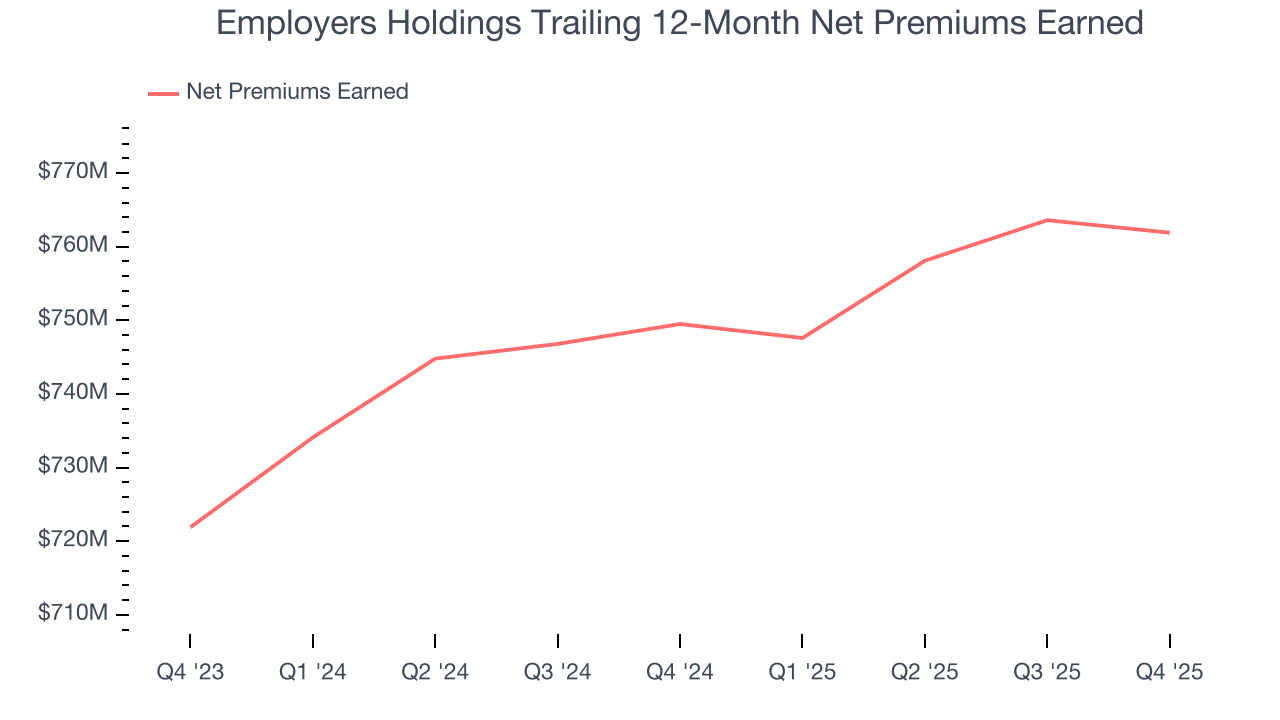
This quarter, Employers Holdings’s net premiums earned was $188.5 million, flat year on year. But this was still enough to meet Wall Street Consensus estimates.
7. Combined Ratio
Revenue growth is one major determinant of business quality, and the efficiency of operations is another. For insurance companies, we look at the combined ratio rather than the operating expenses and margins that define sectors such as consumer, tech, and industrials.
The combined ratio sums the costs of underwriting (salaries, commissions, overhead) as well as what an insurer pays out in claims (losses) and divides it by net premiums earned. If a company boasts a combined ratio under 100%, it is underwriting profitably. If above 100%, it is losing money on its core operations of selling insurance policies.
Given the calculation, a lower expense ratio is better. Over the last five years, Employers Holdings’s combined ratio has increased by 22.6 percentage points, going from 96% to 111%. It has also worsened by 15.8 percentage points on a two-year basis, showing its expenses have consistently increased at a faster rate than revenue. This usually raises questions unless the company is in high-growth mode and reinvesting its profits into attractive ventures.
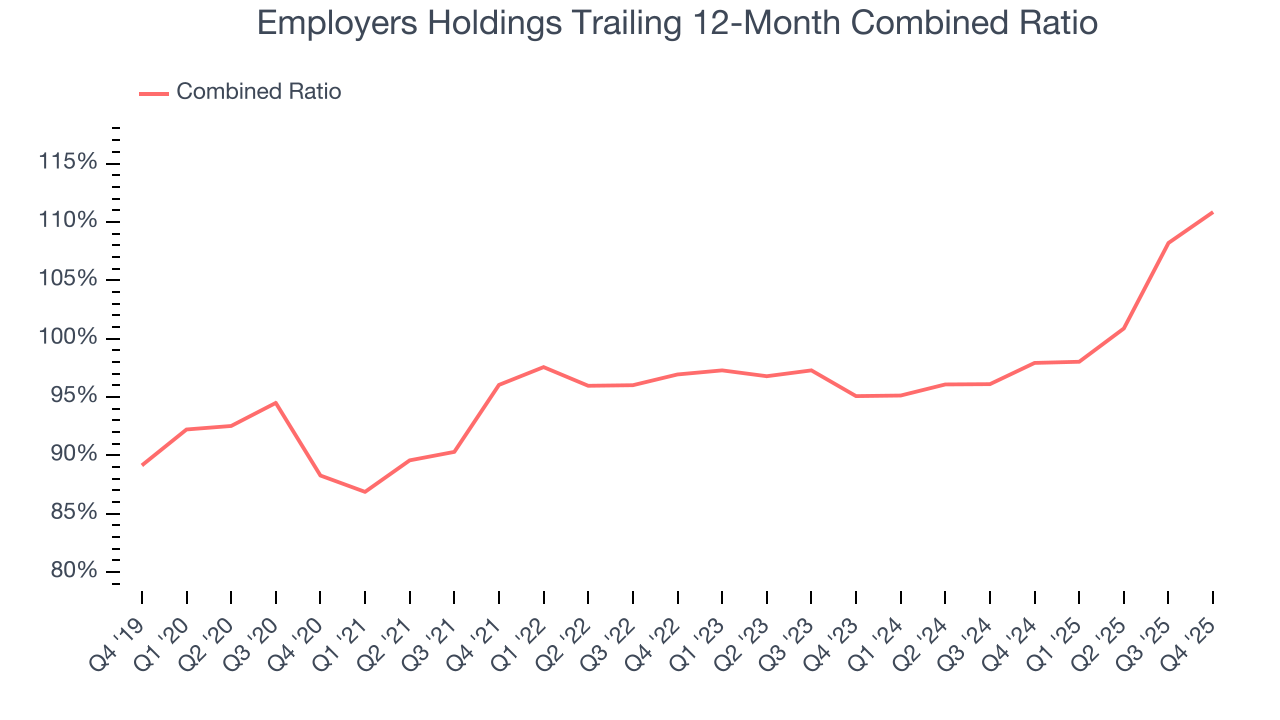
Employers Holdings’s combined ratio came in at 106% this quarter, beating analysts’ expectations by 130 basis points (100 basis points = 1 percentage point). This result was 10.6 percentage points worse than the same quarter last year.
8. Earnings Per Share
We track the long-term change in earnings per share (EPS) for the same reason as long-term revenue growth. Compared to revenue, however, EPS highlights whether a company’s growth is profitable.
Sadly for Employers Holdings, its EPS declined by 21.9% annually over the last five years while its revenue grew by 3.8%. We can see the difference stemmed from higher interest expenses or taxes as the company actually improved its combined ratio and repurchased its shares during this time.
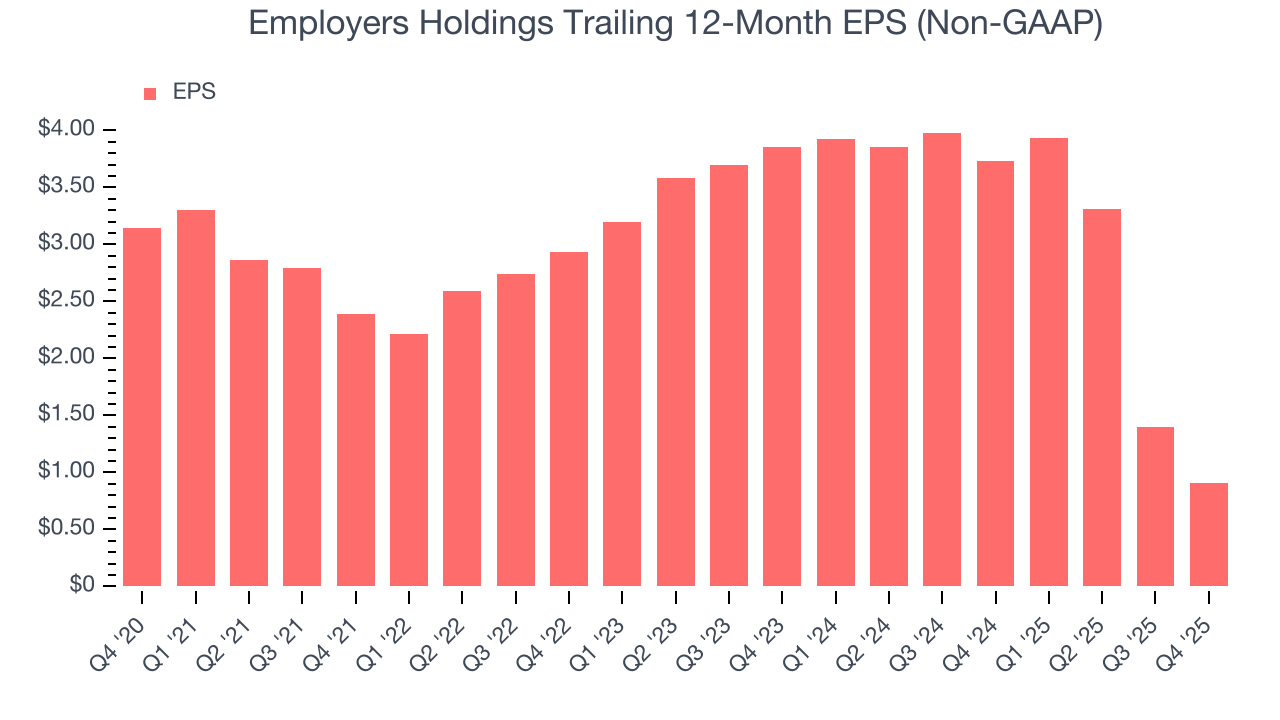
Like with revenue, we analyze EPS over a more recent period because it can provide insight into an emerging theme or development for the business.
For Employers Holdings, its two-year annual EPS declines of 51.4% show it’s continued to underperform. These results were bad no matter how you slice the data.
In Q4, Employers Holdings reported adjusted EPS of $0.66, down from $1.15 in the same quarter last year. Despite falling year on year, this print easily cleared analysts’ estimates. Over the next 12 months, Wall Street expects Employers Holdings’s full-year EPS of $0.91 to grow 86.8%.
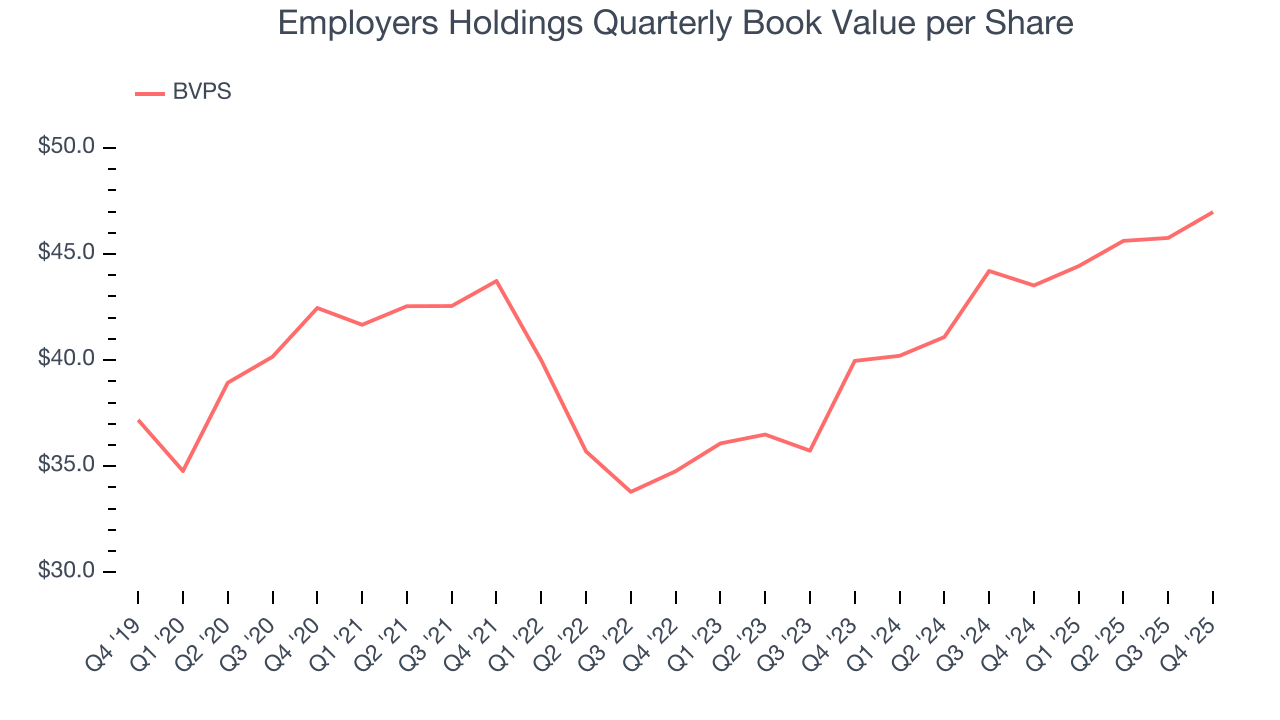
9. Book Value Per Share (BVPS)
Insurers are balance sheet businesses, collecting premiums upfront and paying out claims over time. Premiums collected but not yet paid out, often referred to as the float, are invested and create an asset base supported by a liability structure. Book value per share (BVPS) captures this dynamic by measuring these assets (investment portfolio, cash, reinsurance recoverables) less liabilities (claim reserves, debt, future policy benefits). BVPS is essentially the residual value for shareholders.
We therefore consider BVPS very important to track for insurers and a metric that sheds light on business quality because it reflects long-term capital growth and is harder to manipulate than more commonly-used metrics like EPS.
Employers Holdings’s BVPS grew at a sluggish 2% annual clip over the last five years. However, BVPS growth has accelerated recently, growing by 8.4% annually over the last two years from $39.96 to $46.98 per share.
10. Balance Sheet Assessment
The debt-to-equity ratio is a widely used measure to assess a company's balance sheet health. A higher ratio means that a business aggressively financed its growth with debt. This can result in higher earnings (if the borrowed funds are invested profitably) but also increases risk.
If debt levels are too high, there could be difficulties in meeting obligations, especially during economic downturns or periods of rising interest rates if the debt has variable-rate payments.
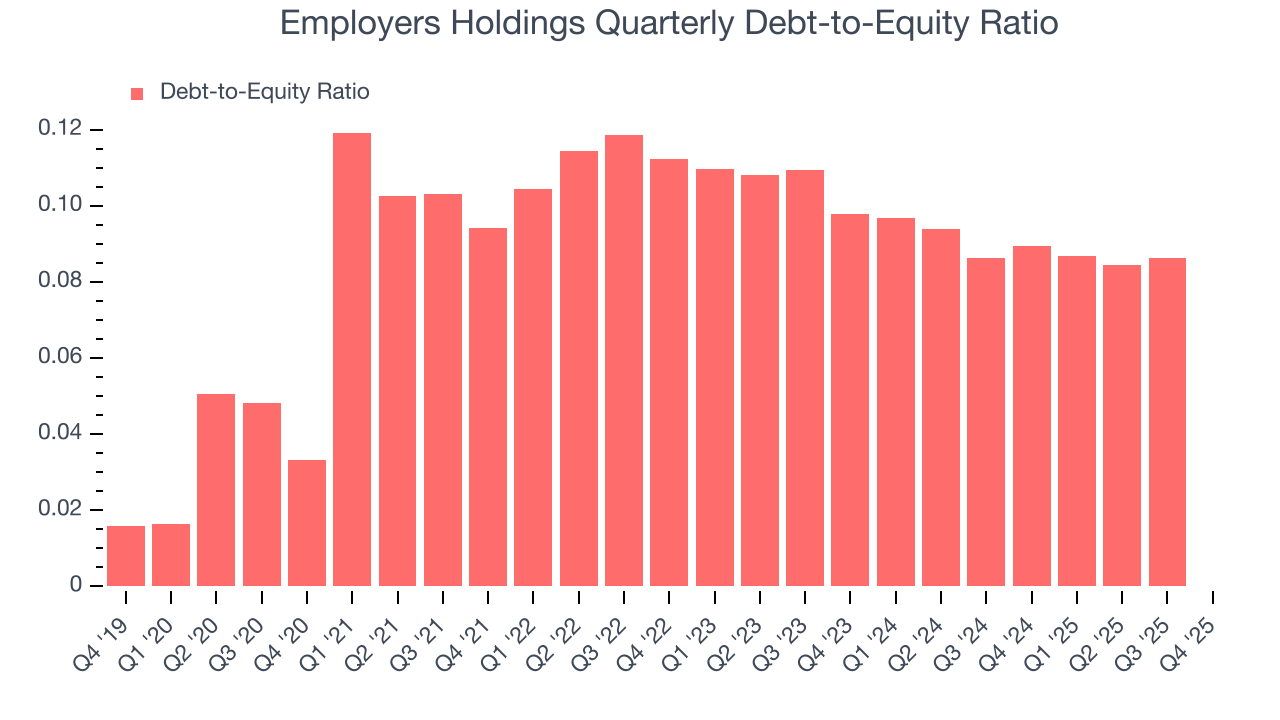
Employers Holdings currently has $35,000 of debt and $955.7 million of shareholder's equity on its balance sheet, and over the past four quarters, has averaged a debt-to-equity ratio of 0.1×. We think this is safe and raises no red flags. In general, we’re comfortable with any ratio below 1.0× for an insurance business. Anything below 0.5× is a bonus.
11. Return on Equity
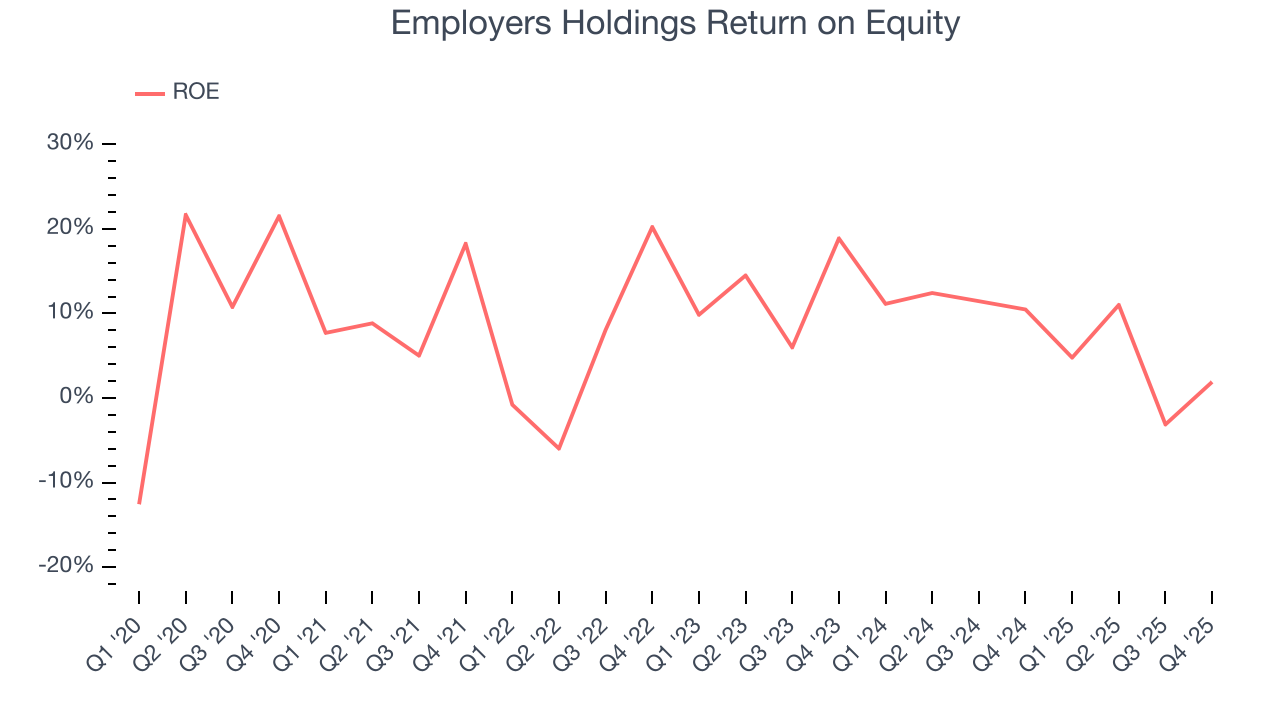
Return on equity, or ROE, represents the ultimate measure of an insurer's effectiveness, quantifying how well it transforms shareholder investments into profits. Over the long term, insurance companies with robust ROE metrics typically deliver superior shareholder returns through a balanced approach to capital management.
Over the last five years, Employers Holdings has averaged an ROE of 8.5%, uninspiring for a company operating in a sector where the average shakes out around 12.5%.
12. Key Takeaways from Employers Holdings’s Q4 Results
It was good to see Employers Holdings beat analysts’ EPS expectations this quarter. On the other hand, its revenue missed and its net premiums earned fell slightly short of Wall Street’s estimates. Overall, this print was mixed but still had some key positives. The stock remained flat at $42.58 immediately following the results.
13. Is Now The Time To Buy Employers Holdings?
Updated: February 19, 2026 at 11:39 PM EST
A common mistake we notice when investors are deciding whether to buy a stock or not is that they simply look at the latest earnings results. Business quality and valuation matter more, so we urge you to understand these dynamics as well.
We see the value of companies helping consumers, but in the case of Employers Holdings, we’re out. To begin with, its revenue growth was uninspiring over the last five years, and analysts expect its demand to deteriorate over the next 12 months. While its projected EPS for the next year implies the company’s fundamentals will improve, the downside is its declining EPS over the last five years makes it a less attractive asset to the public markets. On top of that, its worsening combined ratio shows the business has become less productive.
Employers Holdings’s P/B ratio based on the next 12 months is 0.8x. This valuation tells us it’s a bit of a market darling with a lot of good news priced in - you can find more timely opportunities elsewhere.
Wall Street analysts have a consensus one-year price target of $49 on the company (compared to the current share price of $42.12).
Although the price target is bullish, readers should exercise caution because analysts tend to be overly optimistic. The firms they work for, often big banks, have relationships with companies that extend into fundraising, M&A advisory, and other rewarding business lines. As a result, they typically hesitate to say bad things for fear they will lose out. We at StockStory do not suffer from such conflicts of interest, so we’ll always tell it like it is.