
Energizer (ENR)
Energizer is in for a bumpy ride. Its low returns on capital and plummeting sales suggest it struggles to generate demand and profits, a red flag.― StockStory Analyst Team
1. News


2. Summary
Why We Think Energizer Will Underperform
Masterminds behind the viral Energizer Bunny mascot, Energizer (NYSE:ENR) is one of the world's largest manufacturers of batteries.
- Products have few die-hard fans as sales have declined by 1.1% annually over the last three years
- Absence of organic revenue growth over the past two years suggests it may have to lean into acquisitions to drive its expansion
- 5× net-debt-to-EBITDA ratio makes lenders less willing to extend additional capital, potentially necessitating dilutive equity offerings


Energizer’s quality doesn’t meet our expectations. There are superior stocks for sale in the market.
Why There Are Better Opportunities Than Energizer


Energizer’s stock price of $23.50 implies a valuation ratio of 6.8x forward P/E. This certainly seems like a cheap stock, but we think there are valid reasons why it trades this way.
It’s better to pay up for high-quality businesses with higher long-term earnings potential rather than to buy lower-quality stocks because they appear cheap. These challenged businesses often don’t re-rate, a phenomenon known as a “value trap”.
3. Energizer (ENR) Research Report: Q4 CY2025 Update
Battery and lighting company Energizer (NYSE:ENR) reported Q4 CY2025 results beating Wall Street’s revenue expectations, with sales up 6.5% year on year to $778.9 million. Its non-GAAP profit of $0.31 per share was 19.1% above analysts’ consensus estimates.
Energizer (ENR) Q4 CY2025 Highlights:
- Revenue: $778.9 million vs analyst estimates of $707.9 million (6.5% year-on-year growth, 10% beat)
- Adjusted EPS: $0.31 vs analyst estimates of $0.26 (19.1% beat)
- Adjusted EBITDA: $106.9 million vs analyst estimates of $100.2 million (13.7% margin, 6.7% beat)
- Management reiterated its full-year Adjusted EPS guidance of $3.45 at the midpoint
- EBITDA guidance for the full year is $595 million at the midpoint, in line with analyst expectations
- Operating Margin: -0.6%, down from 8.5% in the same quarter last year
- Free Cash Flow Margin: 15.9%, up from 5.8% in the same quarter last year
- Organic Revenue fell 4.3% year on year (beat)
- Market Capitalization: $1.6 billion
Company Overview
Masterminds behind the viral Energizer Bunny mascot, Energizer (NYSE:ENR) is one of the world's largest manufacturers of batteries.
The company’s roots can be traced to 1896 when American inventor Conrad Hubert patented the first flashlight, which utilized a dry cell battery. Over the next century, Hubert’s company would undergo a series of mergers. The Energizer we know today was born when it spun off from its parent company, Ralston Purina, in 2000, allowing it to focus exclusively on its battery and lighting businesses.
Energizer manufactures a wide range of batteries, including alkaline, lithium, rechargeable, and specialty batteries, that power devices in homes, workplaces, and on the go, from remote controls and flashlights to portable electronics and medical devices. Its brands, including Energizer and Eveready, are some of the most recognized globally thanks to their longevity, reliability, and consistent performance.
Beyond batteries, Energizer excels in providing high-quality lighting solutions. Their product lineup encompasses LED flashlights, lanterns, headlamps, and area lighting. These solutions offer brightness, durability, and energy efficiency, catering to outdoor enthusiasts and everyday illumination needs.
Energizer's products are distributed and enjoyed by consumers across the globe. It engages with customers through various channels, including retail partnerships and e-commerce platforms, and places a strong emphasis on eco-friendly options that contribute to reducing waste and conserving resources.
4. Household Products
Household products stocks are generally stable investments, as many of the industry's products are essential for a comfortable and functional living space. Recently, there's been a growing emphasis on eco-friendly and sustainable offerings, reflecting the evolving consumer preferences for environmentally conscious options. These trends can be double-edged swords that benefit companies who innovate quickly to take advantage of them and hurt companies that don't invest enough to meet consumers where they want to be with regards to trends.
Competitors in the battery and lighting industry include AmazonBasics (owned by Amazon, NASDAQ:AMZN), Duracell (owned by Proctor & Gamble, NYSE:PG), Panasonic (TSE:6752), and Sony (NYSE:SONY).
5. Revenue Growth
Examining a company’s long-term performance can provide clues about its quality. Any business can experience short-term success, but top-performing ones enjoy sustained growth for years.
With $3 billion in revenue over the past 12 months, Energizer carries some recognizable products but is a mid-sized consumer staples company. Its size could bring disadvantages compared to larger competitors benefiting from better brand awareness and economies of scale.
As you can see below, Energizer struggled to increase demand as its $3 billion of sales for the trailing 12 months was close to its revenue three years ago. This shows demand was soft, a rough starting point for our analysis.
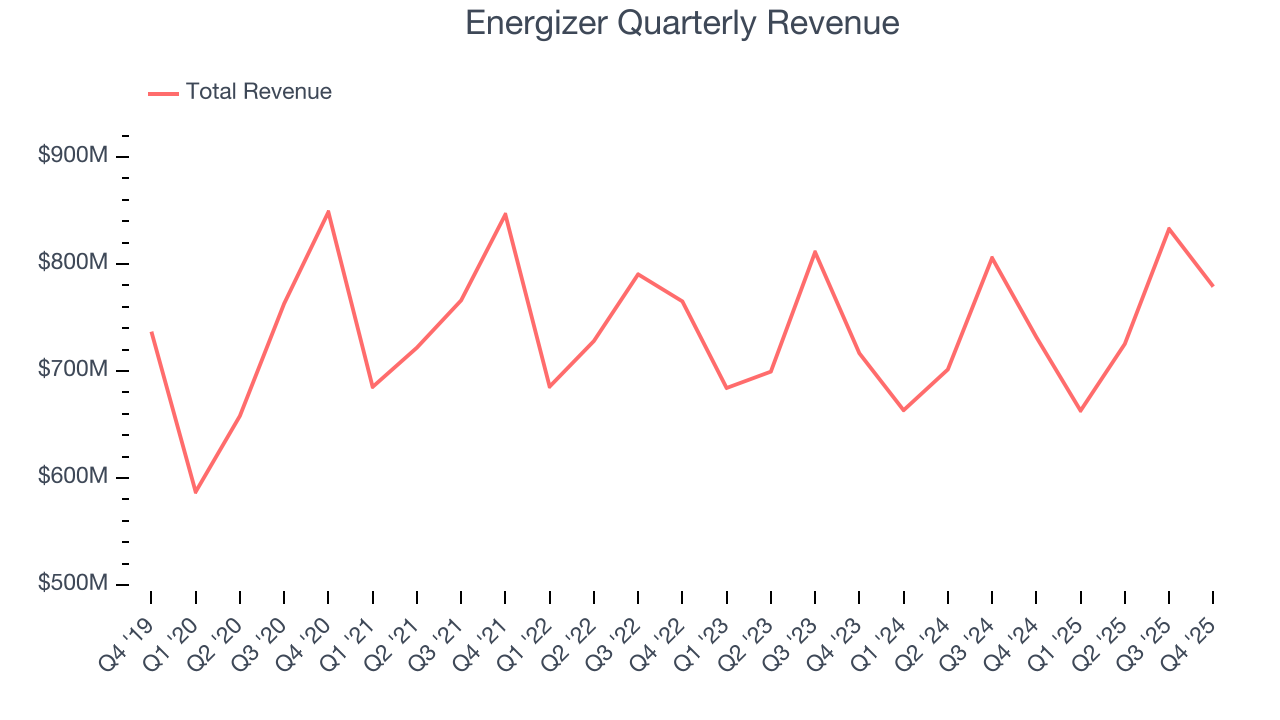
This quarter, Energizer reported year-on-year revenue growth of 6.5%, and its $778.9 million of revenue exceeded Wall Street’s estimates by 10%.
Looking ahead, sell-side analysts expect revenue to remain flat over the next 12 months. This projection is underwhelming and implies its newer products will not accelerate its top-line performance yet.
6. Organic Revenue Growth
When analyzing revenue growth, we care most about organic revenue growth. This metric captures a business’s performance excluding one-time events such as mergers, acquisitions, and divestitures as well as foreign currency fluctuations.
The demand for Energizer’s products has barely risen over the last eight quarters. On average, the company’s organic sales have been flat. 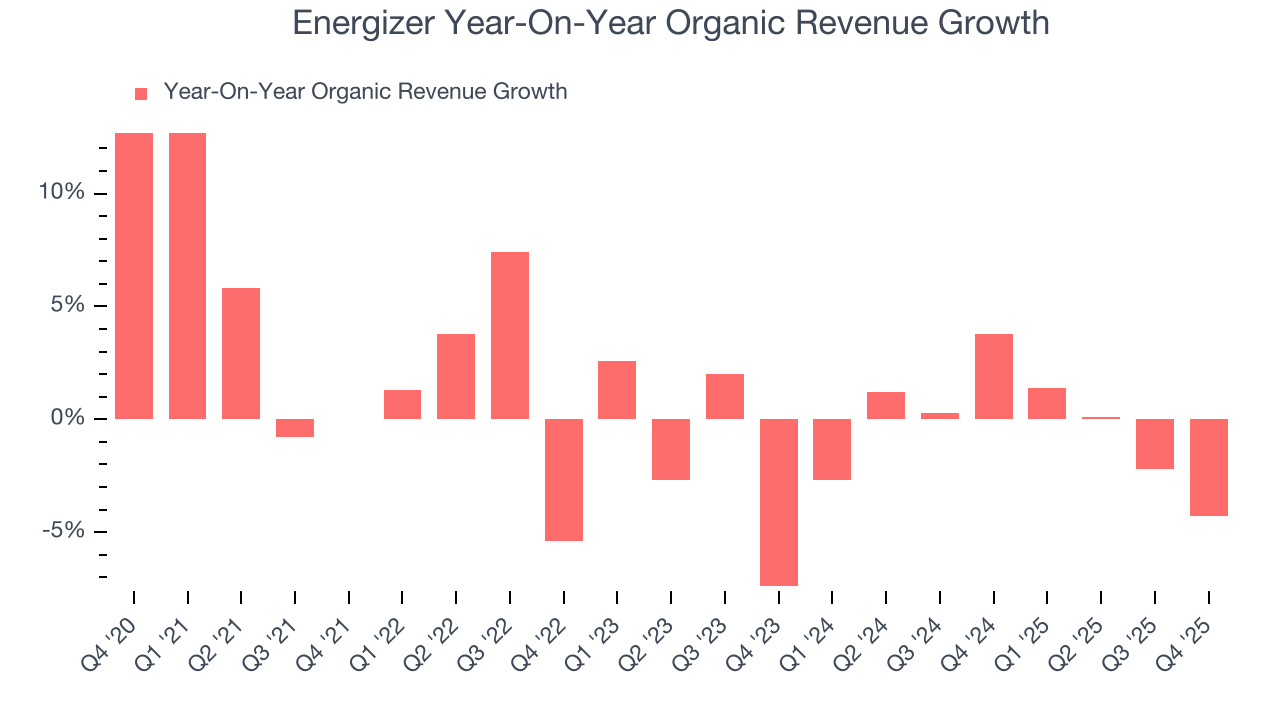
In the latest quarter, Energizer’s organic sales fell by 4.3% year on year. This decrease represents a further deceleration from its historical levels. We hope the business can get back on track.
7. Gross Margin & Pricing Power
Energizer has good unit economics for a consumer staples company, giving it the opportunity to invest in areas such as marketing and talent to stay competitive. As you can see below, it averaged an impressive 41.1% gross margin over the last two years. That means for every $100 in revenue, $58.90 went towards paying for raw materials, production of goods, transportation, and distribution. 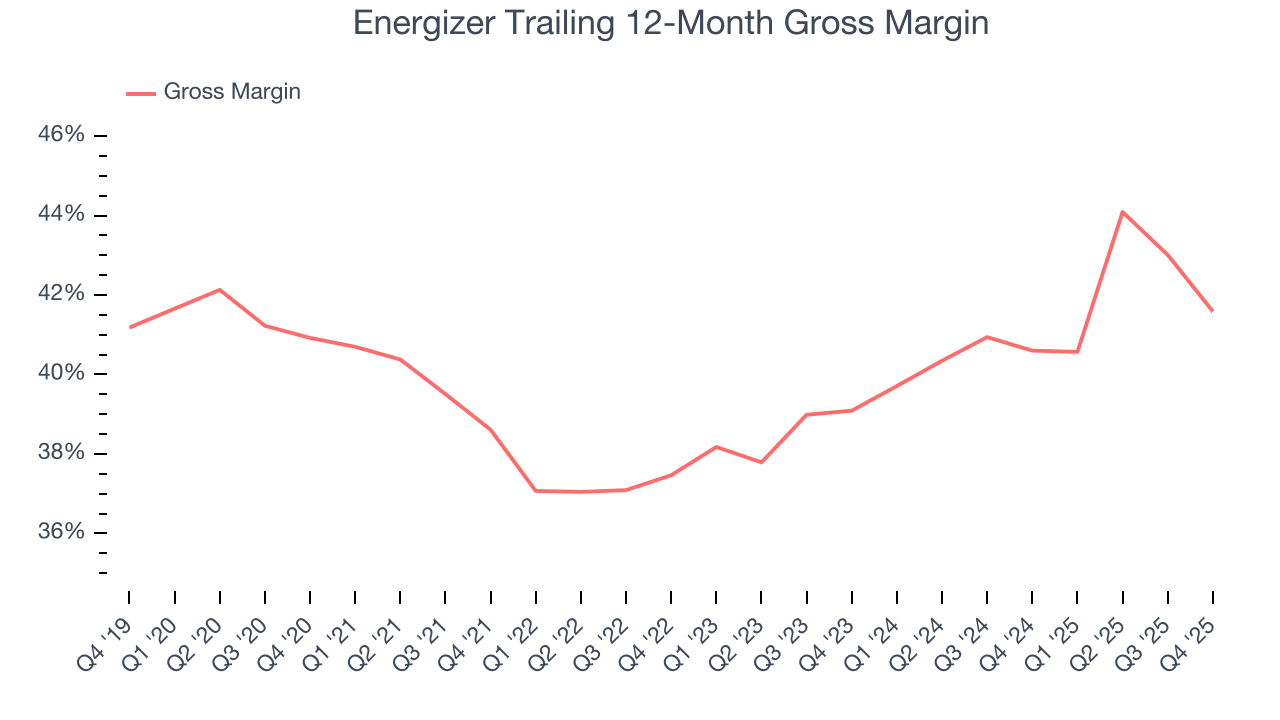
This quarter, Energizer’s gross profit margin was 32.9%, marking a 5.2 percentage point decrease from 38.1% in the same quarter last year. On a wider time horizon, the company’s full-year margin has remained steady over the past four quarters, suggesting its input costs (such as raw materials and manufacturing expenses) have been stable and it isn’t under pressure to lower prices.
8. Operating Margin
Operating margin is a key profitability metric because it accounts for all expenses enabling a business to operate smoothly, including marketing and advertising, IT systems, wages, and other administrative costs.
Energizer has managed its cost base well over the last two years. It demonstrated solid profitability for a consumer staples business, producing an average operating margin of 12.3%. This result isn’t too surprising as its gross margin gives it a favorable starting point.
Analyzing the trend in its profitability, Energizer’s operating margin rose by 1.4 percentage points over the last year, showing its efficiency has improved.
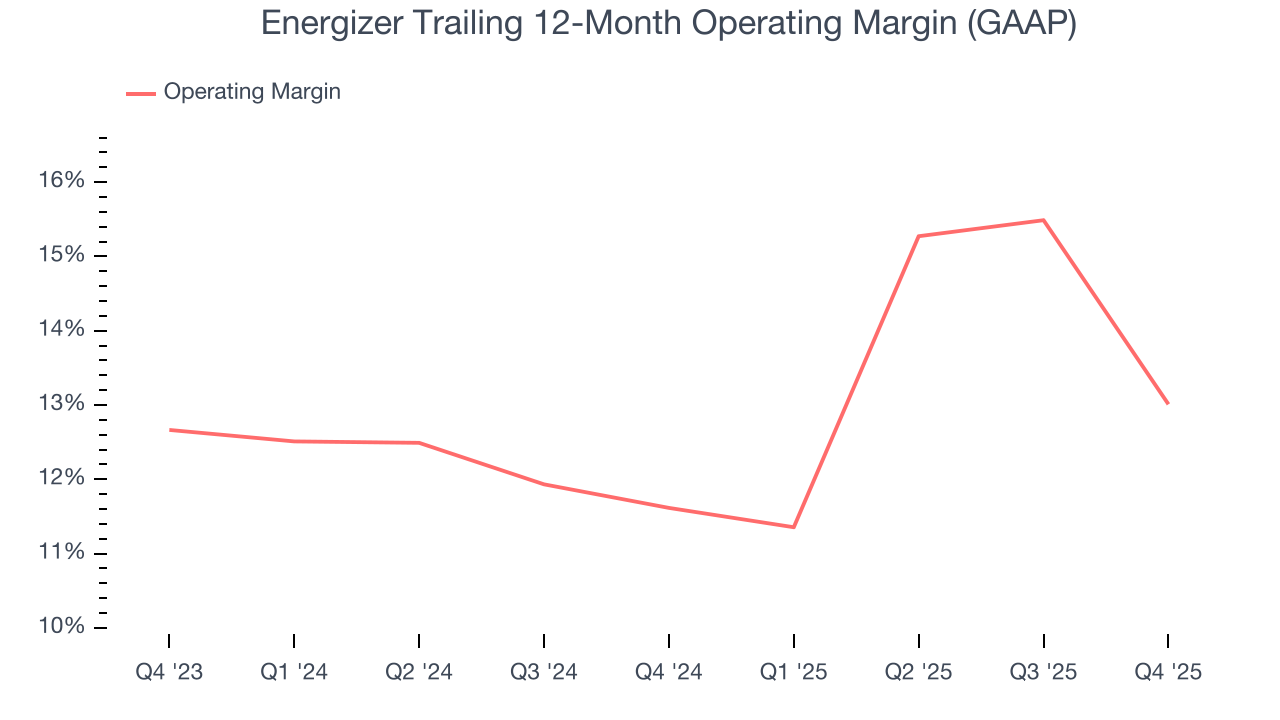
This quarter, Energizer’s breakeven margin was -0.6%, down 9.1 percentage points year on year. Since Energizer’s operating margin decreased more than its gross margin, we can assume it was less efficient because expenses such as marketing, and administrative overhead increased.
9. Earnings Per Share
Revenue trends explain a company’s historical growth, but the long-term change in earnings per share (EPS) points to the profitability of that growth – for example, a company could inflate its sales through excessive spending on advertising and promotions.
Energizer’s EPS grew at an unimpressive 4.4% compounded annual growth rate over the last three years. This performance was better than its flat revenue but doesn’t tell us much about its business quality because its operating margin didn’t improve.
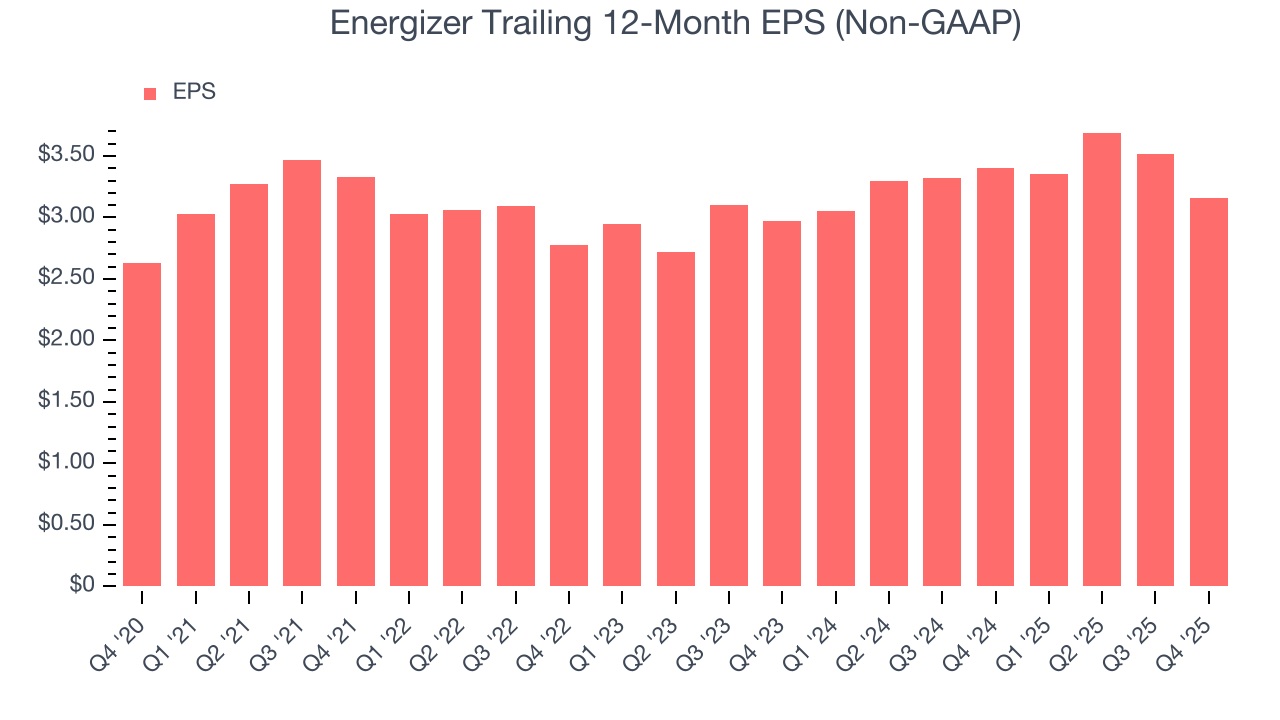
In Q4, Energizer reported adjusted EPS of $0.31, down from $0.67 in the same quarter last year. Despite falling year on year, this print easily cleared analysts’ estimates. Over the next 12 months, Wall Street expects Energizer’s full-year EPS of $3.16 to grow 10.3%.
10. Cash Is King
Although earnings are undoubtedly valuable for assessing company performance, we believe cash is king because you can’t use accounting profits to pay the bills.
Energizer has shown decent cash profitability, giving it some flexibility to reinvest or return capital to investors. The company’s free cash flow margin averaged 6.2% over the last two years, slightly better than the broader consumer staples sector.
Taking a step back, we can see that Energizer’s margin dropped by 2.8 percentage points over the last year. If its declines continue, it could signal increasing investment needs and capital intensity.
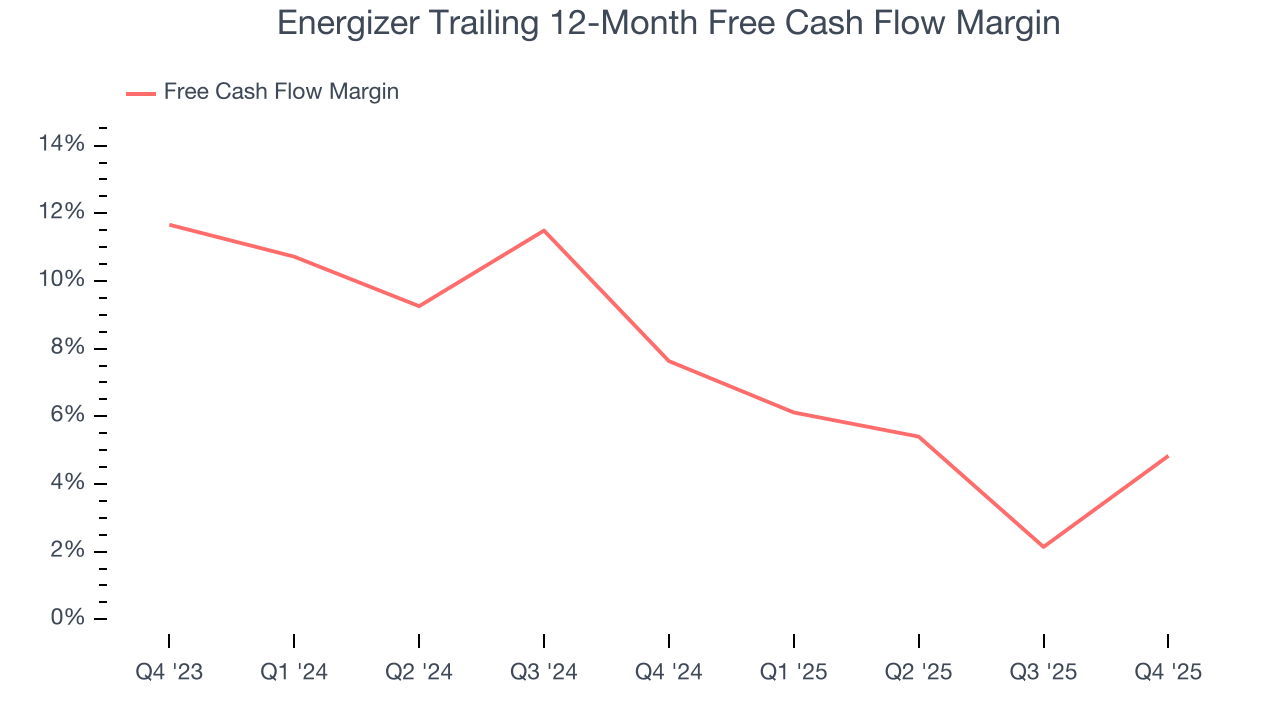
Energizer’s free cash flow clocked in at $124.2 million in Q4, equivalent to a 15.9% margin. This result was good as its margin was 10.2 percentage points higher than in the same quarter last year, but we wouldn’t read too much into the short term because investment needs can be seasonal, causing temporary swings. Long-term trends trump fluctuations.
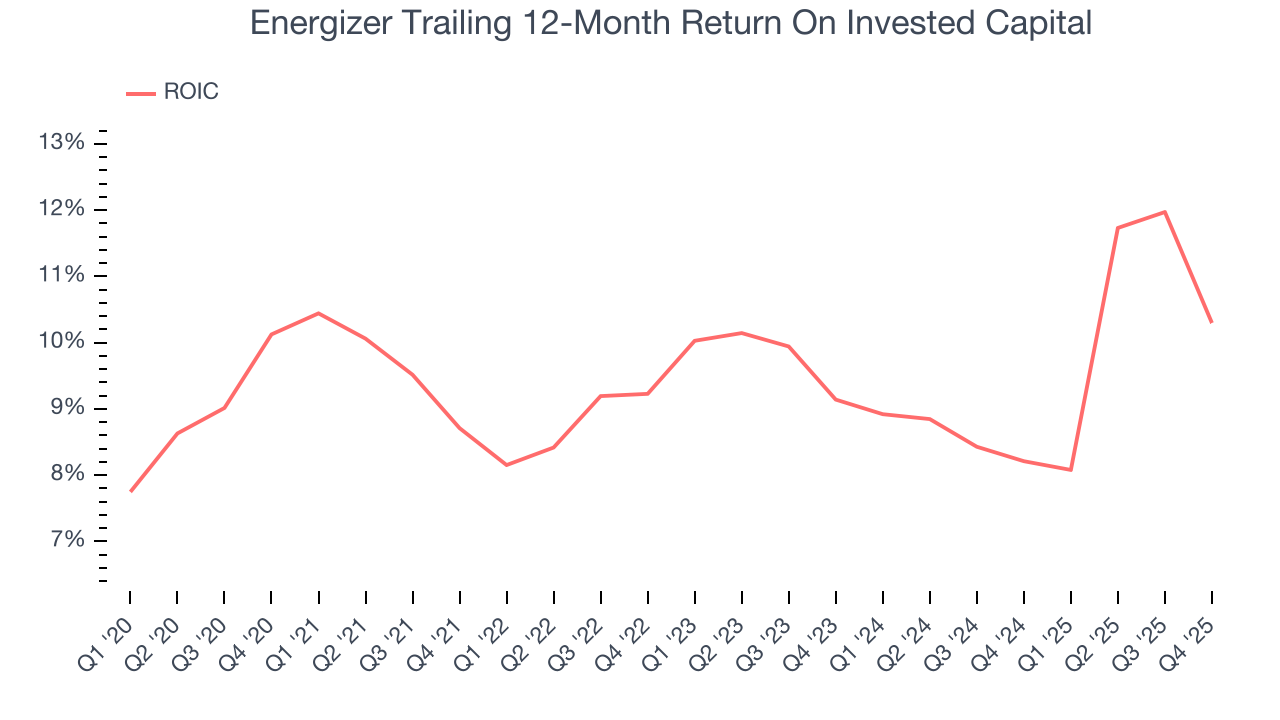
11. Return on Invested Capital (ROIC)
EPS and free cash flow tell us whether a company was profitable while growing its revenue. But was it capital-efficient? A company’s ROIC explains this by showing how much operating profit it makes compared to the money it has raised (debt and equity).
Energizer historically did a mediocre job investing in profitable growth initiatives. Its five-year average ROIC was 9.1%, somewhat low compared to the best consumer staples companies that consistently pump out 20%+.
12. Balance Sheet Risk
As long-term investors, the risk we care about most is the permanent loss of capital, which can happen when a company goes bankrupt or raises money from a disadvantaged position. This is separate from short-term stock price volatility, something we are much less bothered by.
Energizer’s $3.41 billion of debt exceeds the $214.8 million of cash on its balance sheet. Furthermore, its 5× net-debt-to-EBITDA ratio (based on its EBITDA of $589.8 million over the last 12 months) shows the company is overleveraged.
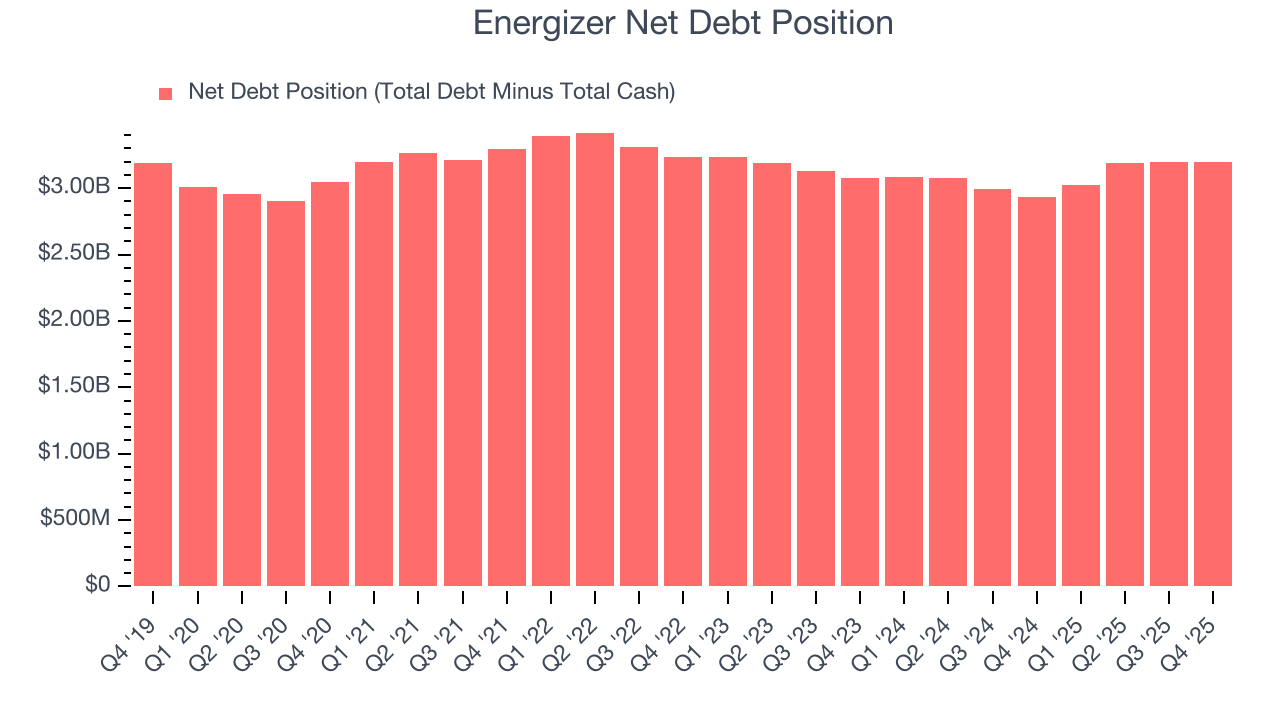
At this level of debt, incremental borrowing becomes increasingly expensive and credit agencies could downgrade the company’s rating if profitability falls. Energizer could also be backed into a corner if the market turns unexpectedly – a situation we seek to avoid as investors in high-quality companies.
We hope Energizer can improve its balance sheet and remain cautious until it increases its profitability or pays down its debt.
13. Key Takeaways from Energizer’s Q4 Results
We were impressed by how significantly Energizer blew past analysts’ revenue expectations this quarter. We were also glad its EBITDA outperformed Wall Street’s estimates. On the other hand, its gross margin missed and its EPS guidance for next quarter fell short of Wall Street’s estimates. Overall, this print was mixed but still had some key positives. The stock traded up 1.3% to $23.69 immediately following the results.
14. Is Now The Time To Buy Energizer?
Updated: February 5, 2026 at 7:26 AM EST
Before making an investment decision, investors should account for Energizer’s business fundamentals and valuation in addition to what happened in the latest quarter.
Energizer isn’t a terrible business, but it isn’t one of our picks. First off, its revenue growth was weak over the last three years, and analysts don’t see anything changing over the next 12 months. And while Energizer’s gross margins indicate a healthy starting point for the overall profitability of the business, its cash profitability fell over the last year.
Energizer’s P/E ratio based on the next 12 months is 6.7x. While this valuation is optically cheap, the potential downside is big given its shaky fundamentals. We're fairly confident there are better investments elsewhere.
Wall Street analysts have a consensus one-year price target of $22.67 on the company (compared to the current share price of $23.69).