
Energizer (ENR)
We wouldn’t recommend Energizer. Not only are its sales cratering but also its low returns on capital suggest it struggles to generate profits.― StockStory Analyst Team
1. News


2. Summary
Why We Think Energizer Will Underperform
Masterminds behind the viral Energizer Bunny mascot, Energizer (NYSE:ENR) is one of the world's largest manufacturers of batteries.
- Annual revenue declines of 1.1% over the last three years indicate problems with its market positioning
- Organic sales performance over the past two years indicates the company may need to make strategic adjustments or rely on M&A to catalyze faster growth
- 5× net-debt-to-EBITDA ratio makes lenders less willing to extend additional capital, potentially necessitating dilutive equity offerings


Energizer falls short of our expectations. More profitable opportunities exist elsewhere.
Why There Are Better Opportunities Than Energizer


Energizer’s stock price of $21.11 implies a valuation ratio of 6.2x forward P/E. Energizer’s valuation may seem like a bargain, but we think there are valid reasons why it’s so cheap.
Cheap stocks can look like a great deal at first glance, but they can be value traps. They often have less earnings power, meaning there is more reliance on a re-rating to generate good returns - an unlikely scenario for low-quality companies.
3. Energizer (ENR) Research Report: Q3 CY2025 Update
Battery and lighting company Energizer (NYSE:ENR) reported Q3 CY2025 results topping the market’s revenue expectations, with sales up 3.4% year on year to $832.8 million. On the other hand, next quarter’s revenue guidance of $695.1 million was less impressive, coming in 8.9% below analysts’ estimates. Its non-GAAP profit of $1.05 per share was 9.8% below analysts’ consensus estimates.
Energizer (ENR) Q3 CY2025 Highlights:
- Revenue: $832.8 million vs analyst estimates of $826.3 million (3.4% year-on-year growth, 0.8% beat)
- Adjusted EPS: $1.05 vs analyst expectations of $1.16 (9.8% miss)
- Adjusted EBITDA: $171.2 million vs analyst estimates of $178.9 million (20.6% margin, 4.3% miss)
- Revenue Guidance for Q4 CY2025 is $695.1 million at the midpoint, below analyst estimates of $763 million
- Adjusted EPS guidance for the upcoming financial year 2026 is $3.45 at the midpoint, missing analyst estimates by 7.4%
- EBITDA guidance for the upcoming financial year 2026 is $595 million at the midpoint, below analyst estimates of $640.3 million
- Operating Margin: 11.3%, down from 12.4% in the same quarter last year
- Free Cash Flow Margin: 5.6%, down from 17.6% in the same quarter last year
- Organic Revenue fell 2.2% year on year vs analyst estimates of flat growth (144.8 basis point miss)
- Market Capitalization: $1.63 billion
Company Overview
Masterminds behind the viral Energizer Bunny mascot, Energizer (NYSE:ENR) is one of the world's largest manufacturers of batteries.
The company’s roots can be traced to 1896 when American inventor Conrad Hubert patented the first flashlight, which utilized a dry cell battery. Over the next century, Hubert’s company would undergo a series of mergers. The Energizer we know today was born when it spun off from its parent company, Ralston Purina, in 2000, allowing it to focus exclusively on its battery and lighting businesses.
Energizer manufactures a wide range of batteries, including alkaline, lithium, rechargeable, and specialty batteries, that power devices in homes, workplaces, and on the go, from remote controls and flashlights to portable electronics and medical devices. Its brands, including Energizer and Eveready, are some of the most recognized globally thanks to their longevity, reliability, and consistent performance.
Beyond batteries, Energizer excels in providing high-quality lighting solutions. Their product lineup encompasses LED flashlights, lanterns, headlamps, and area lighting. These solutions offer brightness, durability, and energy efficiency, catering to outdoor enthusiasts and everyday illumination needs.
Energizer's products are distributed and enjoyed by consumers across the globe. It engages with customers through various channels, including retail partnerships and e-commerce platforms, and places a strong emphasis on eco-friendly options that contribute to reducing waste and conserving resources.
4. Household Products
Household products stocks are generally stable investments, as many of the industry's products are essential for a comfortable and functional living space. Recently, there's been a growing emphasis on eco-friendly and sustainable offerings, reflecting the evolving consumer preferences for environmentally conscious options. These trends can be double-edged swords that benefit companies who innovate quickly to take advantage of them and hurt companies that don't invest enough to meet consumers where they want to be with regards to trends.
Competitors in the battery and lighting industry include AmazonBasics (owned by Amazon, NASDAQ:AMZN), Duracell (owned by Proctor & Gamble, NYSE:PG), Panasonic (TSE:6752), and Sony (NYSE:SONY).
5. Revenue Growth
A company’s long-term sales performance can indicate its overall quality. Any business can put up a good quarter or two, but many enduring ones grow for years.
With $2.95 billion in revenue over the past 12 months, Energizer carries some recognizable products but is a mid-sized consumer staples company. Its size could bring disadvantages compared to larger competitors benefiting from better brand awareness and economies of scale.
As you can see below, Energizer’s revenue declined by 1.1% per year over the last three years, a poor baseline for our analysis.
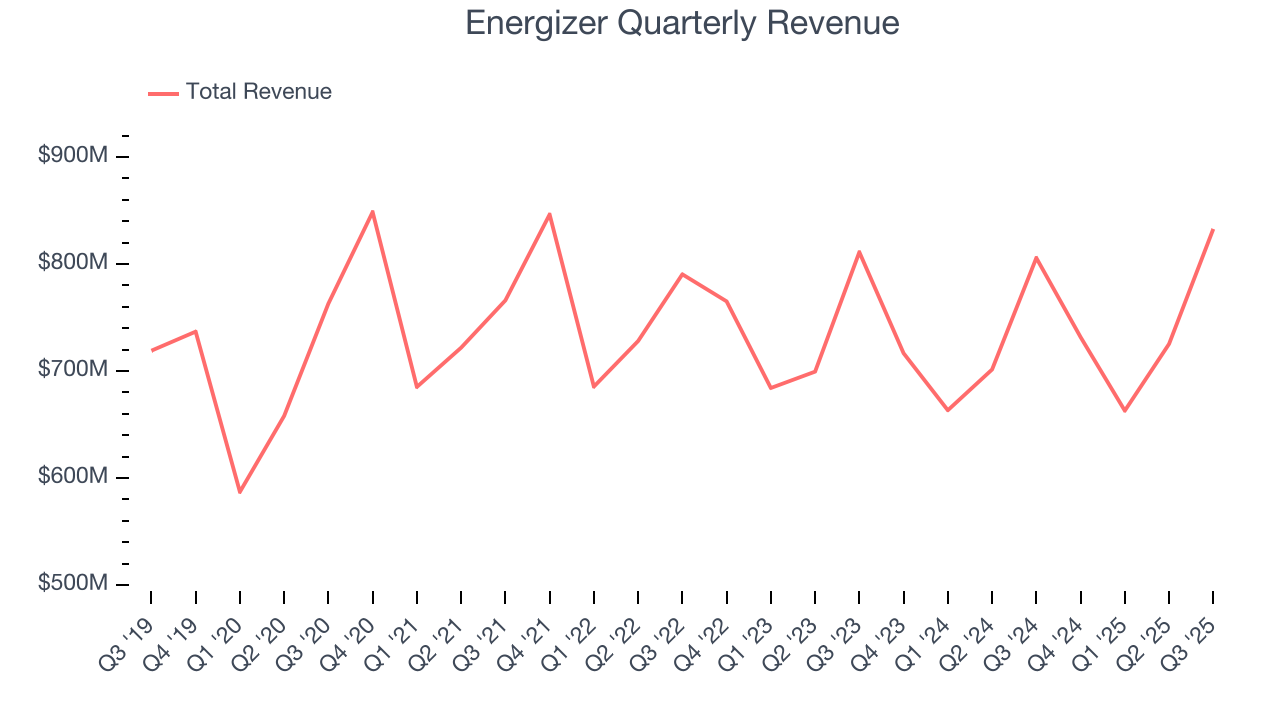
This quarter, Energizer reported modest year-on-year revenue growth of 3.4% but beat Wall Street’s estimates by 0.8%. Company management is currently guiding for a 5% year-on-year decline in sales next quarter.
Looking further ahead, sell-side analysts expect revenue to grow 2.8% over the next 12 months. While this projection indicates its newer products will fuel better top-line performance, it is still below average for the sector.
6. Organic Revenue Growth
When analyzing revenue growth, we care most about organic revenue growth. This metric captures a business’s performance excluding one-time events such as mergers, acquisitions, and divestitures as well as foreign currency fluctuations.
The demand for Energizer’s products has barely risen over the last eight quarters. On average, the company’s organic sales have been flat. 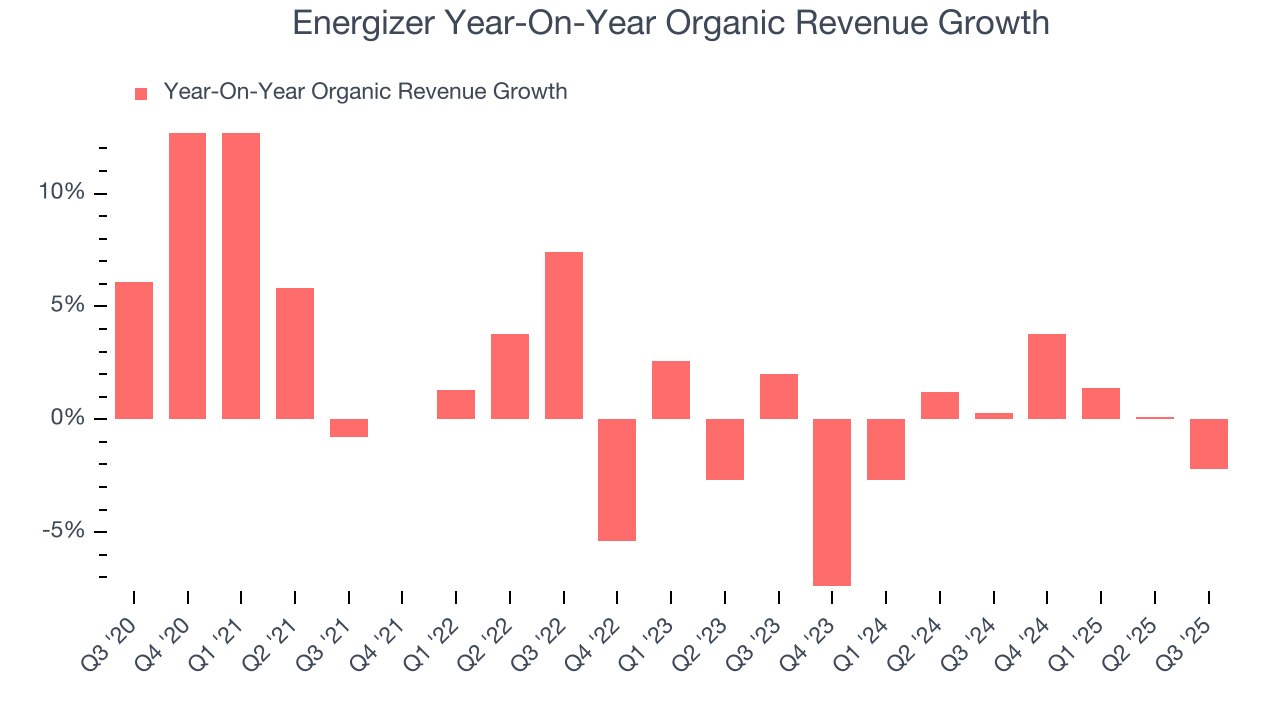
In the latest quarter, Energizer’s organic sales fell by 2.2% year on year. This decrease represents a further deceleration from its historical levels. We hope the business can get back on track.
7. Gross Margin & Pricing Power
At StockStory, we prefer high gross margin businesses because they indicate pricing power or differentiated products, giving the company a chance to generate higher operating profits.
Energizer has good unit economics for a consumer staples company, giving it the opportunity to invest in areas such as marketing and talent to stay competitive. As you can see below, it averaged an impressive 41.7% gross margin over the last two years. That means for every $100 in revenue, $58.28 went towards paying for raw materials, production of goods, transportation, and distribution. 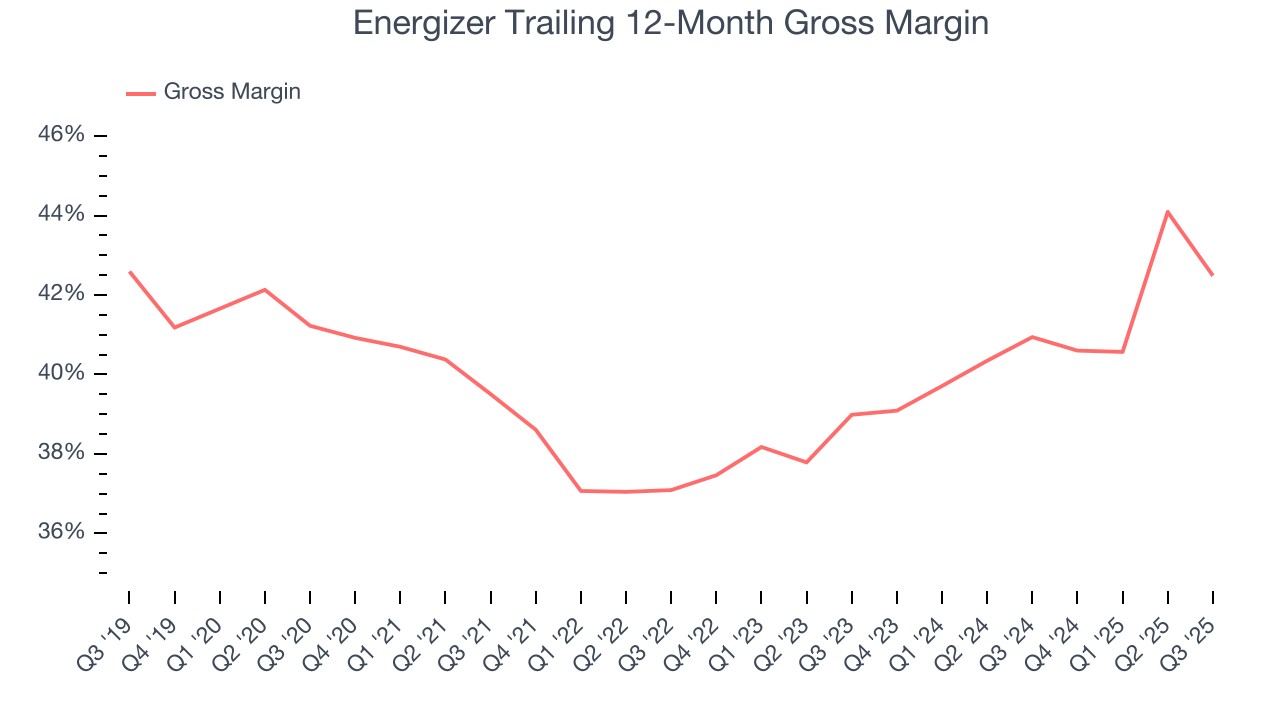
This quarter, Energizer’s gross profit margin was 36.6%, down 5.6 percentage points year on year. Zooming out, however, Energizer’s full-year margin has been trending up over the past 12 months, increasing by 1.5 percentage points. If this move continues, it could suggest better unit economics due to more leverage from its growing sales on the fixed portion of its cost of goods sold (such as manufacturing expenses).
8. Operating Margin
Operating margin is an important measure of profitability accounting for key expenses such as marketing and advertising, IT systems, wages, and other administrative costs.
Energizer has managed its cost base well over the last two years. It demonstrated solid profitability for a consumer staples business, producing an average operating margin of 13.4%. This result isn’t too surprising as its gross margin gives it a favorable starting point.
Analyzing the trend in its profitability, Energizer’s operating margin rose by 3 percentage points over the last year, showing its efficiency has improved.
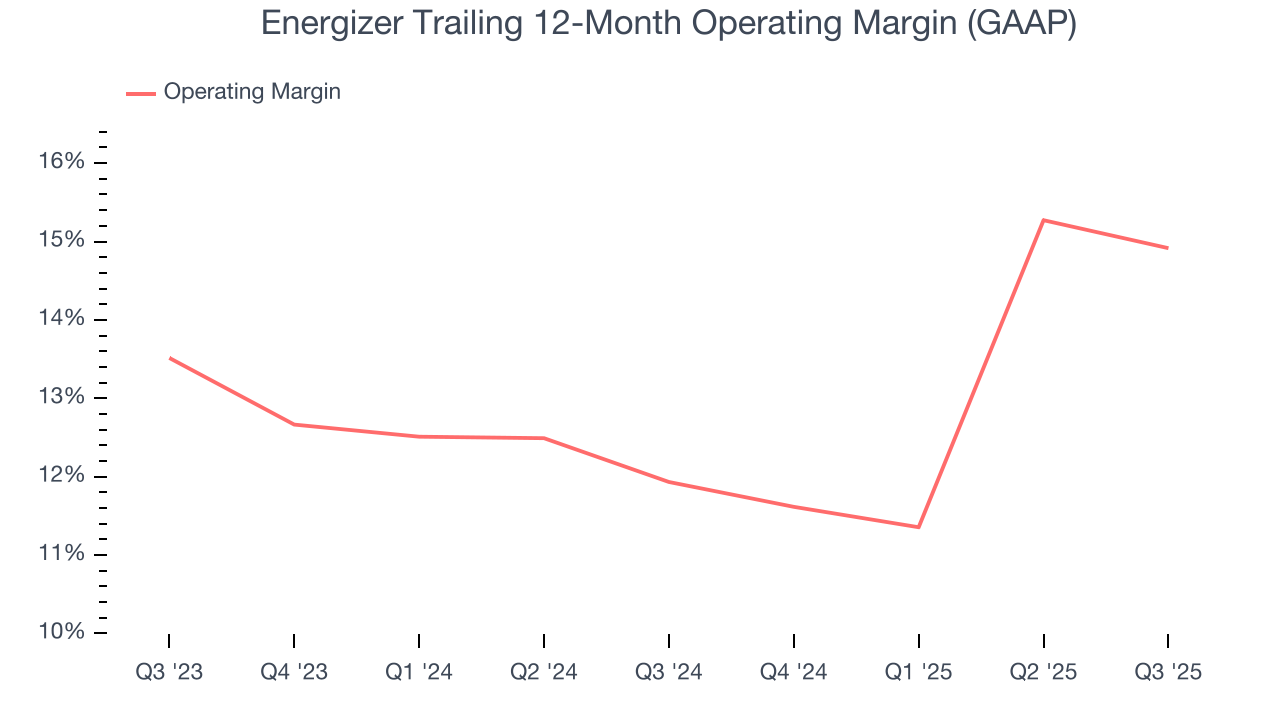
In Q3, Energizer generated an operating margin profit margin of 11.3%, down 1.2 percentage points year on year. Since Energizer’s gross margin decreased more than its operating margin, we can assume its recent inefficiencies were driven more by weaker leverage on its cost of sales rather than increased marketing, and administrative overhead expenses.
9. Earnings Per Share
We track the change in earnings per share (EPS) for the same reason as long-term revenue growth. Compared to revenue, however, EPS highlights whether a company’s growth is profitable.
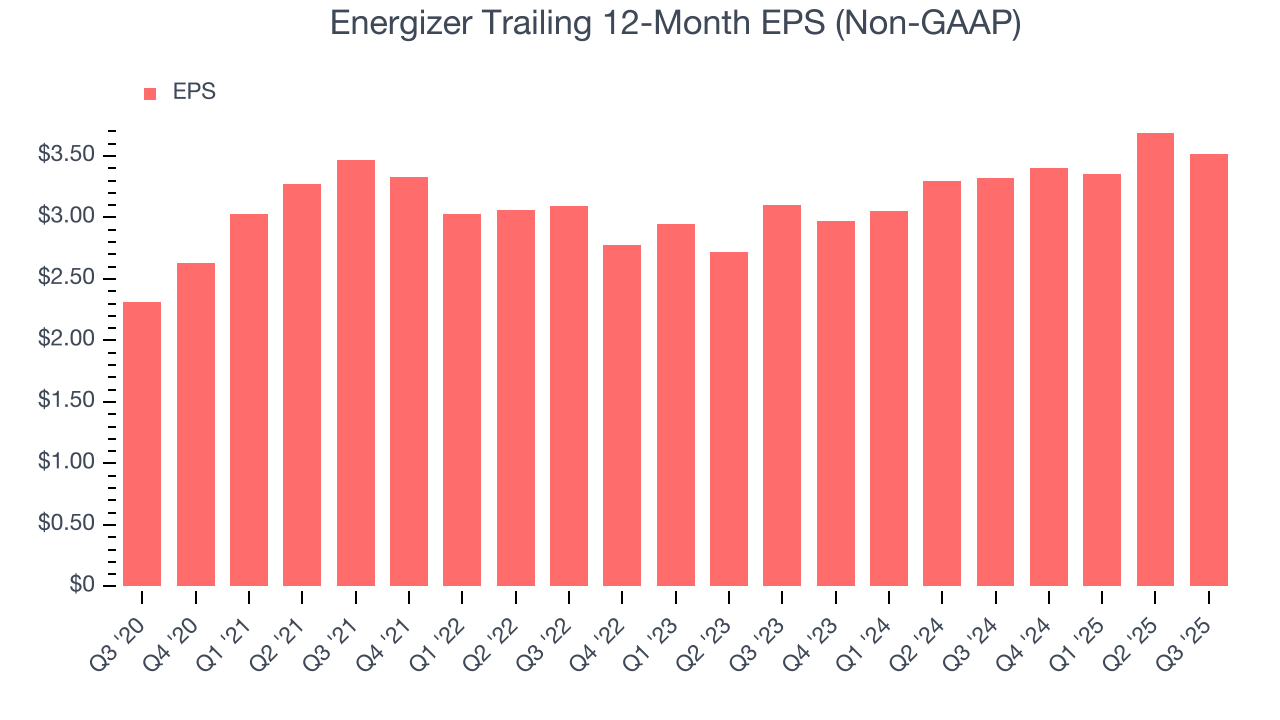
In Q3, Energizer reported adjusted EPS of $1.05, down from $1.22 in the same quarter last year. This print missed analysts’ estimates. Over the next 12 months, Wall Street expects Energizer’s full-year EPS of $3.52 to grow 5.7%.
10. Cash Is King
Free cash flow isn't a prominently featured metric in company financials and earnings releases, but we think it's telling because it accounts for all operating and capital expenses, making it tough to manipulate. Cash is king.
Energizer has shown decent cash profitability, giving it some flexibility to reinvest or return capital to investors. The company’s free cash flow margin averaged 6.8% over the last two years, slightly better than the broader consumer staples sector.
Taking a step back, we can see that Energizer’s margin dropped by 9.3 percentage points over the last year. If its declines continue, it could signal increasing investment needs and capital intensity.
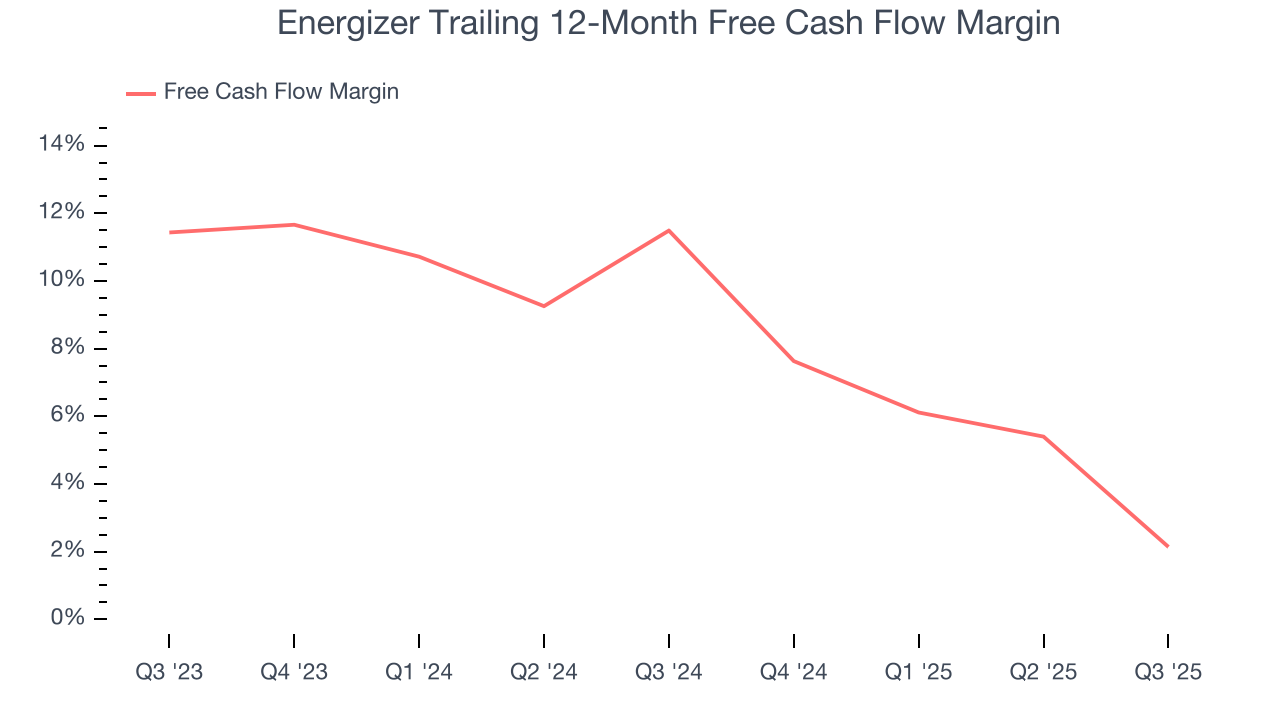
Energizer’s free cash flow clocked in at $46.7 million in Q3, equivalent to a 5.6% margin. The company’s cash profitability regressed as it was 12 percentage points lower than in the same quarter last year, suggesting its historical struggles have dragged on.
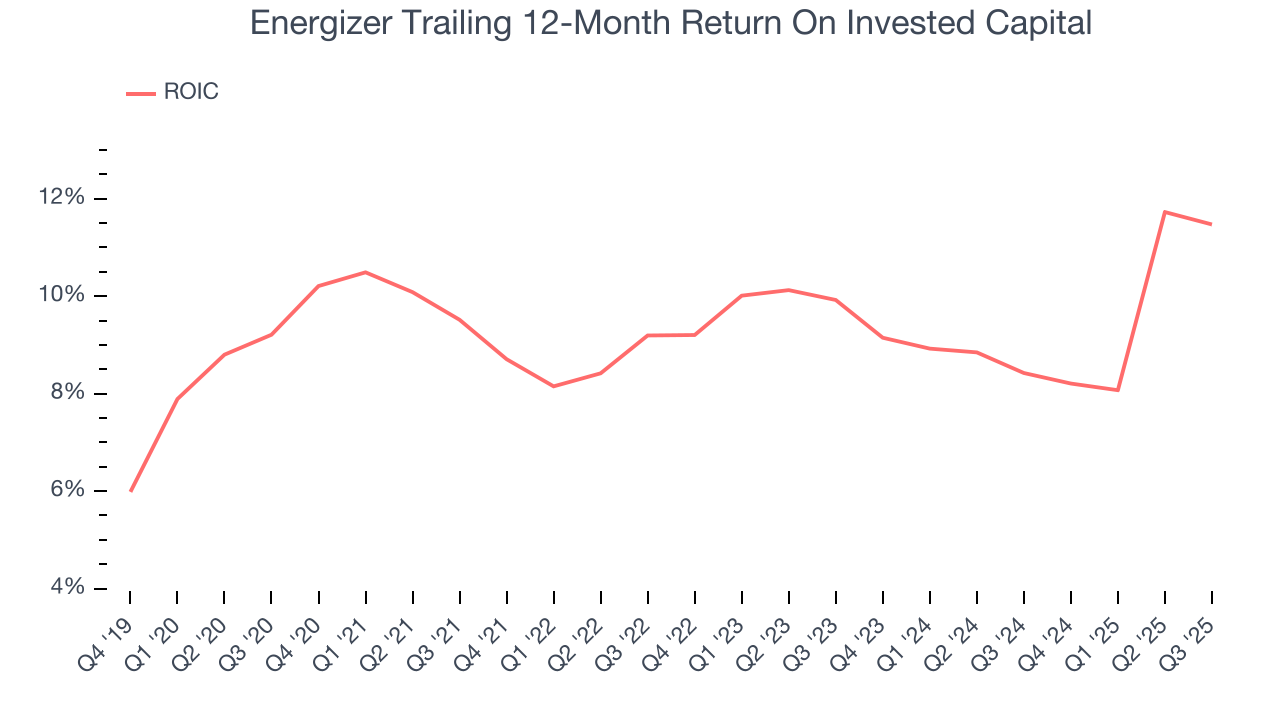
11. Return on Invested Capital (ROIC)
EPS and free cash flow tell us whether a company was profitable while growing its revenue. But was it capital-efficient? A company’s ROIC explains this by showing how much operating profit it makes compared to the money it has raised (debt and equity).
Energizer historically did a mediocre job investing in profitable growth initiatives. Its five-year average ROIC was 9.7%, somewhat low compared to the best consumer staples companies that consistently pump out 20%+.
12. Balance Sheet Risk
As long-term investors, the risk we care about most is the permanent loss of capital, which can happen when a company goes bankrupt or raises money from a disadvantaged position. This is separate from short-term stock price volatility, something we are much less bothered by.
Energizer’s $3.53 billion of debt exceeds the $236.2 million of cash on its balance sheet. Furthermore, its 5× net-debt-to-EBITDA ratio (based on its EBITDA of $623.6 million over the last 12 months) shows the company is overleveraged.
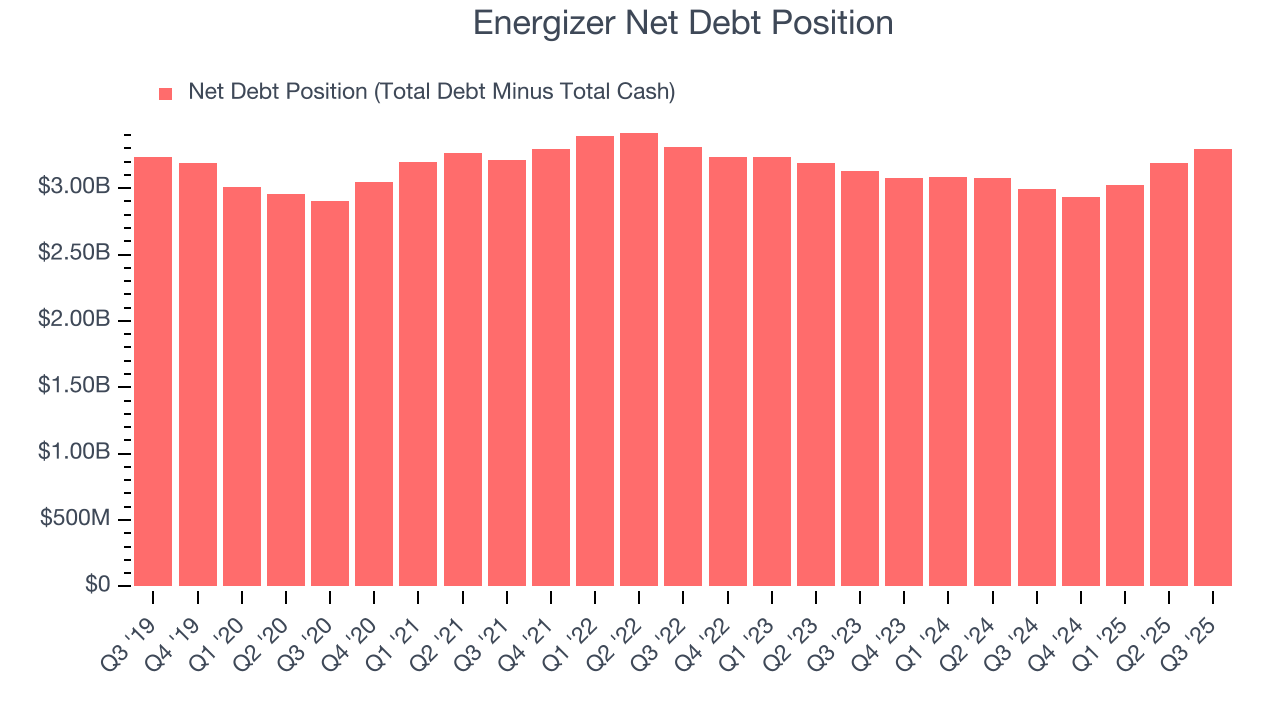
At this level of debt, incremental borrowing becomes increasingly expensive and credit agencies could downgrade the company’s rating if profitability falls. Energizer could also be backed into a corner if the market turns unexpectedly – a situation we seek to avoid as investors in high-quality companies.
We hope Energizer can improve its balance sheet and remain cautious until it increases its profitability or pays down its debt.
13. Key Takeaways from Energizer’s Q3 Results
It was good to see Energizer narrowly top analysts’ revenue expectations this quarter. On the other hand, its gross margin missed and its EPS guidance for next quarter fell short of Wall Street’s estimates. Overall, this was a weaker quarter. The stock traded down 5.4% to $22.57 immediately after reporting.
14. Is Now The Time To Buy Energizer?
Updated: January 13, 2026 at 9:48 PM EST
Before investing in or passing on Energizer, we urge you to understand the company’s business quality (or lack thereof), valuation, and the latest quarterly results - in that order.
Energizer falls short of our quality standards. To kick things off, its revenue has declined over the last three years. And while its expanding operating margin shows the business has become more efficient, the downside is its cash profitability fell over the last year. On top of that, its projected EPS for the next year is lacking.
Energizer’s P/E ratio based on the next 12 months is 6.2x. While this valuation is optically cheap, the potential downside is huge given its shaky fundamentals. There are more exciting stocks to buy at the moment.
Wall Street analysts have a consensus one-year price target of $22.50 on the company (compared to the current share price of $21.11).