ESAB (ESAB)
We aren’t fans of ESAB. Its growth has been lacking and its free cash flow margin has caved, suggesting it’s struggling to adapt.― StockStory Analyst Team
1. News


2. Summary
Why We Think ESAB Will Underperform
Having played a significant role in the construction of the iconic Sydney Opera House, ESAB (NYSE:ESAB) manufactures and sells welding and cutting equipment for numerous industries.
- Organic revenue growth fell short of our benchmarks over the past two years and implies it may need to improve its products, pricing, or go-to-market strategy
- Annual revenue growth of 4.1% over the last four years was below our standards for the industrials sector
- On the bright side, its excellent operating margin highlights the strength of its business model, and its profits increased over the last five years as it scaled


ESAB’s quality isn’t great. Our attention is focused on better businesses.
Why There Are Better Opportunities Than ESAB


ESAB is trading at $134.94 per share, or 23.6x forward P/E. ESAB’s multiple may seem like a great deal among industrials peers, but we think there are valid reasons why it’s this cheap.
Our advice is to pay up for elite businesses whose advantages are tailwinds to earnings growth. Don’t get sucked into lower-quality businesses just because they seem like bargains. These mediocre businesses often never achieve a higher multiple as hoped, a phenomenon known as a “value trap”.
3. ESAB (ESAB) Research Report: Q3 CY2025 Update
Welding and cutting equipment manufacturer ESAB (NYSE:ESAB) reported revenue ahead of Wall Streets expectations in Q3 CY2025, with sales up 8.1% year on year to $727.8 million. Its non-GAAP profit of $1.32 per share was 3.7% above analysts’ consensus estimates.
ESAB (ESAB) Q3 CY2025 Highlights:
- Revenue: $727.8 million vs analyst estimates of $696 million (8.1% year-on-year growth, 4.6% beat)
- Adjusted EPS: $1.32 vs analyst estimates of $1.27 (3.7% beat)
- Adjusted EBITDA: $133.4 million vs analyst estimates of $129.9 million (18.3% margin, 2.7% beat)
- Management slightly raised its full-year Adjusted EPS guidance to $5.25 at the midpoint
- EBITDA guidance for the full year is $537.5 million at the midpoint, in line with analyst expectations
- Operating Margin: 14.6%, down from 15.7% in the same quarter last year
- Free Cash Flow Margin: 9.6%, down from 13.4% in the same quarter last year
- Organic Revenue rose 2% year on year vs analyst estimates of flat growth (156.7 basis point beat)
- Market Capitalization: $7.35 billion
Company Overview
Having played a significant role in the construction of the iconic Sydney Opera House, ESAB (NYSE:ESAB) manufactures and sells welding and cutting equipment for numerous industries.
ESAB Corporation was founded in 1904 by Oscar Kjellberg. Kjellberg invented the world’s first coated welding electrode, which significantly advanced the welding industry and set the foundation for ESAB's product offerings. Throughout the 20th century, ESAB expanded globally, acquiring numerous companies and diversifying its product line to include not only welding consumables but also cutting equipment, automation, and associated technology.
Today, ESAB offers a diverse range of products focused on enhancing productivity in various industries through cutting, joining, and automated welding solutions. Its lineup includes welding consumables like electrodes, both cored and solid wires, and fluxes crafted from specialized materials. ESAB is also known for its cutting consumables, which encompass electrodes, nozzles, shields, and tips. Its equipment portfolio ranges from portable welding machines to expansive, customized automated cutting and welding systems. Additionally, ESAB integrates software and digital solutions that aid customers in increasing productivity, monitoring welding operations remotely, and digitizing documentation. These products are distributed globally across industries such as general industry, infrastructure, renewable energy, and transportation through both independent distributors and direct sales channels.
ESAB generates its revenue through the sale of its wide-ranging welding and cutting equipment and consumables. These products are sold globally across multiple industries, including infrastructure, energy, and transportation. Significantly, ESAB benefits from a recurring revenue stream through the sales of its consumables, such as welding wires, electrodes, and fluxes. These consumables are essential for continuous operation in welding activities, generating repeat purchases and contributing to the company’s financial sustainability.
4. Professional Tools and Equipment
Automation that increases efficiency and connected equipment that collects analyzable data have been trending, creating new demand. Some professional tools and equipment companies also provide software to accompany measurement or automated machinery, adding a stream of recurring revenues to their businesses. On the other hand, professional tools and equipment companies are at the whim of economic cycles. Consumer spending and interest rates, for example, can greatly impact the industrial production that drives demand for these companies’ offerings.
Competitors offering similar products include Lincoln Electric (NASDAQ:LECO), ITW (NYSE:ITW), and Colfax (NYSE:CFX).
5. Revenue Growth
A company’s long-term performance is an indicator of its overall quality. Any business can put up a good quarter or two, but the best consistently grow over the long haul. Regrettably, ESAB’s sales grew at a sluggish 4.1% compounded annual growth rate over the last four years. This was below our standard for the industrials sector and is a rough starting point for our analysis.
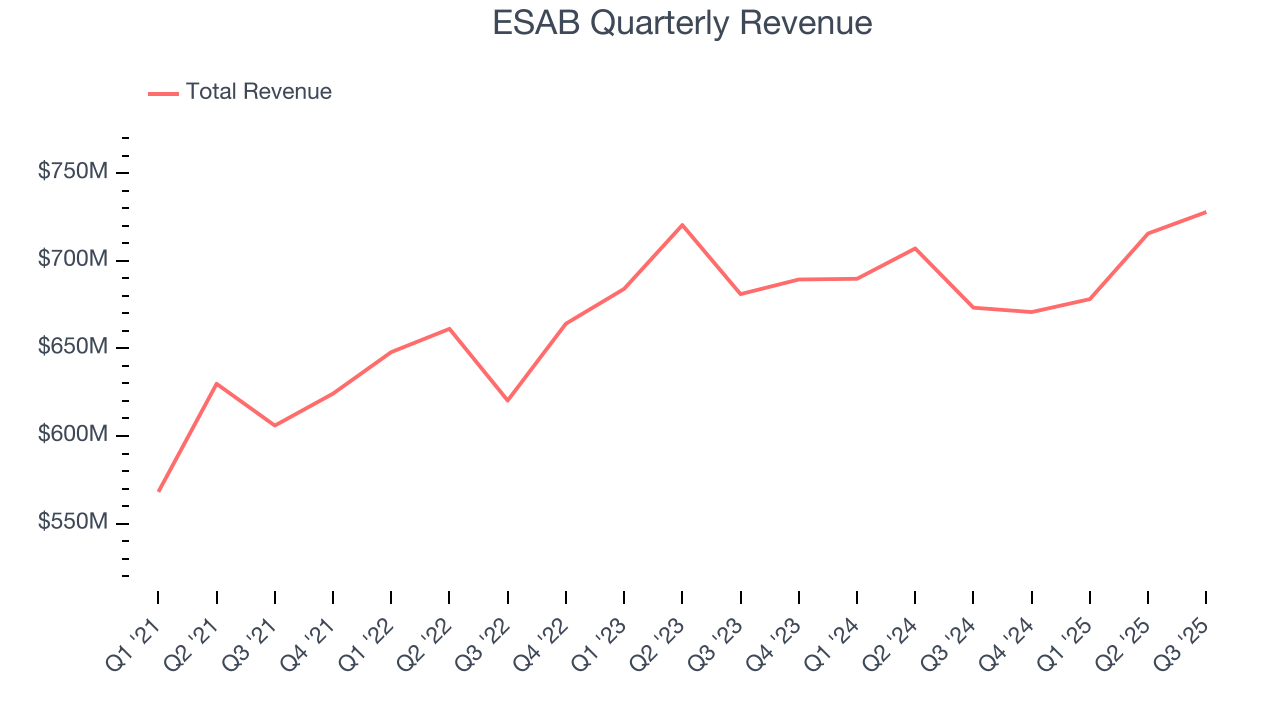
Long-term growth is the most important, but within industrials, a stretched historical view may miss new industry trends or demand cycles. ESAB’s recent performance shows its demand has slowed as its revenue was flat over the last two years. 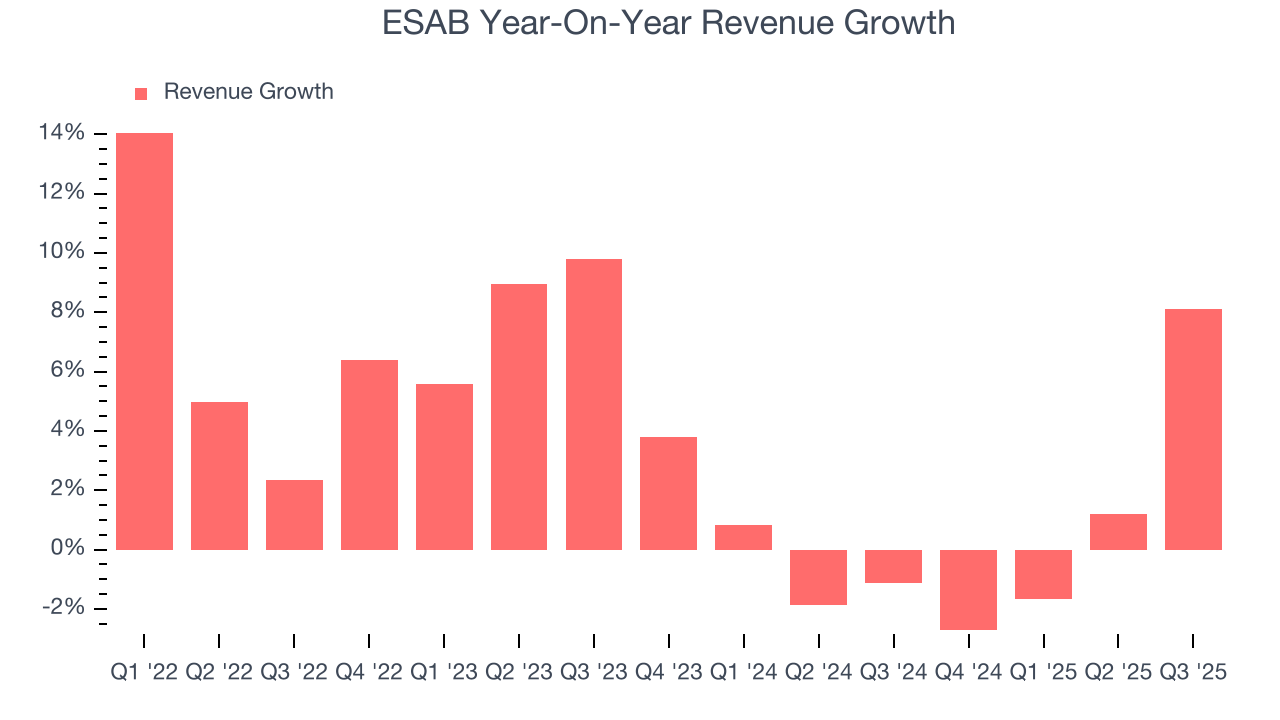
We can dig further into the company’s sales dynamics by analyzing its organic revenue, which strips out one-time events like acquisitions and currency fluctuations that don’t accurately reflect its fundamentals. Over the last two years, ESAB’s organic revenue averaged 1% year-on-year growth. Because this number aligns with its two-year revenue growth, we can see the company’s core operations (not acquisitions and divestitures) drove most of its results. 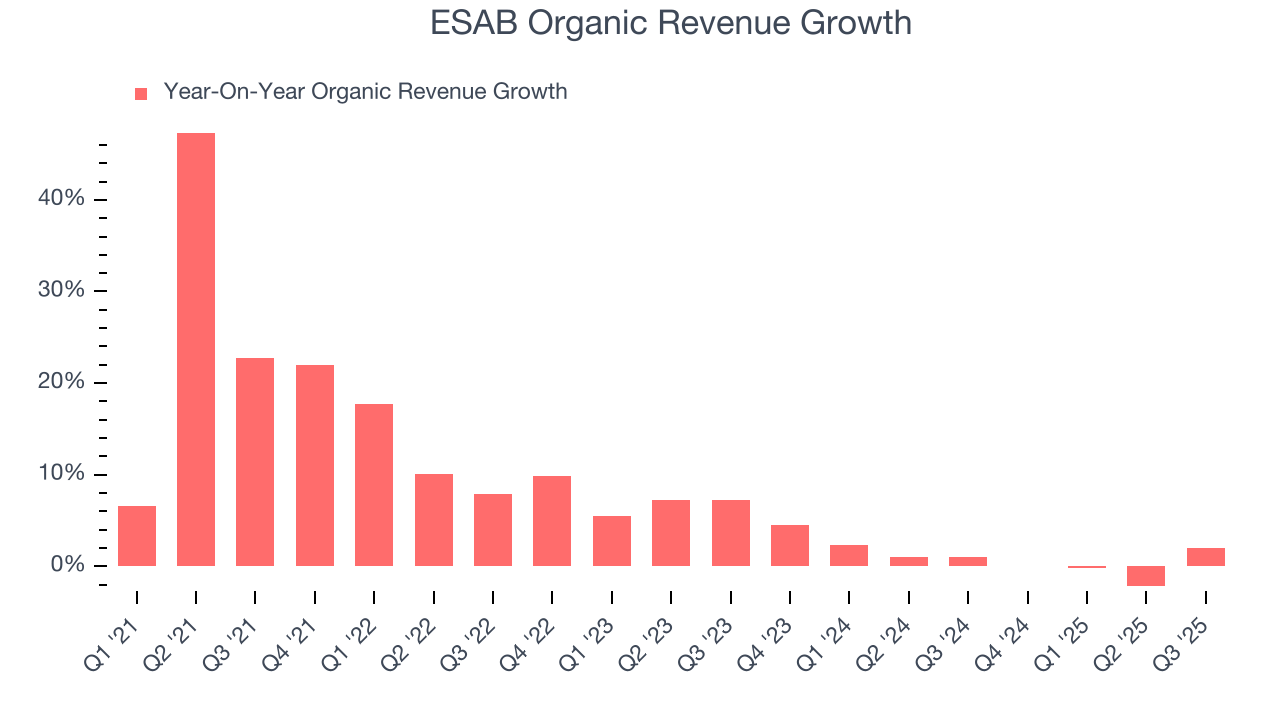
This quarter, ESAB reported year-on-year revenue growth of 8.1%, and its $727.8 million of revenue exceeded Wall Street’s estimates by 4.6%.
Looking ahead, sell-side analysts expect revenue to grow 5.5% over the next 12 months. While this projection indicates its newer products and services will catalyze better top-line performance, it is still below the sector average.
6. Gross Margin & Pricing Power
ESAB’s unit economics are great compared to the broader industrials sector and signal that it enjoys product differentiation through quality or brand. As you can see below, it averaged an excellent 36.1% gross margin over the last five years. Said differently, roughly $36.08 was left to spend on selling, marketing, R&D, and general administrative overhead for every $100 in revenue. 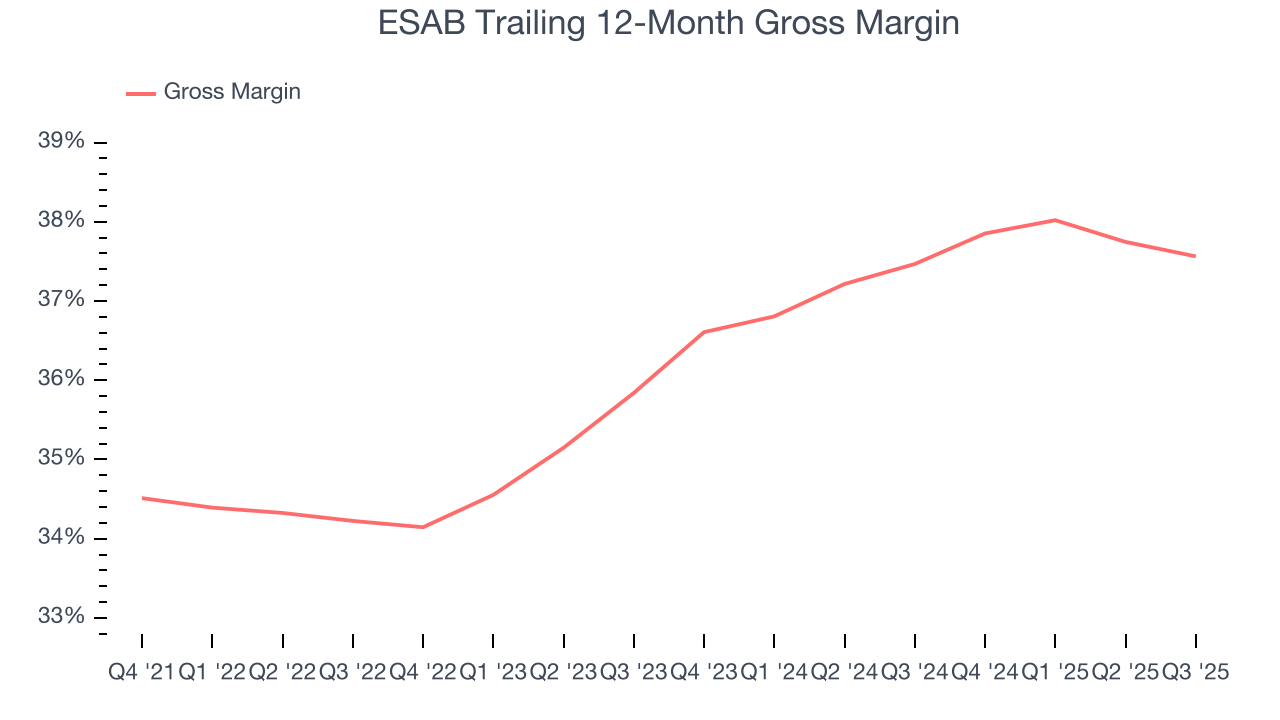
ESAB produced a 37% gross profit margin in Q3, in line with the same quarter last year. Zooming out, the company’s full-year margin has remained steady over the past 12 months, suggesting its input costs (such as raw materials and manufacturing expenses) have been stable and it isn’t under pressure to lower prices.
7. Operating Margin
Operating margin is a key measure of profitability. Think of it as net income - the bottom line - excluding the impact of taxes and interest on debt, which are less connected to business fundamentals.
ESAB has been an efficient company over the last five years. It was one of the more profitable businesses in the industrials sector, boasting an average operating margin of 14.3%. This result isn’t surprising as its high gross margin gives it a favorable starting point.
Looking at the trend in its profitability, ESAB’s operating margin rose by 2.4 percentage points over the last five years, as its sales growth gave it operating leverage.
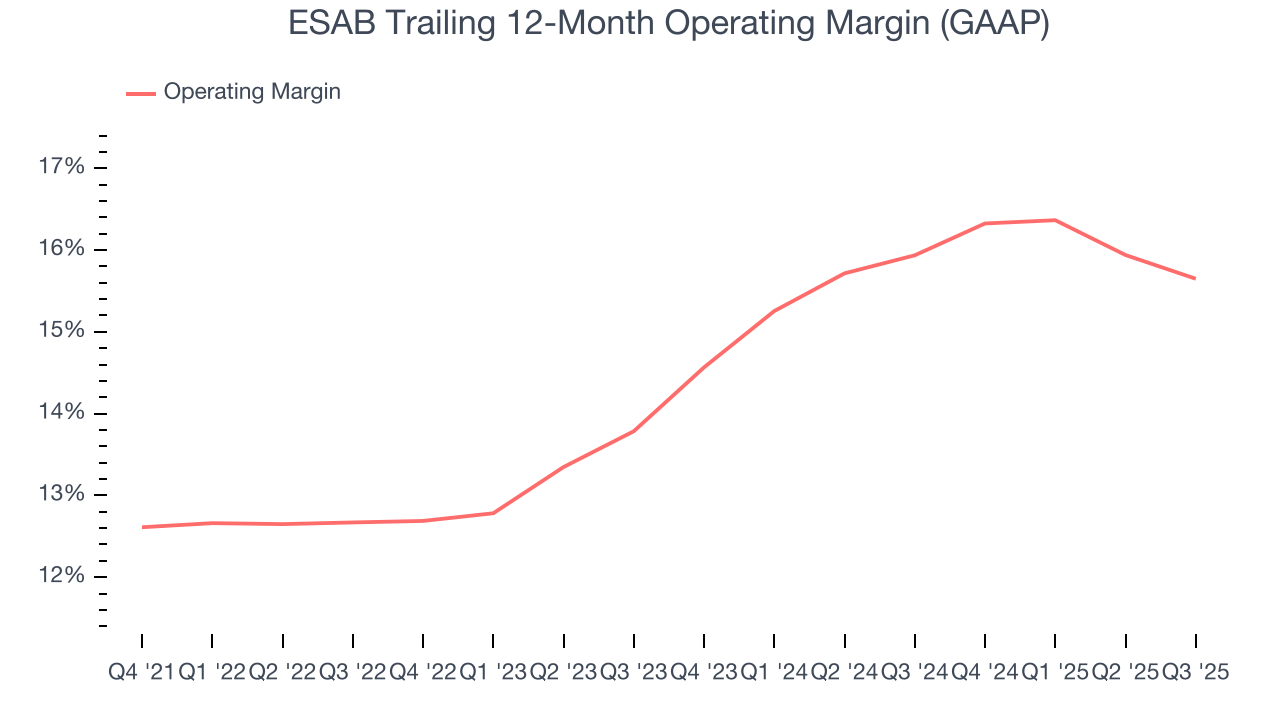
In Q3, ESAB generated an operating margin profit margin of 14.6%, down 1.1 percentage points year on year. Since ESAB’s operating margin decreased more than its gross margin, we can assume it was less efficient because expenses such as marketing, R&D, and administrative overhead increased.
8. Cash Is King
If you’ve followed StockStory for a while, you know we emphasize free cash flow. Why, you ask? We believe that in the end, cash is king, and you can’t use accounting profits to pay the bills.
ESAB has shown impressive cash profitability, enabling it to ride out cyclical downturns more easily while maintaining its investments in new and existing offerings. The company’s free cash flow margin averaged 8.8% over the last five years, better than the broader industrials sector.
Taking a step back, we can see that ESAB’s margin dropped by 3.2 percentage points during that time. If its declines continue, it could signal increasing investment needs and capital intensity.
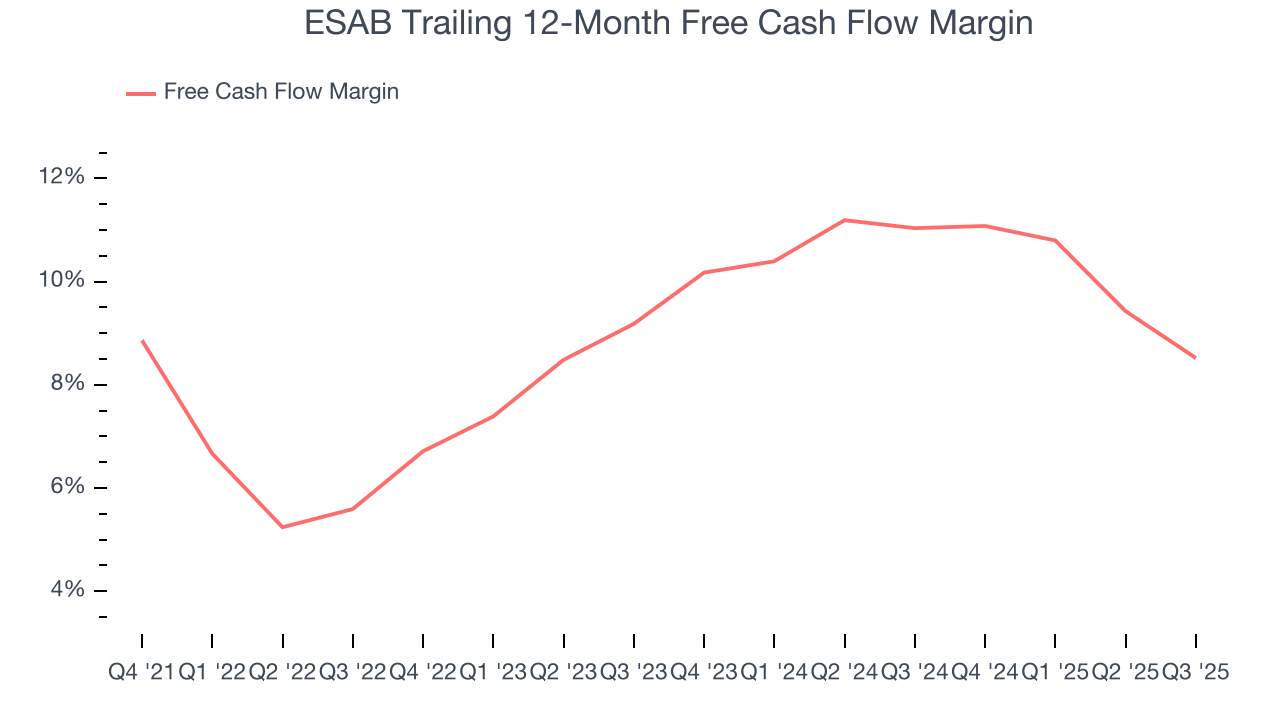
ESAB’s free cash flow clocked in at $70.2 million in Q3, equivalent to a 9.6% margin. The company’s cash profitability regressed as it was 3.8 percentage points lower than in the same quarter last year, suggesting its historical struggles have dragged on.
9. Balance Sheet Assessment
ESAB reported $218.2 million of cash and $1.34 billion of debt on its balance sheet in the most recent quarter. As investors in high-quality companies, we primarily focus on two things: 1) that a company’s debt level isn’t too high and 2) that its interest payments are not excessively burdening the business.
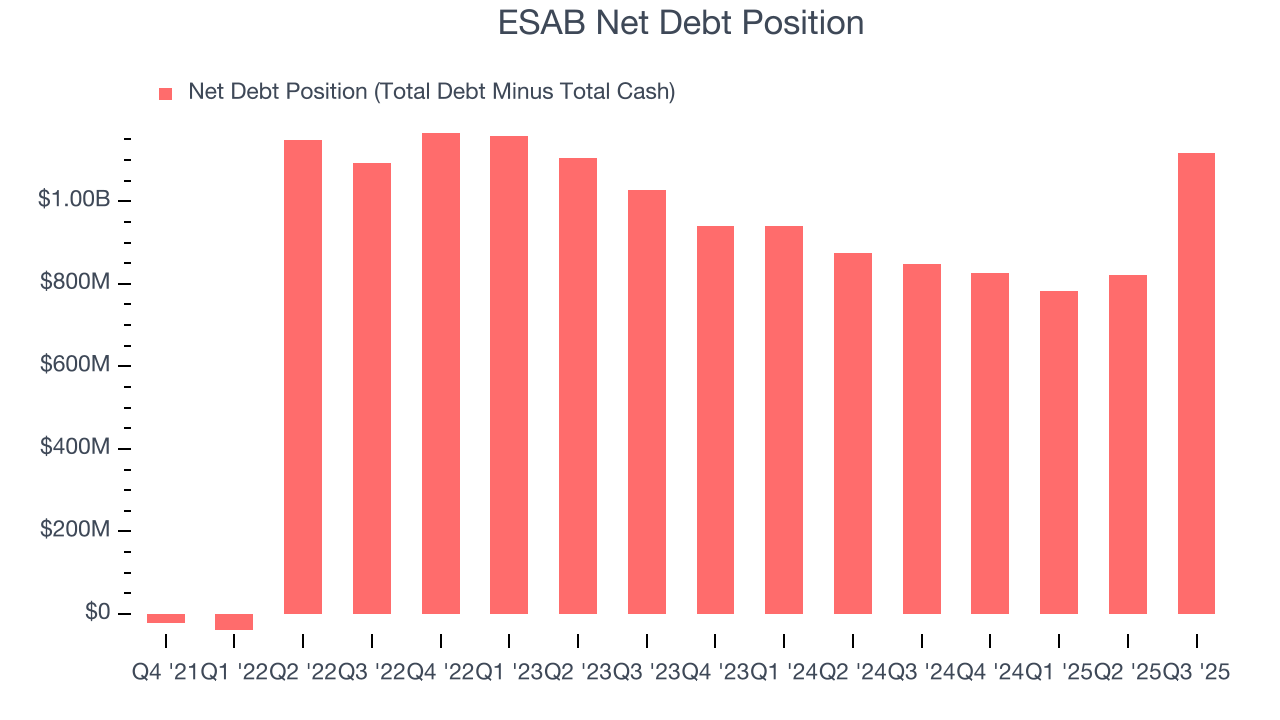
With $542 million of EBITDA over the last 12 months, we view ESAB’s 2.1× net-debt-to-EBITDA ratio as safe. We also see its $32.48 million of annual interest expenses as appropriate. The company’s profits give it plenty of breathing room, allowing it to continue investing in growth initiatives.
10. Key Takeaways from ESAB’s Q3 Results
We were impressed by how significantly ESAB blew past analysts’ revenue expectations this quarter. We were also glad its organic revenue outperformed Wall Street’s estimates. Overall, we think this was a solid quarter with some key areas of upside. The stock remained flat at $121.14 immediately after reporting.
11. Is Now The Time To Buy ESAB?
Updated: February 13, 2026 at 10:45 PM EST
Are you wondering whether to buy ESAB or pass? We urge investors to not only consider the latest earnings results but also longer-term business quality and valuation as well.
ESAB isn’t a terrible business, but it doesn’t pass our bar. First off, its revenue growth was uninspiring over the last four years. While its strong operating margins show it’s a well-run business, the downside is its flat organic revenue disappointed. On top of that, its cash profitability fell over the last five years.
ESAB’s P/E ratio based on the next 12 months is 23.6x. Beauty is in the eye of the beholder, but our analysis shows the upside isn’t great compared to the potential downside. We're pretty confident there are superior stocks to buy right now.
Wall Street analysts have a consensus one-year price target of $143 on the company (compared to the current share price of $134.94).