
Greenbrier (GBX)
We’re wary of Greenbrier. Its weak sales growth and low returns on capital show it struggled to generate demand and profits.― StockStory Analyst Team
1. News


2. Summary
Why We Think Greenbrier Will Underperform
Having designed the industry’s first double-decker railcar in the 1980s, Greenbrier (NYSE:GBX) supplies the freight rail transportation industry with railcars and related services.
- Forecasted revenue decline of 5.1% for the upcoming 12 months implies demand will fall even further
- Competitive supply chain dynamics and steep production costs are reflected in its low gross margin of 14%
- On the bright side, its incremental sales significantly boosted profitability as its annual earnings per share growth of 43.9% over the last five years outstripped its revenue performance


Greenbrier’s quality is not up to our standards. We’re hunting for superior stocks elsewhere.
Why There Are Better Opportunities Than Greenbrier


Greenbrier is trading at $51.78 per share, or 13.7x forward P/E. This multiple is lower than most industrials companies, but for good reason.
Our advice is to pay up for elite businesses whose advantages are tailwinds to earnings growth. Don’t get sucked into lower-quality businesses just because they seem like bargains. These mediocre businesses often never achieve a higher multiple as hoped, a phenomenon known as a “value trap”.
3. Greenbrier (GBX) Research Report: Q4 CY2025 Update
Rail transportation company Greenbrier (NYSE:GBX) reported Q4 CY2025 results topping the market’s revenue expectations, but sales fell by 19.4% year on year to $706.1 million. The company’s full-year revenue guidance of $2.95 billion at the midpoint came in 2.1% above analysts’ estimates. Its GAAP profit of $1.14 per share was 31% above analysts’ consensus estimates.
Greenbrier (GBX) Q4 CY2025 Highlights:
- Revenue: $706.1 million vs analyst estimates of $655.6 million (19.4% year-on-year decline, 7.7% beat)
- EPS (GAAP): $1.14 vs analyst estimates of $0.87 (31% beat)
- Adjusted EBITDA: $97.6 million vs analyst estimates of $88.34 million (13.8% margin, 10.5% beat)
- The company reconfirmed its revenue guidance for the full year of $2.95 billion at the midpoint
- EPS (GAAP) guidance for the full year is $4.25 at the midpoint, beating analyst estimates by 3%
- Operating Margin: 8.7%, down from 12.8% in the same quarter last year
- Free Cash Flow was $18.7 million, up from -$134 million in the same quarter last year
- Sales Volumes fell 2.6% year on year (-25.5% in the same quarter last year)
- Market Capitalization: $1.58 billion
Company Overview
Having designed the industry’s first double-decker railcar in the 1980s, Greenbrier (NYSE:GBX) supplies the freight rail transportation industry with railcars and related services.
Its product offerings include various types of railcars used for bulk transportation of goods. Greenbrier's hopper cars are used to move commodities like grain and coal, and its tank cars are used to move oil and chemicals, for example. Boxcars, flat cars, gondolas, and autorack cars round out its offerings and are all used for specific end markets.
Greenbrier designs, manufactures, and assembles these various types of railcars for its customers, who are major freight railroad operators and other commercial businesses that require long-haul transportation of goods. It generates revenue through the sale of these products, mostly made through direct sales. Greenbrier also generates more predictable and recurring revenue through the leasing of these products, where the customer doesn't take ownership and where Greenbrier may include various maintenance services. In addition to maintenance, the company's service offerings include repair and management services like making sure its clients’ cars comply with regulations.
Like many industries, Greenbrier is investing in digitization, which can help better track goods and predict transit times. Digitization also improves the data that customers may need to reduce transportation expenses and emissions. It is another vector in addition to service and price that satisfies customers and keeps them coming back.
4. Heavy Transportation Equipment
Heavy transportation equipment companies are investing in automated vehicles that increase efficiencies and connected machinery that collects actionable data. Some are also developing electric vehicles and mobility solutions to address customers’ concerns about carbon emissions, creating new sales opportunities. Additionally, they are increasingly offering automated equipment that increases efficiencies and connected machinery that collects actionable data. On the other hand, heavy transportation equipment companies are at the whim of economic cycles. Interest rates, for example, can greatly impact the construction and transport volumes that drive demand for these companies’ offerings.
Competitors of Greenbrier include Trinity (NYSE:TRN), FreightCar America (NASDAQ:RAIL), and private company American Railcar Industries (which was acquired by ITE Management).
5. Revenue Growth
A company’s long-term performance is an indicator of its overall quality. Any business can have short-term success, but a top-tier one grows for years. Regrettably, Greenbrier’s sales grew at a tepid 4.8% compounded annual growth rate over the last five years. This fell short of our benchmark for the industrials sector and is a poor baseline for our analysis.
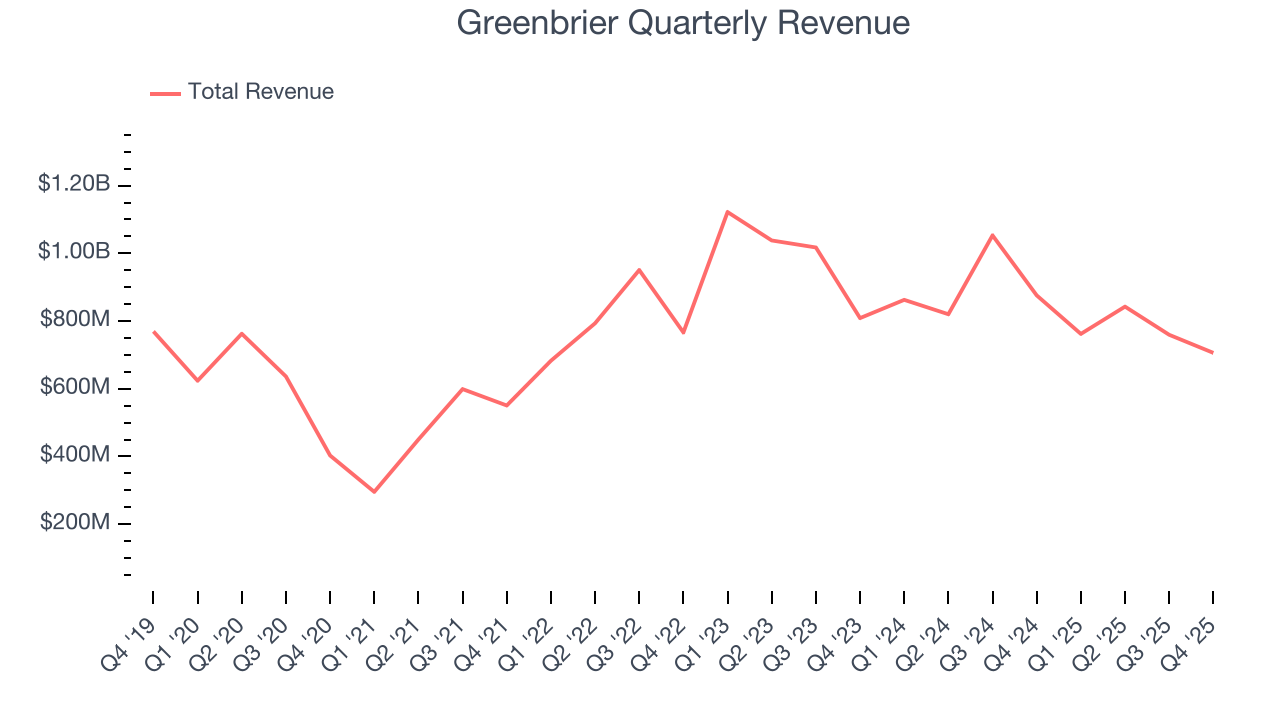
We at StockStory place the most emphasis on long-term growth, but within industrials, a half-decade historical view may miss cycles, industry trends, or a company capitalizing on catalysts such as a new contract win or a successful product line. Greenbrier’s performance shows it grew in the past but relinquished its gains over the last two years, as its revenue fell by 12.2% annually. Greenbrier isn’t alone in its struggles as the Heavy Transportation Equipment industry experienced a cyclical downturn, with many similar businesses observing lower sales at this time. 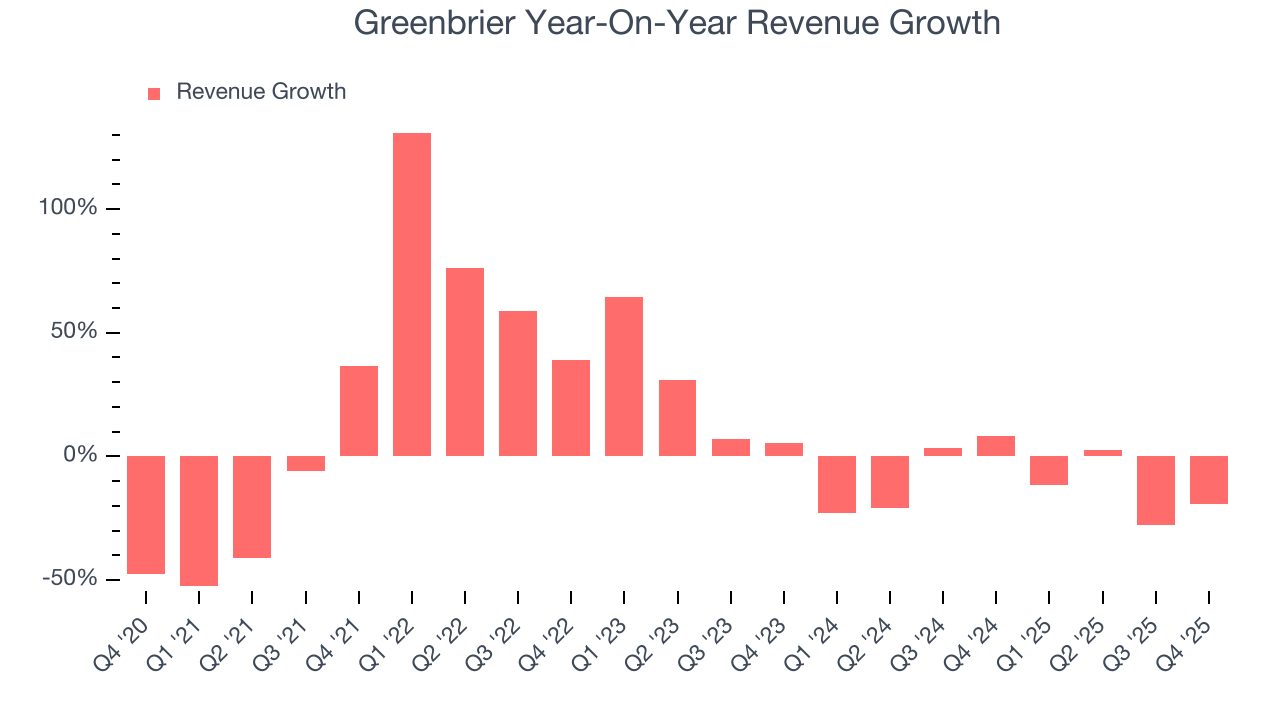
We can better understand the company’s revenue dynamics by analyzing its number of units sold, which reached 3,700 in the latest quarter. Over the last two years, Greenbrier’s units sold averaged 20.3% year-on-year declines. Because this number is lower than its revenue growth, we can see the company benefited from price increases. 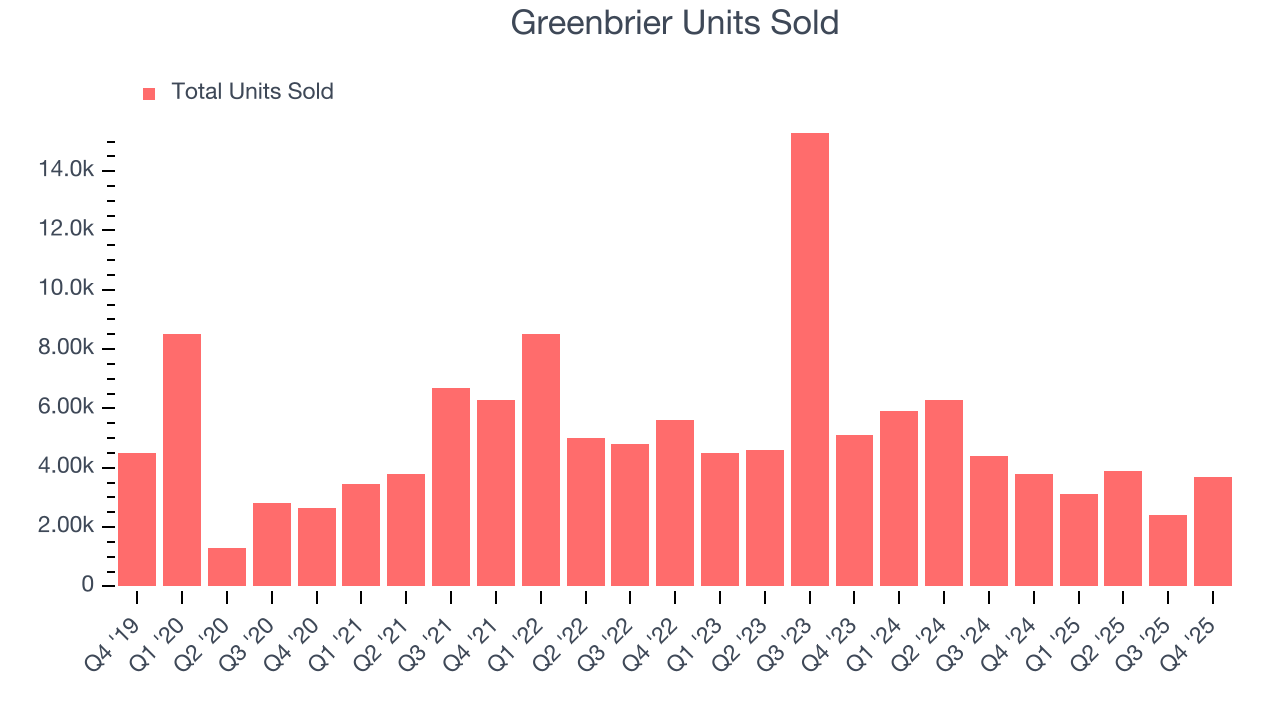
This quarter, Greenbrier’s revenue fell by 19.4% year on year to $706.1 million but beat Wall Street’s estimates by 7.7%.
Looking ahead, sell-side analysts expect revenue to decline by 5.2% over the next 12 months. While this projection is better than its two-year trend, it’s tough to feel optimistic about a company facing demand difficulties.
6. Gross Margin & Pricing Power
At StockStory, we prefer high gross margin businesses because they indicate the company has pricing power or differentiated products, giving it a chance to generate higher operating profits.
Greenbrier has bad unit economics for an industrials business, signaling it operates in a competitive market. As you can see below, it averaged a 14% gross margin over the last five years. That means Greenbrier paid its suppliers a lot of money ($85.99 for every $100 in revenue) to run its business. 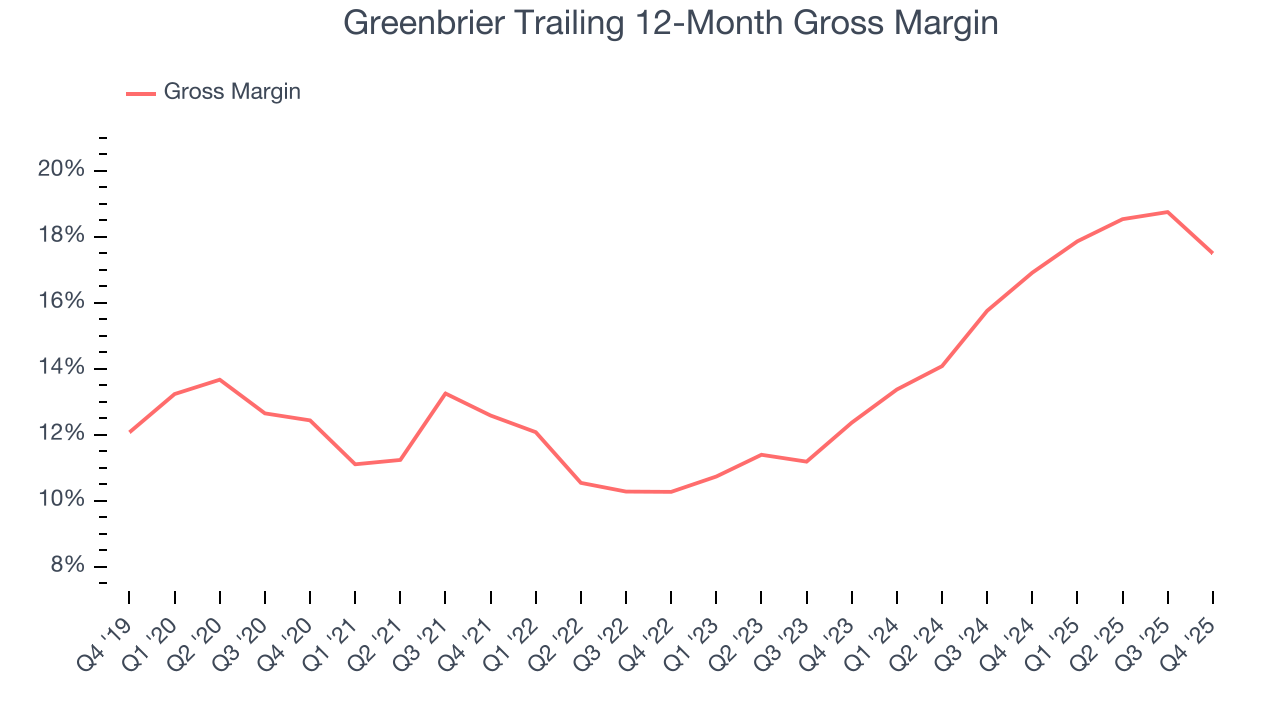
Greenbrier produced a 14.6% gross profit margin in Q4, marking a 5.2 percentage point decrease from 19.8% in the same quarter last year. On a wider time horizon, the company’s full-year margin has remained steady over the past four quarters, suggesting its input costs (such as raw materials and manufacturing expenses) have been stable and it isn’t under pressure to lower prices.
7. Operating Margin
Operating margin is a key measure of profitability. Think of it as net income - the bottom line - excluding the impact of taxes and interest on debt, which are less connected to business fundamentals.
Greenbrier was profitable over the last five years but held back by its large cost base. Its average operating margin of 6.9% was weak for an industrials business. This result isn’t too surprising given its low gross margin as a starting point.
On the plus side, Greenbrier’s operating margin rose by 7.2 percentage points over the last five years, as its sales growth gave it operating leverage.
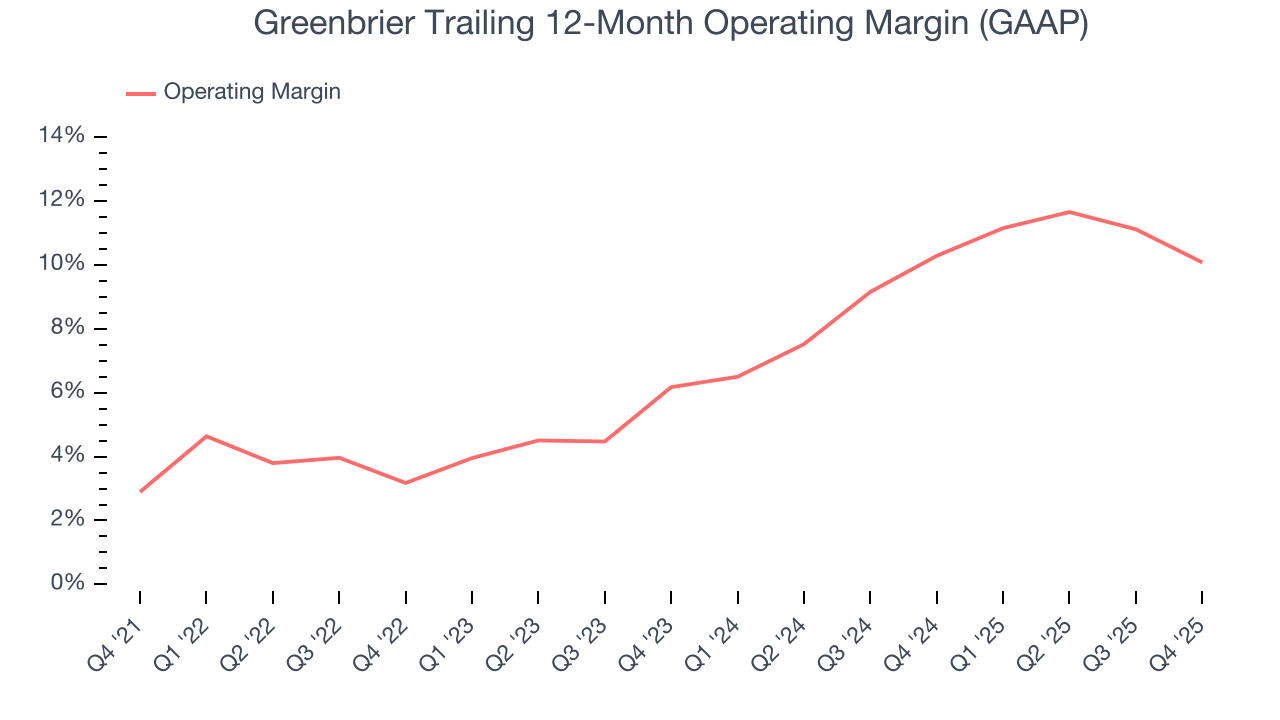
In Q4, Greenbrier generated an operating margin profit margin of 8.7%, down 4.1 percentage points year on year. Since Greenbrier’s gross margin decreased more than its operating margin, we can assume its recent inefficiencies were driven more by weaker leverage on its cost of sales rather than increased marketing, R&D, and administrative overhead expenses.
8. Earnings Per Share
Revenue trends explain a company’s historical growth, but the long-term change in earnings per share (EPS) points to the profitability of that growth – for example, a company could inflate its sales through excessive spending on advertising and promotions.
Greenbrier’s EPS grew at an astounding 43.9% compounded annual growth rate over the last five years, higher than its 4.8% annualized revenue growth. This tells us the company became more profitable on a per-share basis as it expanded.
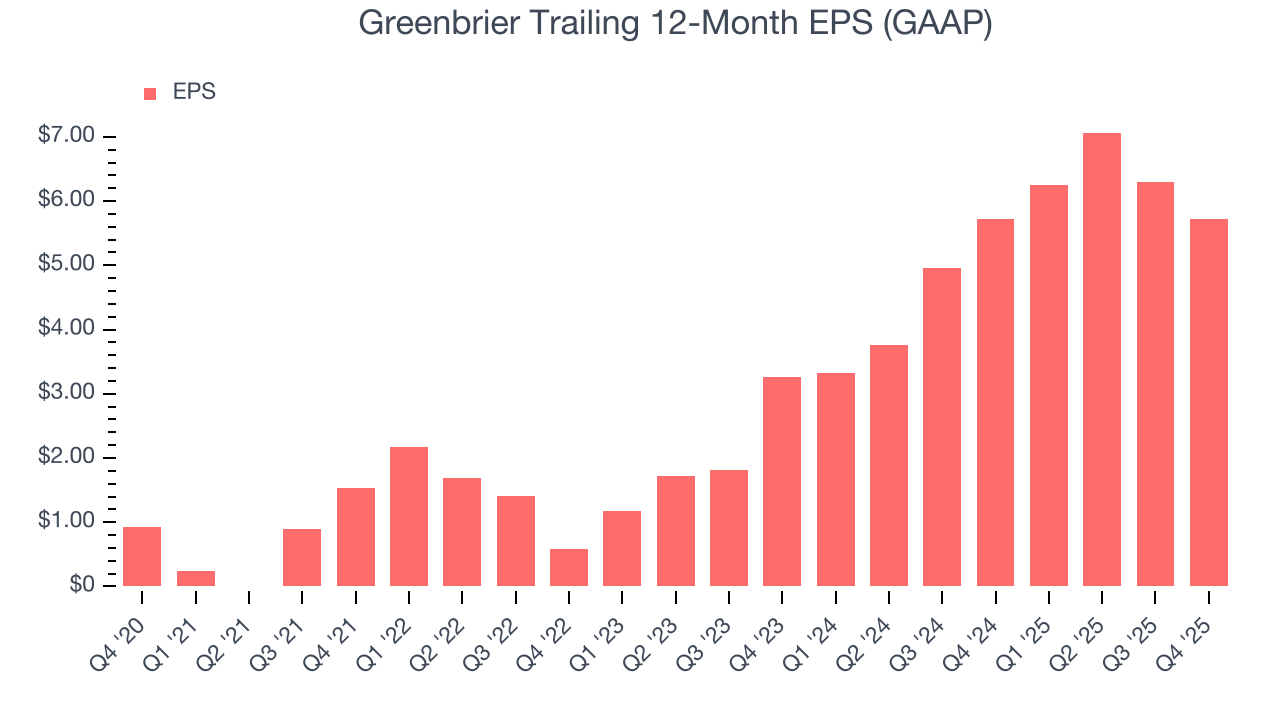
We can take a deeper look into Greenbrier’s earnings to better understand the drivers of its performance. As we mentioned earlier, Greenbrier’s operating margin declined this quarter but expanded by 7.2 percentage points over the last five years. Its share count also shrank by 2.6%, and these factors together are positive signs for shareholders because improving profitability and share buybacks turbocharge EPS growth relative to revenue growth. 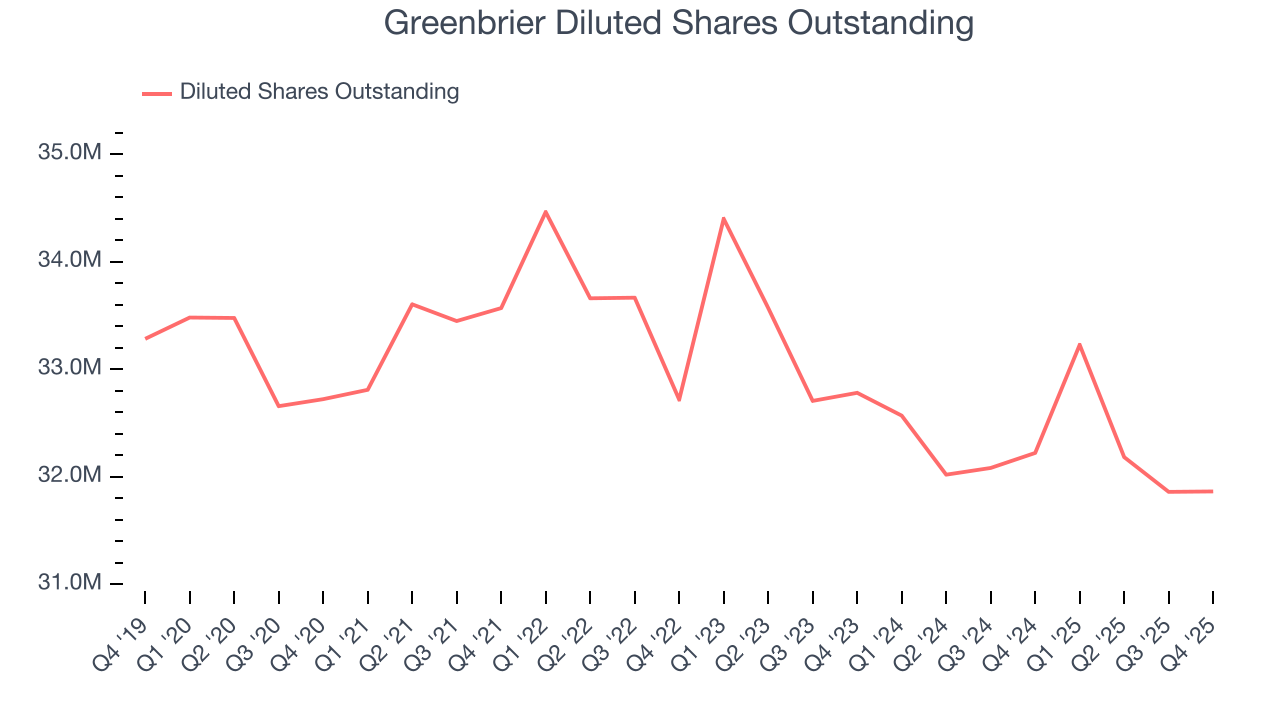
Like with revenue, we analyze EPS over a shorter period to see if we are missing a change in the business.
For Greenbrier, its two-year annual EPS growth of 32.3% was lower than its five-year trend. We still think its growth was good and hope it can accelerate in the future.
In Q4, Greenbrier reported EPS of $1.14, down from $1.72 in the same quarter last year. Despite falling year on year, this print easily cleared analysts’ estimates. We also like to analyze expected EPS growth based on Wall Street analysts’ consensus projections, but there is insufficient data.
9. Cash Is King
If you’ve followed StockStory for a while, you know we emphasize free cash flow. Why, you ask? We believe that in the end, cash is king, and you can’t use accounting profits to pay the bills.
While Greenbrier posted positive free cash flow this quarter, the broader story hasn’t been so clean. Greenbrier’s demanding reinvestments have drained its resources over the last five years, putting it in a pinch and limiting its ability to return capital to investors. Its free cash flow margin averaged negative 5.1%, meaning it lit $5.07 of cash on fire for every $100 in revenue.
Taking a step back, an encouraging sign is that Greenbrier’s margin expanded by 32.9 percentage points during that time. Despite its improvement and recent free cash flow generation, we’d like to see more quarters of positive cash flow before recommending the stock.
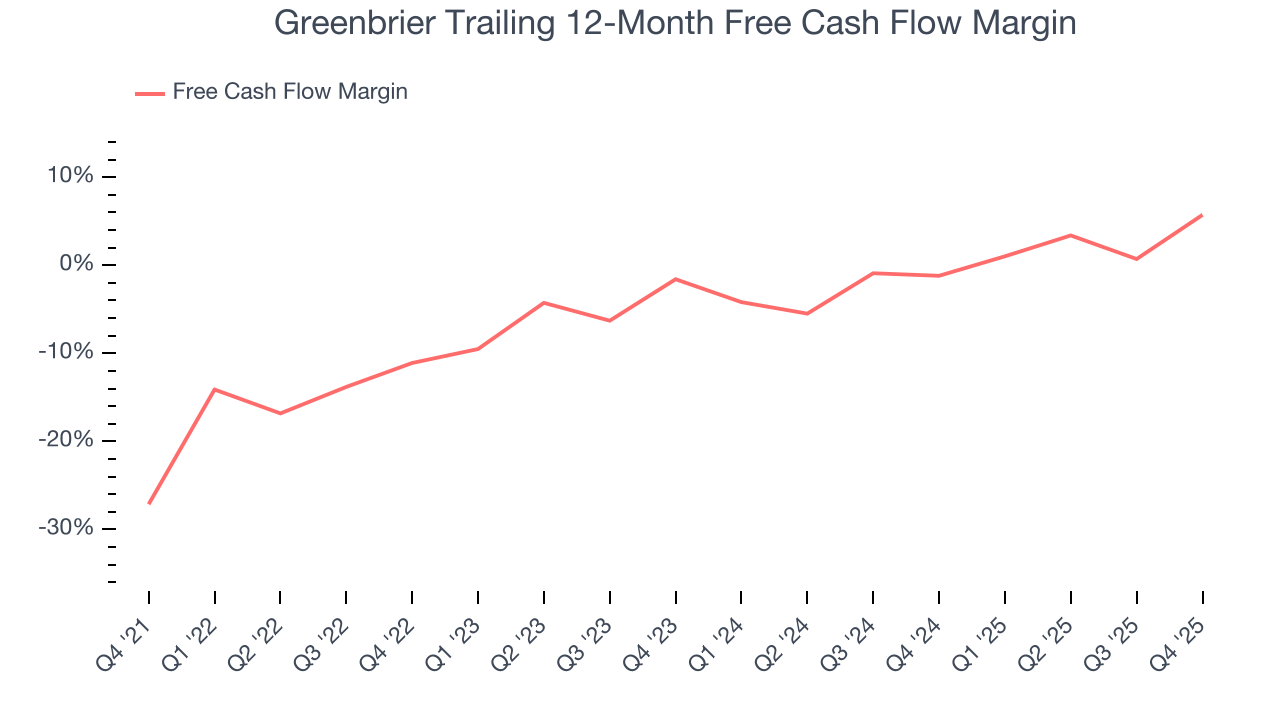
Greenbrier’s free cash flow clocked in at $18.7 million in Q4, equivalent to a 2.6% margin. Its cash flow turned positive after being negative in the same quarter last year, marking a potential inflection point.
10. Return on Invested Capital (ROIC)
EPS and free cash flow tell us whether a company was profitable while growing its revenue. But was it capital-efficient? Enter ROIC, a metric showing how much operating profit a company generates relative to the money it has raised (debt and equity).
Greenbrier historically did a mediocre job investing in profitable growth initiatives. Its five-year average ROIC was 6.8%, somewhat low compared to the best industrials companies that consistently pump out 20%+.
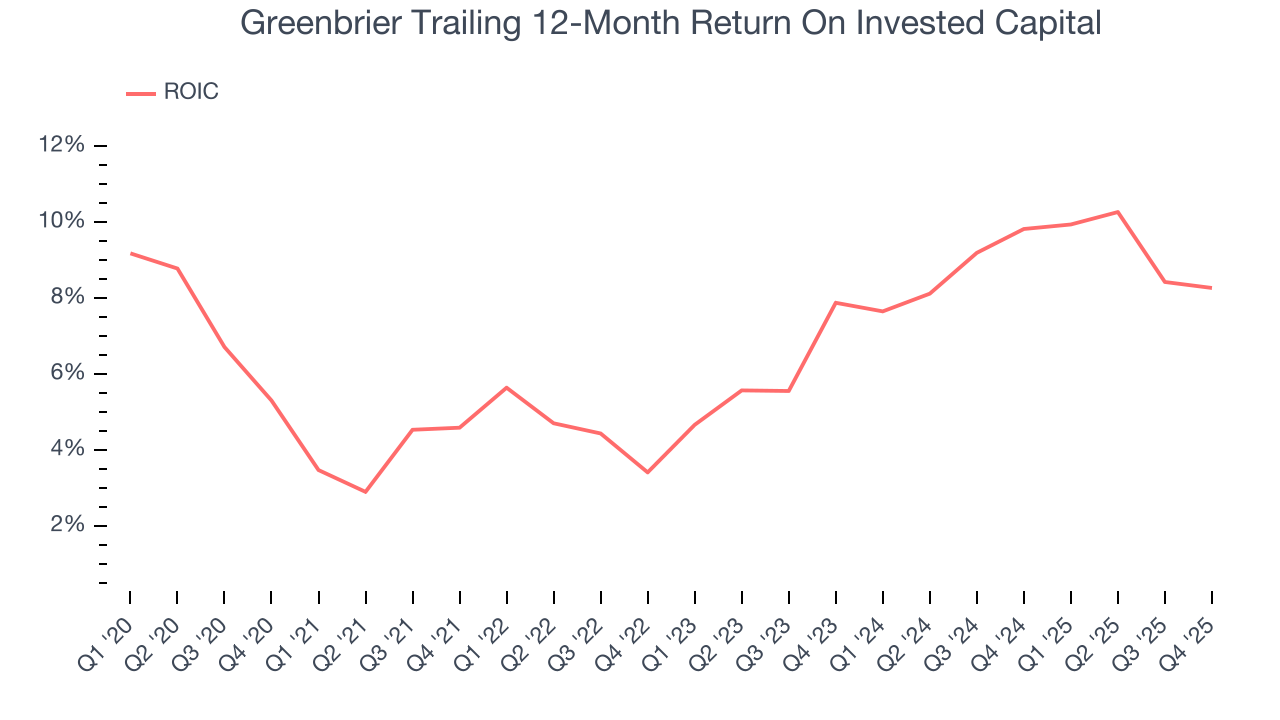
We like to invest in businesses with high returns, but the trend in a company’s ROIC is what often surprises the market and moves the stock price. Over the last few years, Greenbrier’s ROIC has increased. This is a good sign, and we hope the company can continue improving.
11. Balance Sheet Assessment
Greenbrier reported $375.4 million of cash and $1.77 billion of debt on its balance sheet in the most recent quarter. As investors in high-quality companies, we primarily focus on two things: 1) that a company’s debt level isn’t too high and 2) that its interest payments are not excessively burdening the business.
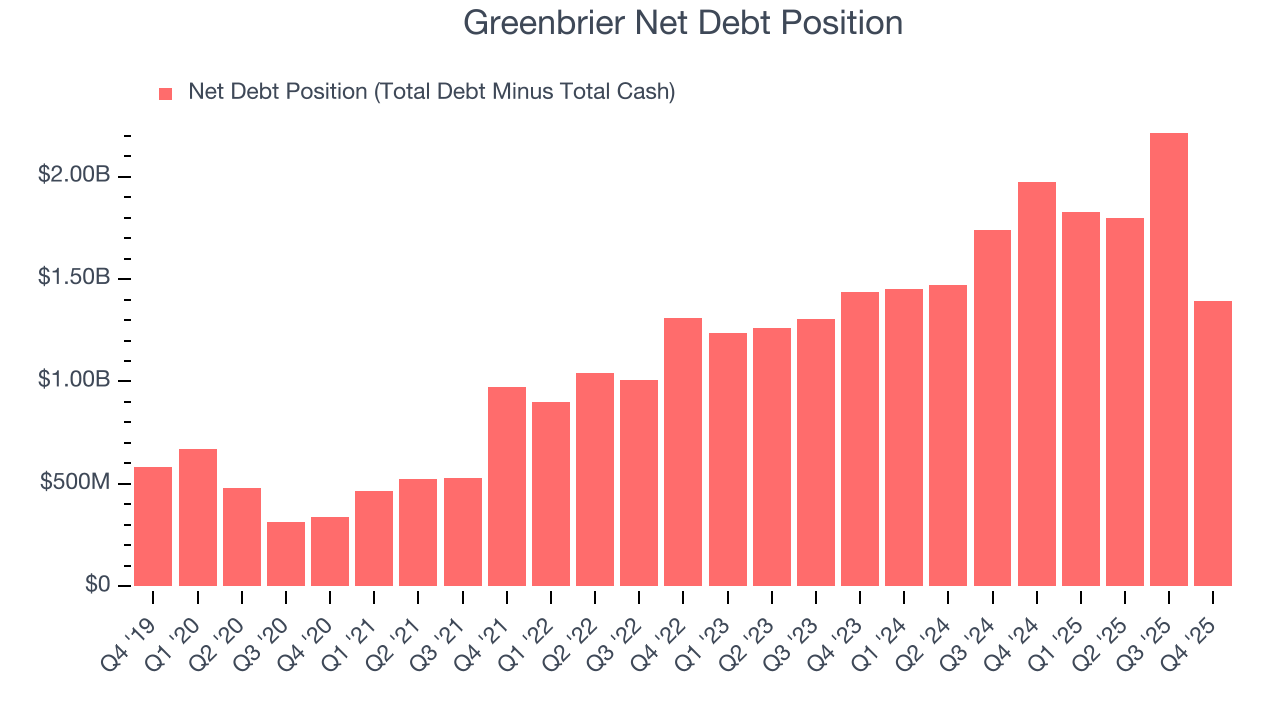
With $450.4 million of EBITDA over the last 12 months, we view Greenbrier’s 3.1× net-debt-to-EBITDA ratio as safe. We also see its $43.7 million of annual interest expenses as appropriate. The company’s profits give it plenty of breathing room, allowing it to continue investing in growth initiatives.
12. Key Takeaways from Greenbrier’s Q4 Results
It was good to see Greenbrier beat analysts’ EPS expectations this quarter. We were also excited its EBITDA outperformed Wall Street’s estimates by a wide margin. Zooming out, we think this was a good print with some key areas of upside. The stock remained flat at $53.70 immediately after reporting.
13. Is Now The Time To Buy Greenbrier?
Updated: March 14, 2026 at 11:23 PM EDT
A common mistake we notice when investors are deciding whether to buy a stock or not is that they simply look at the latest earnings results. Business quality and valuation matter more, so we urge you to understand these dynamics as well.
Greenbrier isn’t a terrible business, but it doesn’t pass our bar. First off, its revenue growth was uninspiring over the last five years, and analysts expect its demand to deteriorate over the next 12 months. While its rising cash profitability gives it more optionality, the downside is its projected EPS for the next year is lacking. On top of that, its cash burn raises the question of whether it can sustainably maintain growth.
Greenbrier’s P/E ratio based on the next 12 months is 13.7x. This valuation is reasonable, but the company’s shakier fundamentals present too much downside risk. We're pretty confident there are more exciting stocks to buy at the moment.
Wall Street analysts have a consensus one-year price target of $49.67 on the company (compared to the current share price of $51.78).