
REV Group (REVG)
We aren’t fans of REV Group. Its underwhelming revenue growth and failure to generate meaningful free cash flow is a concerning trend.― StockStory Analyst Team
1. News


2. Summary
Why REV Group Is Not Exciting
Offering the first full-electric North American fire truck, REV (NYSE:REVG) manufactures and sells specialty vehicles.
- Competitive supply chain dynamics and steep production costs are reflected in its low gross margin of 12.5%
- Muted 1.6% annual revenue growth over the last five years shows its demand lagged behind its industrials peers
- On the bright side, its incremental sales significantly boosted profitability as its annual earnings per share growth of 76.2% over the last five years outstripped its revenue performance


REV Group fails to meet our quality criteria. There are more promising prospects in the market.
Why There Are Better Opportunities Than REV Group


REV Group’s stock price of $67.08 implies a valuation ratio of 18x forward P/E. REV Group’s multiple may seem like a great deal among industrials peers, but we think there are valid reasons why it’s this cheap.
Cheap stocks can look like a great deal at first glance, but they can be value traps. They often have less earnings power, meaning there is more reliance on a re-rating to generate good returns - an unlikely scenario for low-quality companies.
3. REV Group (REVG) Research Report: Q3 CY2025 Update
Speciality vehicle provider REV (NYSE:REVG) announced better-than-expected revenue in Q3 CY2025, with sales up 11.1% year on year to $664.4 million. Its non-GAAP profit of $0.83 per share was 6.4% above analysts’ consensus estimates.
REV Group (REVG) Q3 CY2025 Highlights:
- Revenue: $664.4 million vs analyst estimates of $635.6 million (11.1% year-on-year growth, 4.5% beat)
- Adjusted EPS: $0.83 vs analyst estimates of $0.78 (6.4% beat)
- Adjusted EBITDA: $69.7 million vs analyst estimates of $62.2 million (10.5% margin, 12.1% beat)
- Operating Margin: 7.1%, up from 5.8% in the same quarter last year
- Free Cash Flow Margin: 8.1%, down from 10.6% in the same quarter last year
- Backlog: $4.64 billion at quarter end, up 3.7% year on year
- Market Capitalization: $2.72 billion
- On October 29, 2025, the Company entered into the Merger Agreement with Terex, Merger Sub 1 and Merger Sub 2, pursuant to which (1) the First Merger will occur, with REV continuing as the surviving corporation in the First Merger and (2) immediately following the First Merger, the Second Merger will occur, with Merger Sub 2 continuing as the surviving company in the Second Merger as a wholly owned subsidiary of Terex.
Company Overview
Offering the first full-electric North American fire truck, REV (NYSE:REVG) manufactures and sells specialty vehicles.
REV was formed in 2010 from the merger of four companies owned by American Industrial Partners: Collins, E-ONE, Halcore, and Fleetwood. After its merger, the company continued to grow by primarily targeting the acquisition of small to medium sized companies that would increase its existing fleet or add new offerings.
Today, REV manufactures and sells specialty vehicles from custom fire trucks and ambulances for municipalities to motorhomes and travel trailers. These motorhomes and travel trailers are popular among recreational vehicle enthusiasts and travelers for extended journeys and outdoor adventures. The company also offers aftermarket parts such as engines, brakes, and lights that are crucial for maintaining its vehicles.
It sells its vehicles through direct sales, dealer networks, and its own online platform. It partners with a network of dealerships across the U.S. that handle sales, servicing, and customer support. For larger contracts with municipalities, government agencies, and commercial operators, the company engages in direct sales and negotiations which typically involve bids and proposals. For its recreational vehicles, it negotiates contracts with dealerships for larger quantity sales and direct consumers for individual sales. It offers a lower per-unit cost for dealerships to incentivize larger quantity purchases.
4. Heavy Transportation Equipment
Heavy transportation equipment companies are investing in automated vehicles that increase efficiencies and connected machinery that collects actionable data. Some are also developing electric vehicles and mobility solutions to address customers’ concerns about carbon emissions, creating new sales opportunities. Additionally, they are increasingly offering automated equipment that increases efficiencies and connected machinery that collects actionable data. On the other hand, heavy transportation equipment companies are at the whim of economic cycles. Interest rates, for example, can greatly impact the construction and transport volumes that drive demand for these companies’ offerings.
Competitors offering similar products include Oshkosh (NYSE:OSK), Thor (NYSE:THO), Winnebago (NYSE:WGO), and Spartan Motors (NASDAQ:SPAR)
5. Revenue Growth
A company’s long-term sales performance can indicate its overall quality. Even a bad business can shine for one or two quarters, but a top-tier one grows for years. Unfortunately, REV Group’s 1.6% annualized revenue growth over the last five years was sluggish. This was below our standards and is a tough starting point for our analysis.
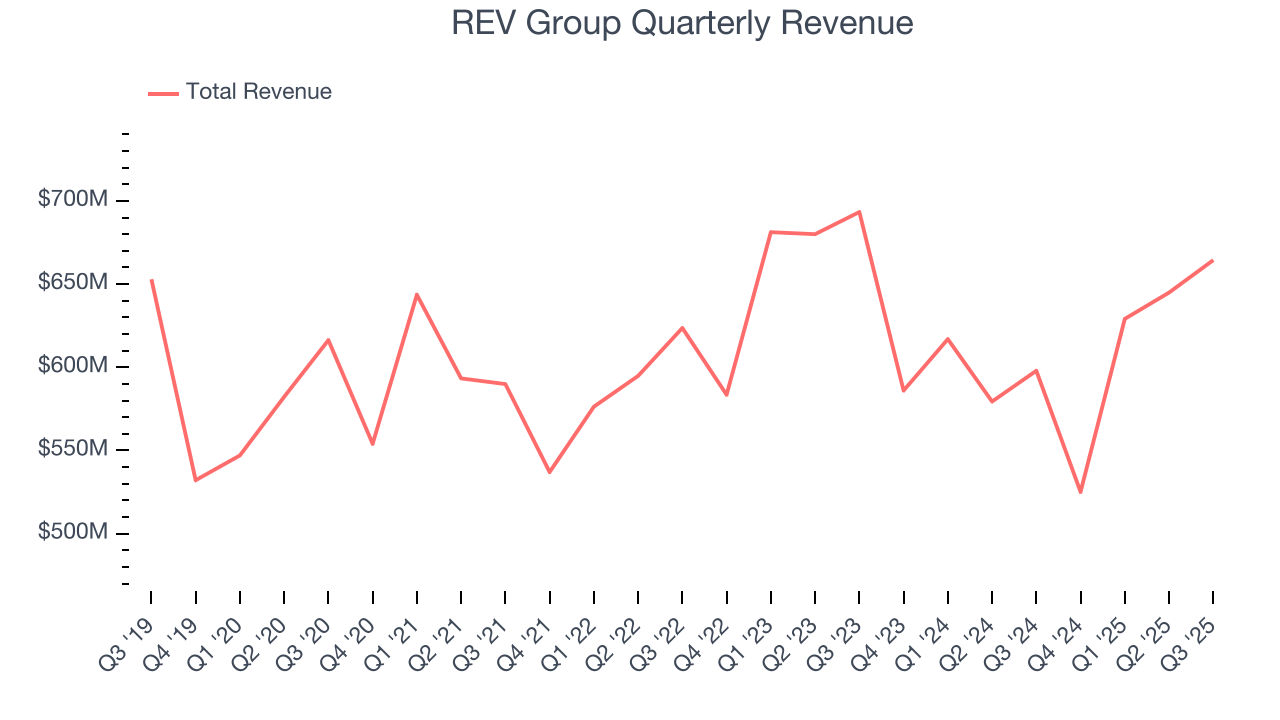
Long-term growth is the most important, but within industrials, a half-decade historical view may miss new industry trends or demand cycles. REV Group’s performance shows it grew in the past but relinquished its gains over the last two years, as its revenue fell by 3.4% annually. REV Group isn’t alone in its struggles as the Heavy Transportation Equipment industry experienced a cyclical downturn, with many similar businesses observing lower sales at this time. 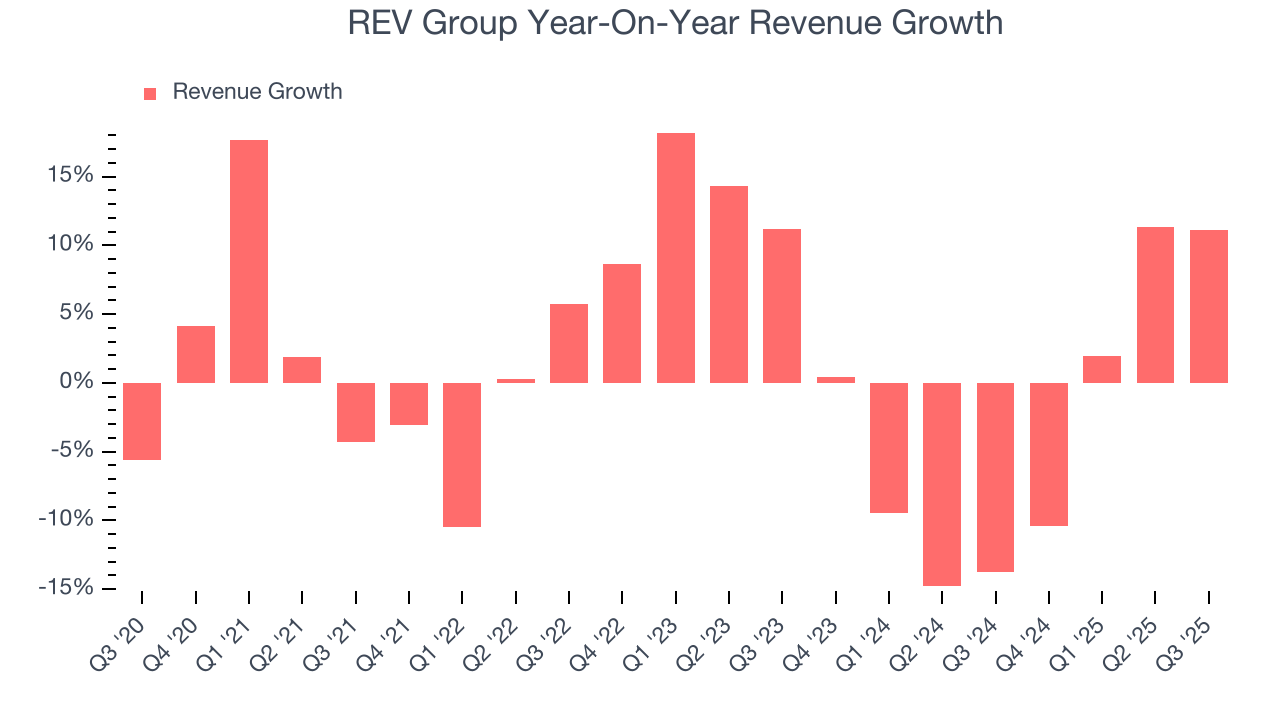
We can better understand the company’s revenue dynamics by analyzing its backlog, or the value of its outstanding orders that have not yet been executed or delivered. REV Group’s backlog reached $4.64 billion in the latest quarter and averaged 3.7% year-on-year growth over the last two years. Because this number is better than its revenue growth, we can see the company accumulated more orders than it could fulfill and deferred revenue to the future. This could imply elevated demand for REV Group’s products and services but raises concerns about capacity constraints. 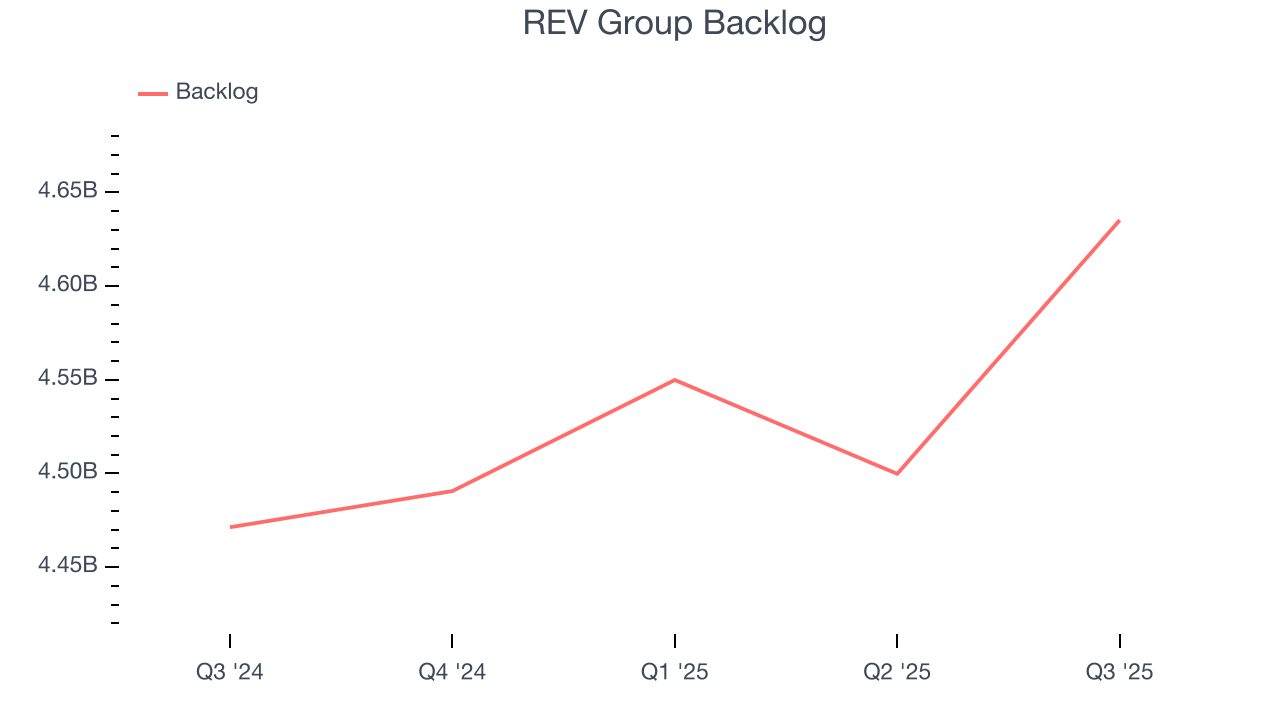
This quarter, REV Group reported year-on-year revenue growth of 11.1%, and its $664.4 million of revenue exceeded Wall Street’s estimates by 4.5%.
Looking ahead, sell-side analysts expect revenue to grow 6.5% over the next 12 months. While this projection indicates its newer products and services will catalyze better top-line performance, it is still below average for the sector.
6. Gross Margin & Pricing Power
Cost of sales for an industrials business is usually comprised of the direct labor, raw materials, and supplies needed to offer a product or service. These costs can be impacted by inflation and supply chain dynamics.
REV Group has bad unit economics for an industrials business, signaling it operates in a competitive market. As you can see below, it averaged a 12.5% gross margin over the last five years. That means REV Group paid its suppliers a lot of money ($87.52 for every $100 in revenue) to run its business. 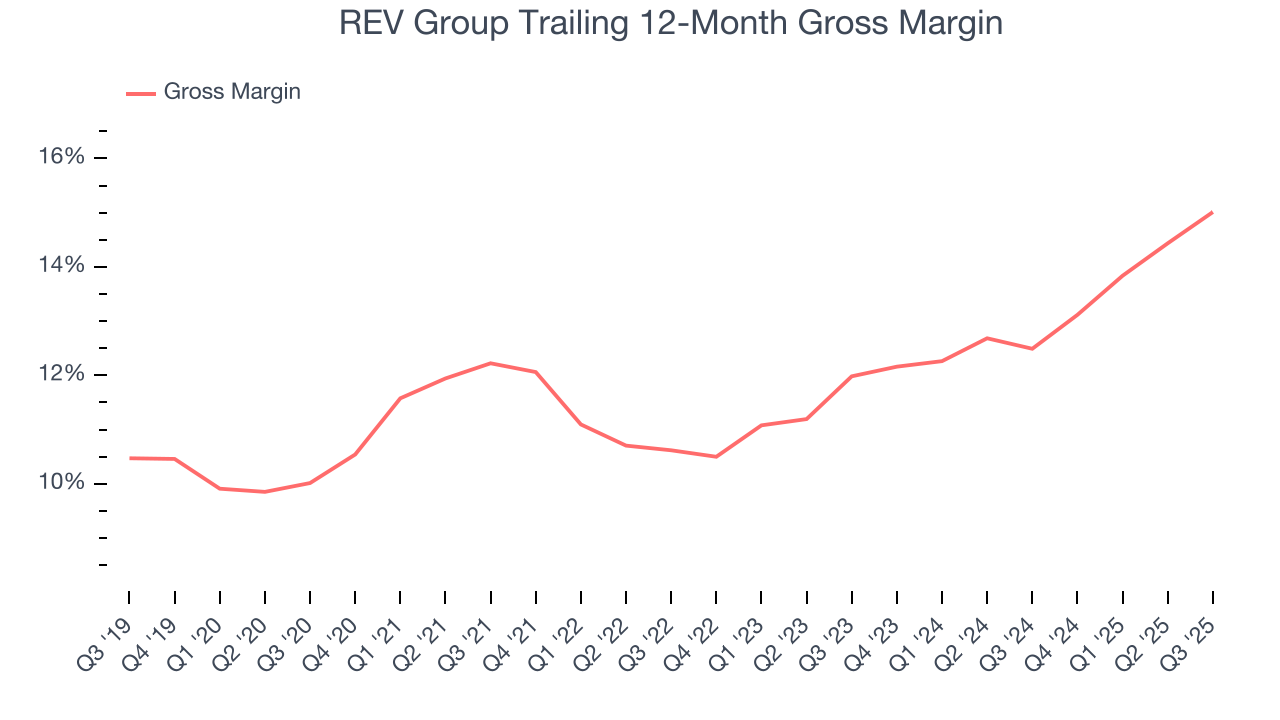
In Q3, REV Group produced a 15.4% gross profit margin, up 2.3 percentage points year on year. REV Group’s full-year margin has also been trending up over the past 12 months, increasing by 2.5 percentage points. If this move continues, it could suggest better unit economics due to more leverage from its growing sales on the fixed portion of its cost of goods sold (such as manufacturing expenses).
7. Operating Margin
REV Group was profitable over the last five years but held back by its large cost base. Its average operating margin of 3.9% was weak for an industrials business. This result isn’t too surprising given its low gross margin as a starting point.
On the plus side, REV Group’s operating margin rose by 3.9 percentage points over the last five years, as its sales growth gave it operating leverage.
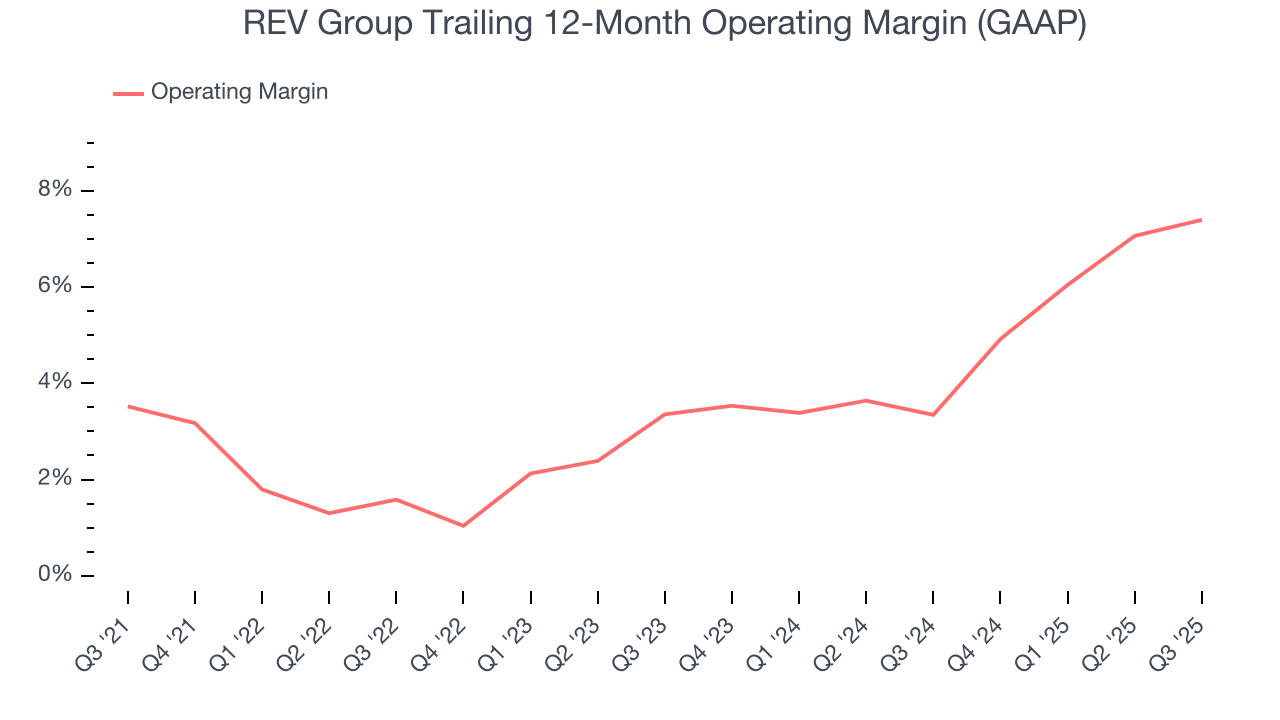
In Q3, REV Group generated an operating margin profit margin of 7.1%, up 1.4 percentage points year on year. Since its gross margin expanded more than its operating margin, we can infer that leverage on its cost of sales was the primary driver behind the recently higher efficiency.
8. Earnings Per Share
Revenue trends explain a company’s historical growth, but the long-term change in earnings per share (EPS) points to the profitability of that growth – for example, a company could inflate its sales through excessive spending on advertising and promotions.
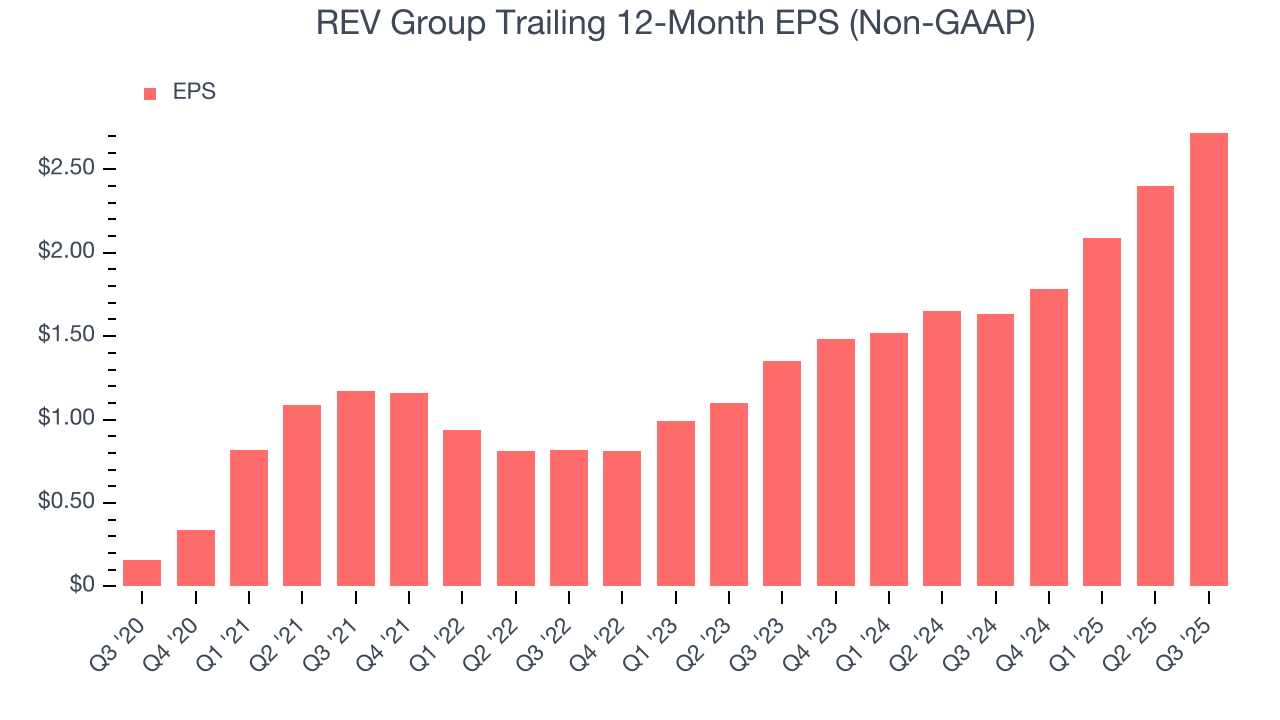
REV Group’s EPS grew at an astounding 76.2% compounded annual growth rate over the last five years, higher than its 1.6% annualized revenue growth. This tells us the company became more profitable on a per-share basis as it expanded.
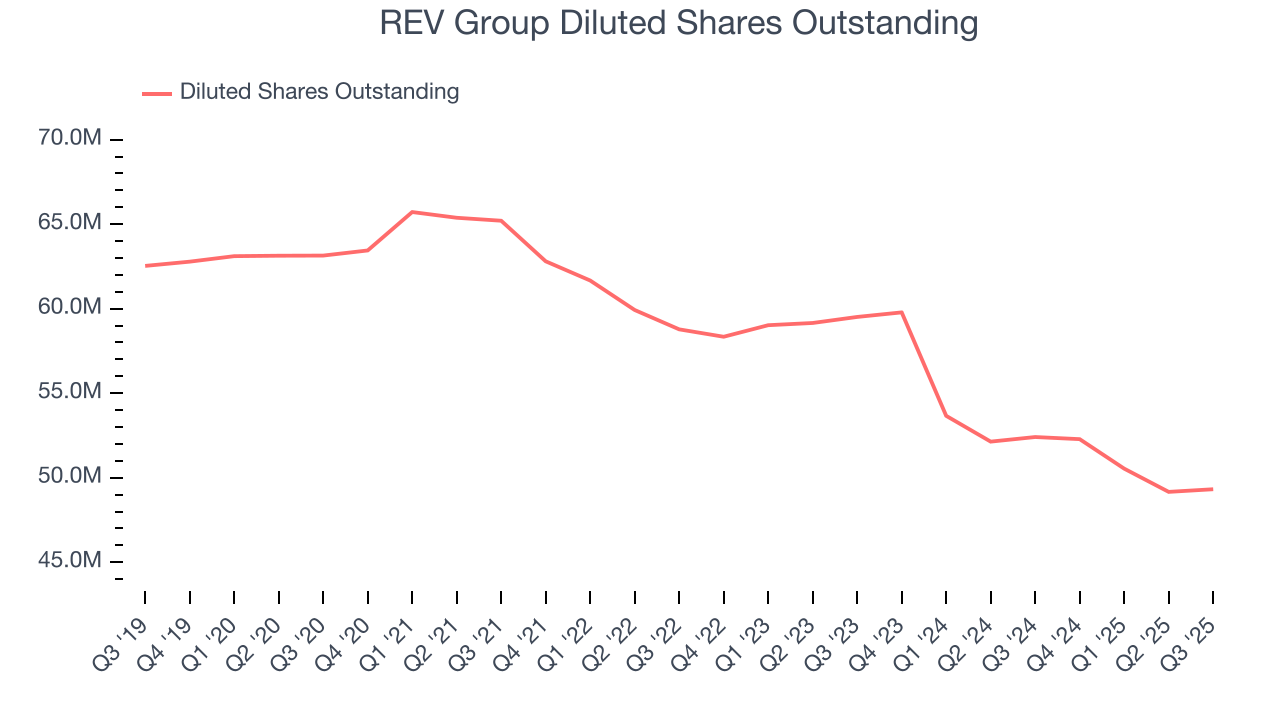
We can take a deeper look into REV Group’s earnings to better understand the drivers of its performance. As we mentioned earlier, REV Group’s operating margin expanded by 3.9 percentage points over the last five years. On top of that, its share count shrank by 21.9%. These are positive signs for shareholders because improving profitability and share buybacks turbocharge EPS growth relative to revenue growth.
Like with revenue, we analyze EPS over a more recent period because it can provide insight into an emerging theme or development for the business.
For REV Group, its two-year annual EPS growth of 41.9% was lower than its five-year trend. We still think its growth was good and hope it can accelerate in the future.
In Q3, REV Group reported adjusted EPS of $0.83, up from $0.51 in the same quarter last year. This print beat analysts’ estimates by 6.4%. Over the next 12 months, Wall Street expects REV Group’s full-year EPS of $2.72 to grow 29.3%.
9. Cash Is King
If you’ve followed StockStory for a while, you know we emphasize free cash flow. Why, you ask? We believe that in the end, cash is king, and you can’t use accounting profits to pay the bills.
REV Group has shown weak cash profitability over the last five years, giving the company limited opportunities to return capital to shareholders. Its free cash flow margin averaged 4.2%, subpar for an industrials business.
Taking a step back, an encouraging sign is that REV Group’s margin expanded by 2.1 percentage points during that time. We have no doubt shareholders would like to continue seeing its cash conversion rise as it gives the company more optionality.
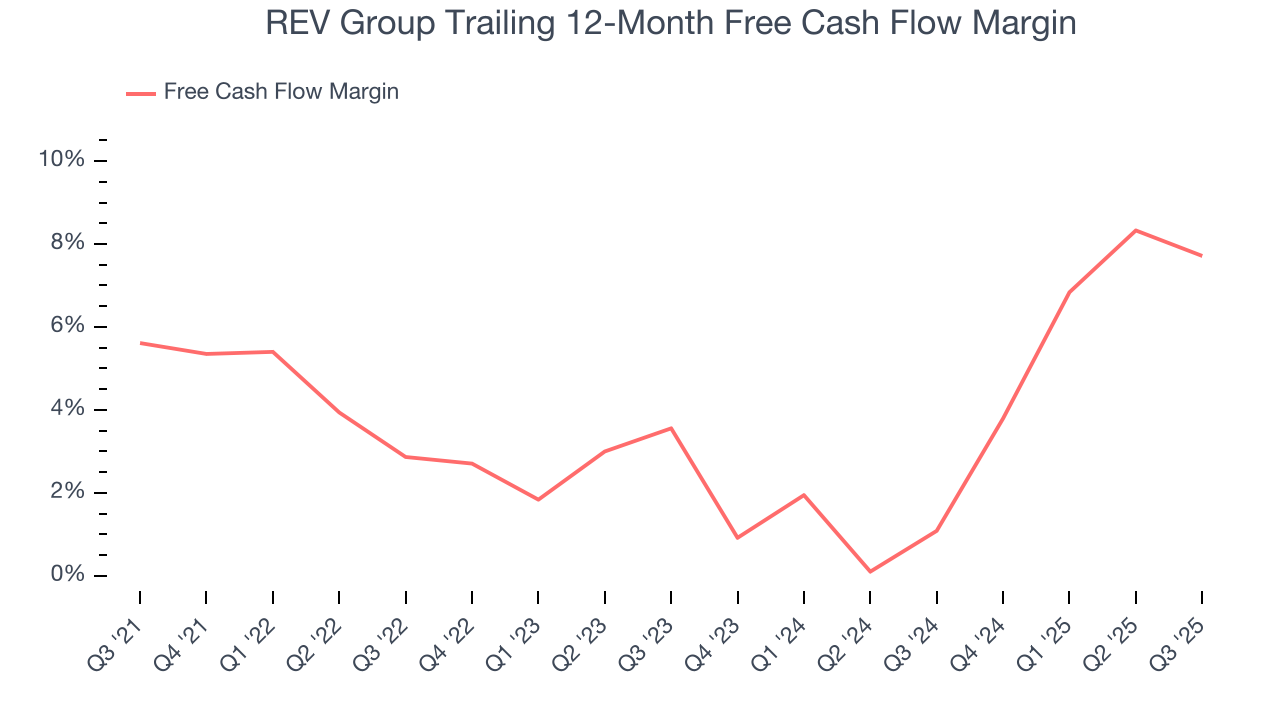
REV Group’s free cash flow clocked in at $53.7 million in Q3, equivalent to a 8.1% margin. The company’s cash profitability regressed as it was 2.5 percentage points lower than in the same quarter last year, but it’s still above its five-year average. We wouldn’t put too much weight on this quarter’s decline because investment needs can be seasonal, causing short-term swings. Long-term trends carry greater meaning.
10. Return on Invested Capital (ROIC)
EPS and free cash flow tell us whether a company was profitable while growing its revenue. But was it capital-efficient? A company’s ROIC explains this by showing how much operating profit it makes compared to the money it has raised (debt and equity).
Although REV Group hasn’t been the highest-quality company lately because of its poor top-line performance, it found a few growth initiatives in the past that worked out wonderfully. Its five-year average ROIC was 18.9%, splendid for an industrials business.
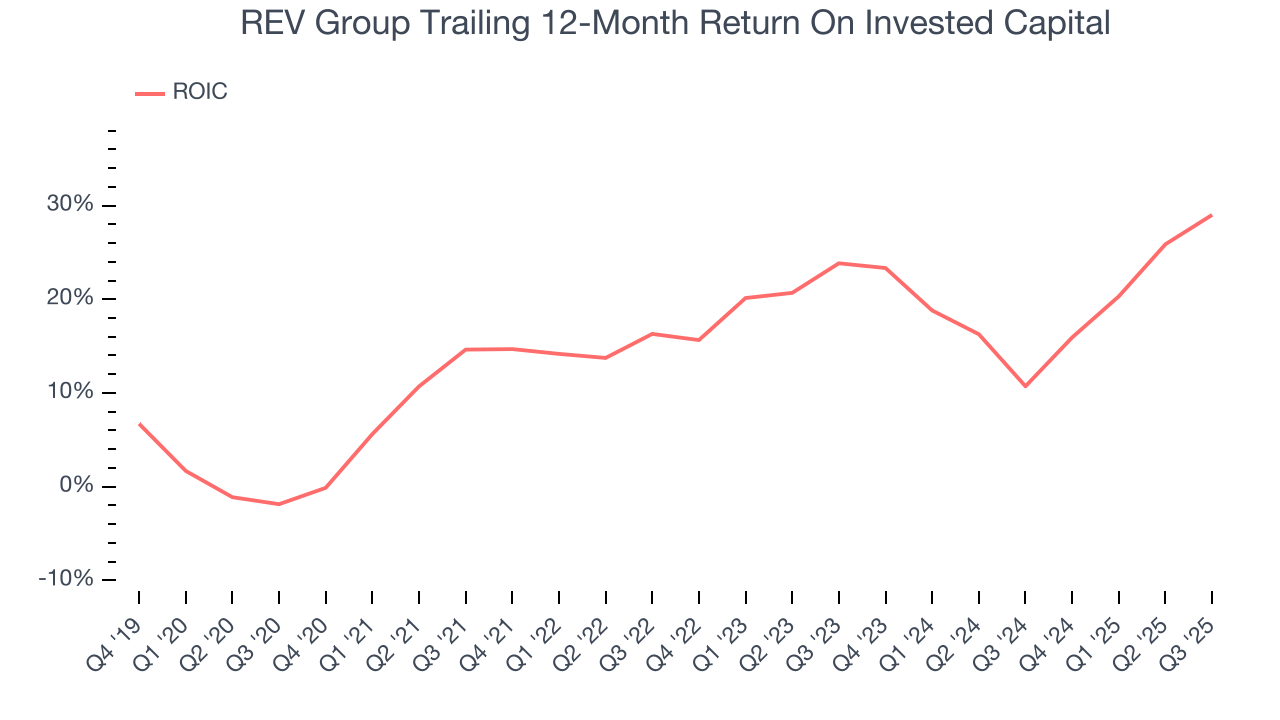
We like to invest in businesses with high returns, but the trend in a company’s ROIC is what often surprises the market and moves the stock price. Fortunately, REV Group’s ROIC averaged 4.4 percentage point increases over the last few years. This is a good sign, and if its returns keep rising, there’s a chance it could evolve into an investable business.
11. Balance Sheet Assessment
REV Group reported $34.7 million of cash and $61.2 million of debt on its balance sheet in the most recent quarter. As investors in high-quality companies, we primarily focus on two things: 1) that a company’s debt level isn’t too high and 2) that its interest payments are not excessively burdening the business.
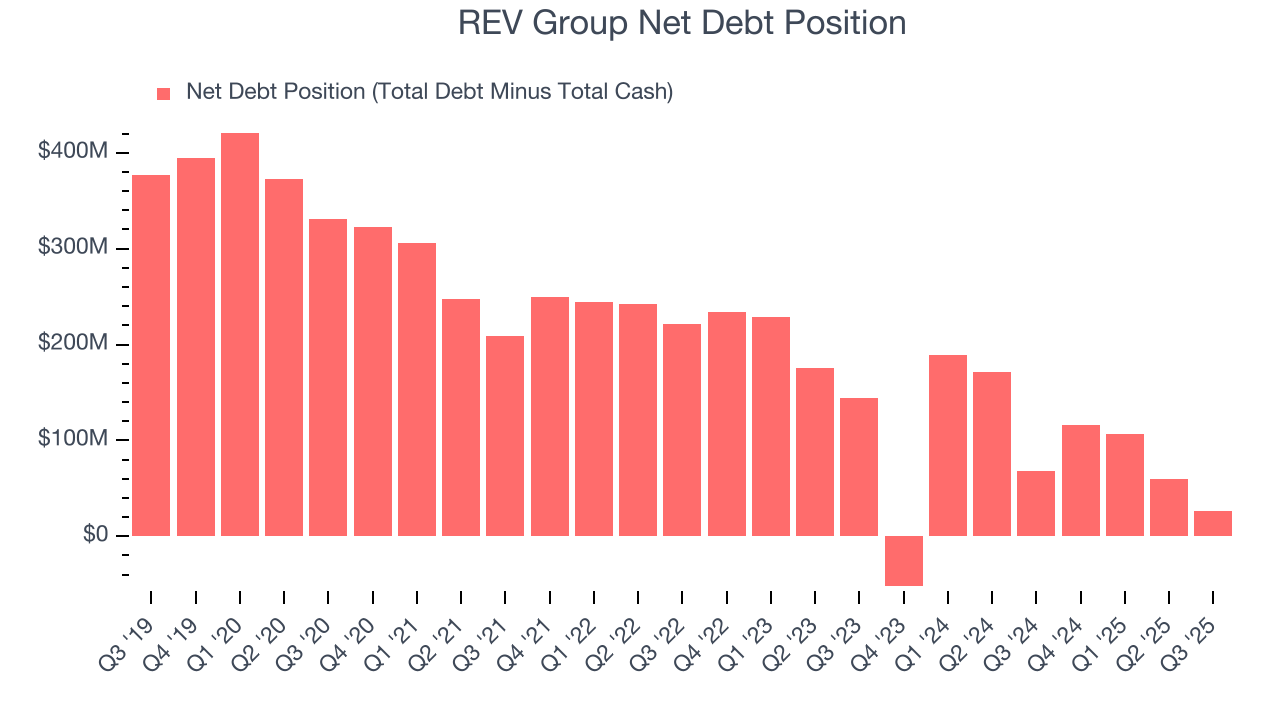
With $229.5 million of EBITDA over the last 12 months, we view REV Group’s 0.1× net-debt-to-EBITDA ratio as safe. We also see its $12.5 million of annual interest expenses as appropriate. The company’s profits give it plenty of breathing room, allowing it to continue investing in growth initiatives.
12. Key Takeaways from REV Group’s Q3 Results
We were impressed by how significantly REV Group blew past analysts’ EBITDA expectations this quarter. We were also excited its revenue outperformed Wall Street’s estimates by a wide margin. Zooming out, we think this was a solid print. The stock remained flat at $56.04 immediately after reporting.
13. Is Now The Time To Buy REV Group?
Updated: January 26, 2026 at 10:37 PM EST
When considering an investment in REV Group, investors should account for its valuation and business qualities as well as what’s happened in the latest quarter.
REV Group has some positive attributes, but it isn’t one of our picks. Although its revenue growth was weak over the last five years, its growth over the next 12 months is expected to be higher. And while REV Group’s low gross margins indicate some combination of competitive pressures and high production costs, its astounding EPS growth over the last five years shows its profits are trickling down to shareholders.
REV Group’s P/E ratio based on the next 12 months is 18x. This valuation multiple is fair, but we don’t have much faith in the company. We're fairly confident there are better stocks to buy right now.
Wall Street analysts have a consensus one-year price target of $66 on the company (compared to the current share price of $67.08).