
Genesco (GCO)
Genesco is up against the odds. Its weak sales growth and low returns on capital show it struggled to generate demand and profits.― StockStory Analyst Team
1. News
2. Summary
Why We Think Genesco Will Underperform
Spanning a broad range of styles, brands, and prices, Genesco (NYSE:GCO) sells footwear, apparel, and accessories through multiple brands and banners.
- Muted 6.4% annual revenue growth over the last five years shows its demand lagged behind its consumer discretionary peers
- Projected sales are flat for the next 12 months, implying demand will slow from its two-year trend
- 5× net-debt-to-EBITDA ratio makes lenders less willing to extend additional capital, potentially necessitating dilutive equity offerings


Genesco’s quality is inadequate. We see more attractive opportunities in the market.
Why There Are Better Opportunities Than Genesco


At $25.01 per share, Genesco trades at 11.9x forward P/E. This multiple is lower than most consumer discretionary companies, but for good reason.
Our advice is to pay up for elite businesses whose advantages are tailwinds to earnings growth. Don’t get sucked into lower-quality businesses just because they seem like bargains. These mediocre businesses often never achieve a higher multiple as hoped, a phenomenon known as a “value trap”.
3. Genesco (GCO) Research Report: Q4 CY2025 Update
Footwear, apparel, and accessories retailer Genesco (NYSE:GCO) reported Q4 CY2025 results topping the market’s revenue expectations, with sales up 7.2% year on year to $799.9 million. Its non-GAAP profit of $3.74 per share was 4.3% above analysts’ consensus estimates.
Genesco (GCO) Q4 CY2025 Highlights:
- Revenue: $799.9 million vs analyst estimates of $787 million (7.2% year-on-year growth, 1.6% beat)
- Adjusted EPS: $3.74 vs analyst estimates of $3.59 (4.3% beat)
- Adjusted EPS guidance for the upcoming financial year 2027 is $2.10 at the midpoint, beating analyst estimates by 8.7%
- Operating Margin: 6.4%, in line with the same quarter last year
- Locations: 1,236 at quarter end, down from 1,278 in the same quarter last year
- Same-Store Sales rose 9% year on year (10% in the same quarter last year)
- Market Capitalization: $281.6 million
Company Overview
Spanning a broad range of styles, brands, and prices, Genesco (NYSE:GCO) sells footwear, apparel, and accessories through multiple brands and banners.
These include Journeys, Johnston & Murphy, and Lids, among other smaller brands. Journeys is a teen-focused shoe retailer featuring brands like Dr. Martens, Vans, and Adidas. Johnston & Murphy offers its own brand of men's dress shoes and apparel, and Lids is known for its casual hats such as baseball caps and beanies featuring sports teams.
The Genesco core customer is therefore somewhat varied. A teen shopper may head to Journeys and Lids during a trip to the mall for some new sneakers and hats while his/her dad may make his way to Johnsyon & Murphy for some new dress shoes for the office. While there is no unifying aesthetic or style, all Genesco brands tend to be mid-priced. Additionally, Genesco's stores tend to be fairly small, roughly 2,500 square feet, and located in malls and shopping centers in urban and suburban areas. Genesco supplements its physical store footprint with e-commerce presences for each of its brands, all of which were launched in 2009.
4. Consumer Discretionary - Footwear
The Consumer Discretionary sector, by definition, is made up of companies selling non-essential goods and services. When economic conditions deteriorate or tastes shift, consumers can easily cut back or eliminate these purchases. For long-term investors with five-year holding periods, this creates a structural challenge: the sector is inherently hit-driven, with low switching costs and fickle customers. As a result, only a handful of companies can reliably grow demand and compound earnings over long periods, which is why our bar is high and High Quality ratings are rare.
Footwear companies design, manufacture, and market shoes across athletic, casual, and luxury segments. Tailwinds include the global athleisure trend, growing health and fitness awareness driving sneaker demand, and expanding direct-to-consumer digital channels that improve brand control and margins. However, headwinds are notable: the industry faces intense competition and brand-switching behavior, heavy marketing spend requirements to maintain relevance, and exposure to volatile raw material and freight costs. Tariff risk from concentrated overseas manufacturing, primarily in Asia, remains a persistent concern. Additionally, inventory management is challenging given seasonal and trend-driven demand, with markdowns eroding profitability when styles miss consumer expectations.
Retail competitors offering mid-priced footwear and accessories include Foot Locker (NYSE:FL), Designer Brands’s (NYSE:DBI) DSW banner, and TJX (NYSE:TJX).
5. Revenue Growth
A company’s long-term sales performance can indicate its overall quality. Any business can experience short-term success, but top-performing ones enjoy sustained growth for years. Regrettably, Genesco’s sales grew at a weak 6.4% compounded annual growth rate over the last five years. This fell short of our benchmark for the consumer discretionary sector and is a poor baseline for our analysis.
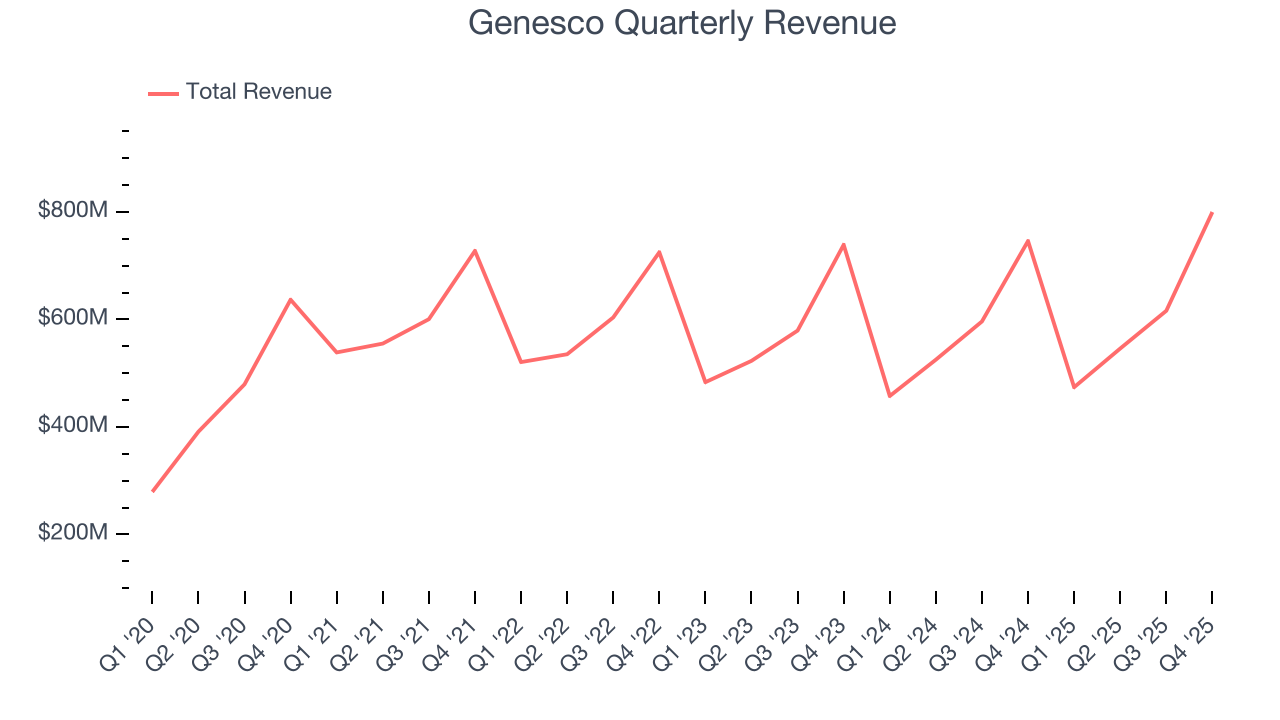
We at StockStory place the most emphasis on long-term growth, but within consumer discretionary, a stretched historical view may miss a company riding a successful new product or trend. Genesco’s recent performance shows its demand has slowed as its annualized revenue growth of 2.4% over the last two years was below its five-year trend. We’re wary when companies in the sector see decelerations in revenue growth, as it could signal changing consumer tastes aided by low switching costs. 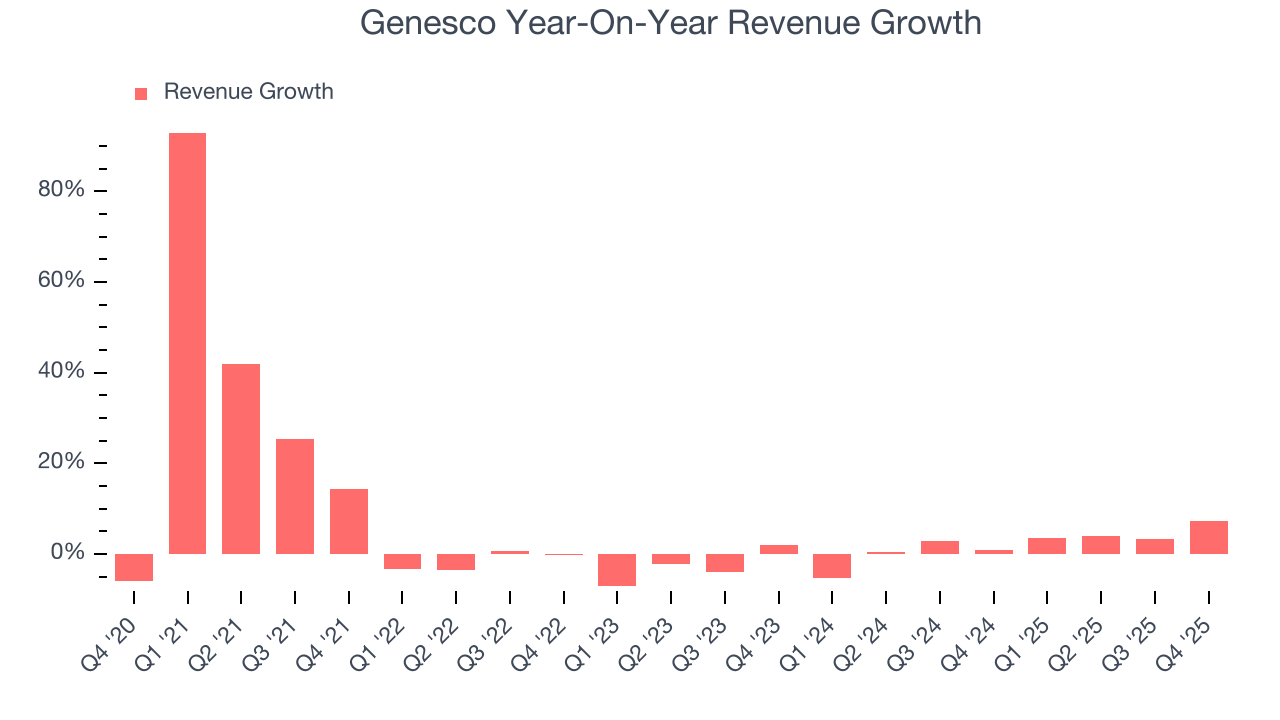
We can dig further into the company’s revenue dynamics by analyzing its same-store sales, which show how much revenue its established locations generate. Over the last two years, Genesco’s same-store sales averaged 3.8% year-on-year growth. This number doesn’t surprise us as it’s in line with its revenue growth. 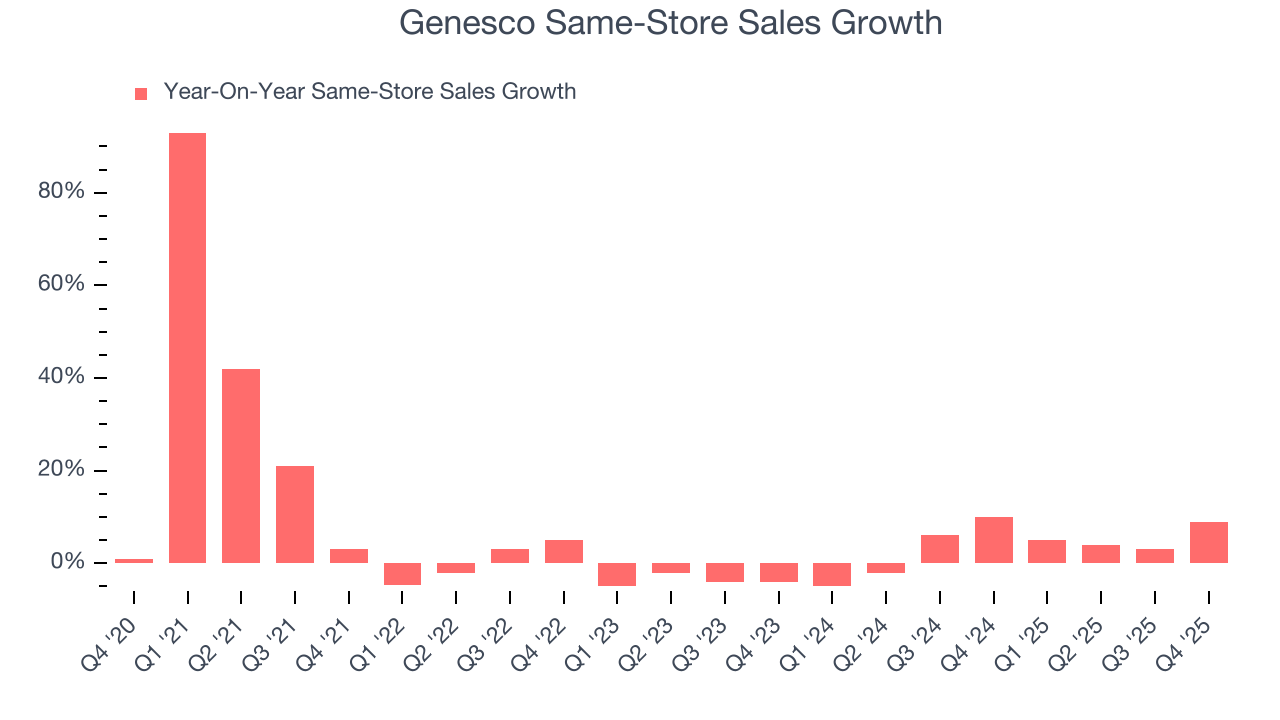
This quarter, Genesco reported year-on-year revenue growth of 7.2%, and its $799.9 million of revenue exceeded Wall Street’s estimates by 1.6%.
Looking ahead, sell-side analysts expect revenue to remain flat over the next 12 months, a slight deceleration versus the last two years. This projection is underwhelming and indicates its products and services will see some demand headwinds.
6. Operating Margin
Operating margin is an important measure of profitability as it shows the portion of revenue left after accounting for all core expenses – everything from the cost of goods sold to advertising and wages. It’s also useful for comparing profitability across companies with different levels of debt and tax rates because it excludes interest and taxes.
Genesco’s operating margin has more or less stayed the same over the last 12 months . The company broke even over the last two years, inadequate for a consumer discretionary business. Its large expense base and inefficient cost structure were the main culprits behind this performance.
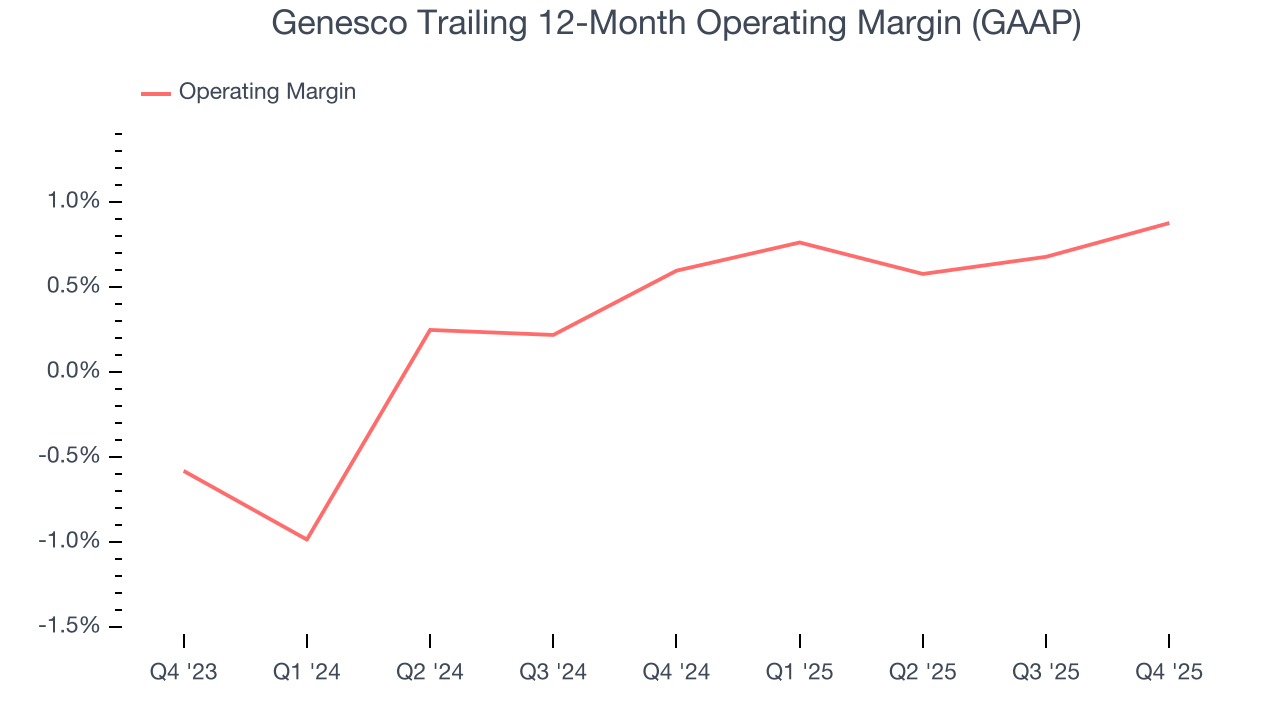
In Q4, Genesco generated an operating margin profit margin of 6.4%, in line with the same quarter last year. This indicates the company’s overall cost structure has been relatively stable.
7. Earnings Per Share
We track the long-term change in earnings per share (EPS) for the same reason as long-term revenue growth. Compared to revenue, however, EPS highlights whether a company’s growth is profitable.
Genesco’s full-year EPS flipped from negative to positive over the last five years. This is encouraging and shows it’s at a critical moment in its life.
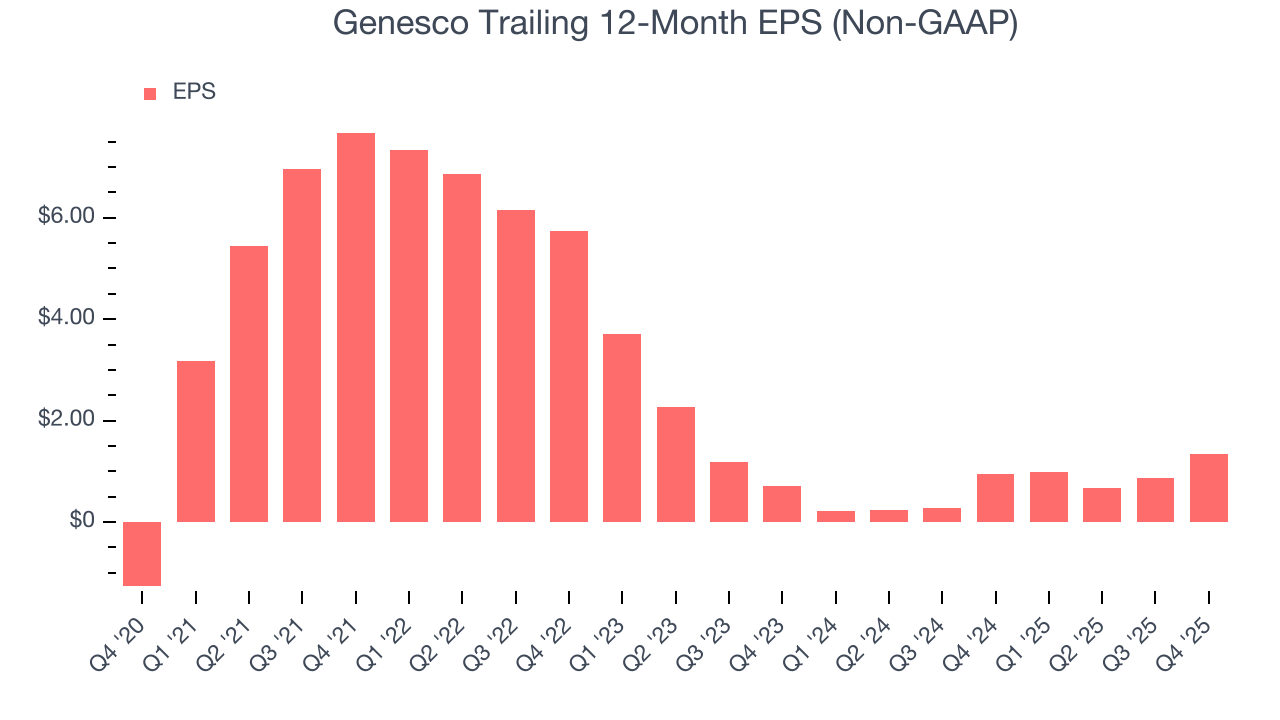
In Q4, Genesco reported adjusted EPS of $3.74, up from $3.26 in the same quarter last year. This print beat analysts’ estimates by 4.3%. Over the next 12 months, Wall Street expects Genesco’s full-year EPS of $1.34 to grow 45.8%.
8. Cash Is King
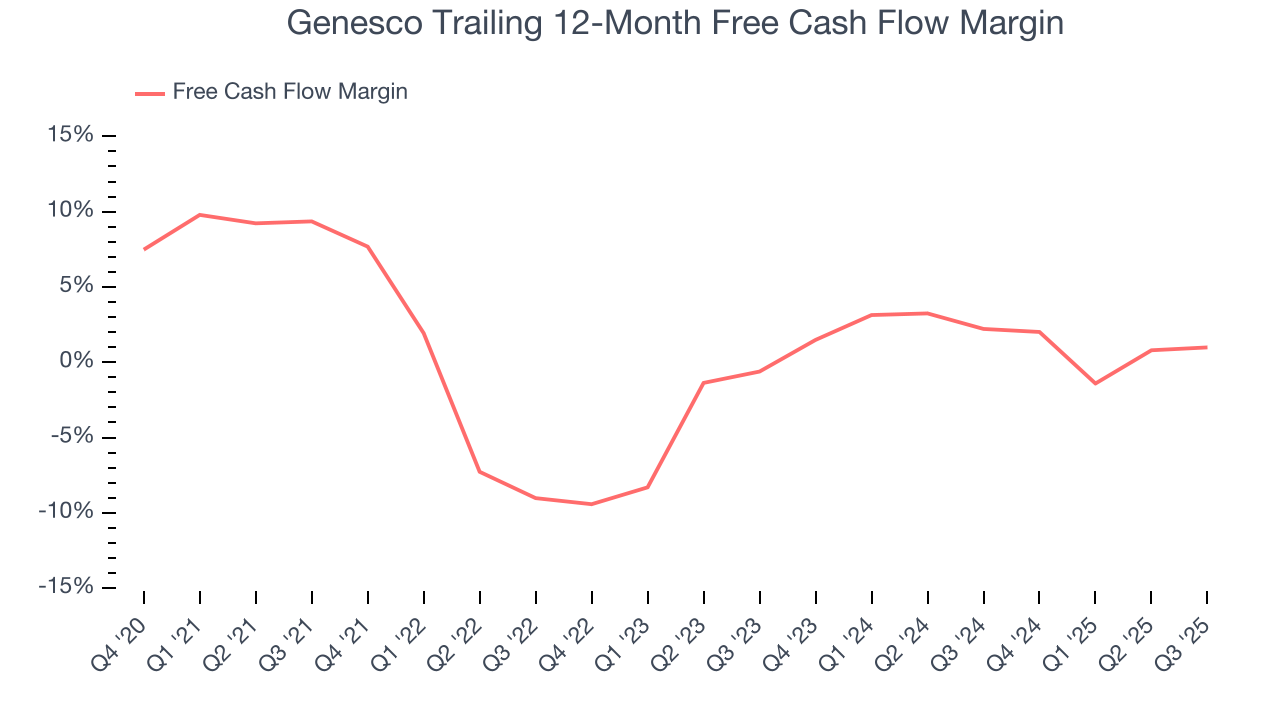
If you’ve followed StockStory for a while, you know we emphasize free cash flow. Why, you ask? We believe that in the end, cash is king, and you can’t use accounting profits to pay the bills.
Genesco broke even from a free cash flow perspective over the last two years, giving the company limited opportunities to return capital to shareholders.
9. Return on Invested Capital (ROIC)
EPS and free cash flow tell us whether a company was profitable while growing its revenue. But was it capital-efficient? A company’s ROIC explains this by showing how much operating profit it makes compared to the money it has raised (debt and equity).
Genesco historically did a mediocre job investing in profitable growth initiatives. Its five-year average ROIC was 4.1%, lower than the typical cost of capital (how much it costs to raise money) for consumer discretionary companies.
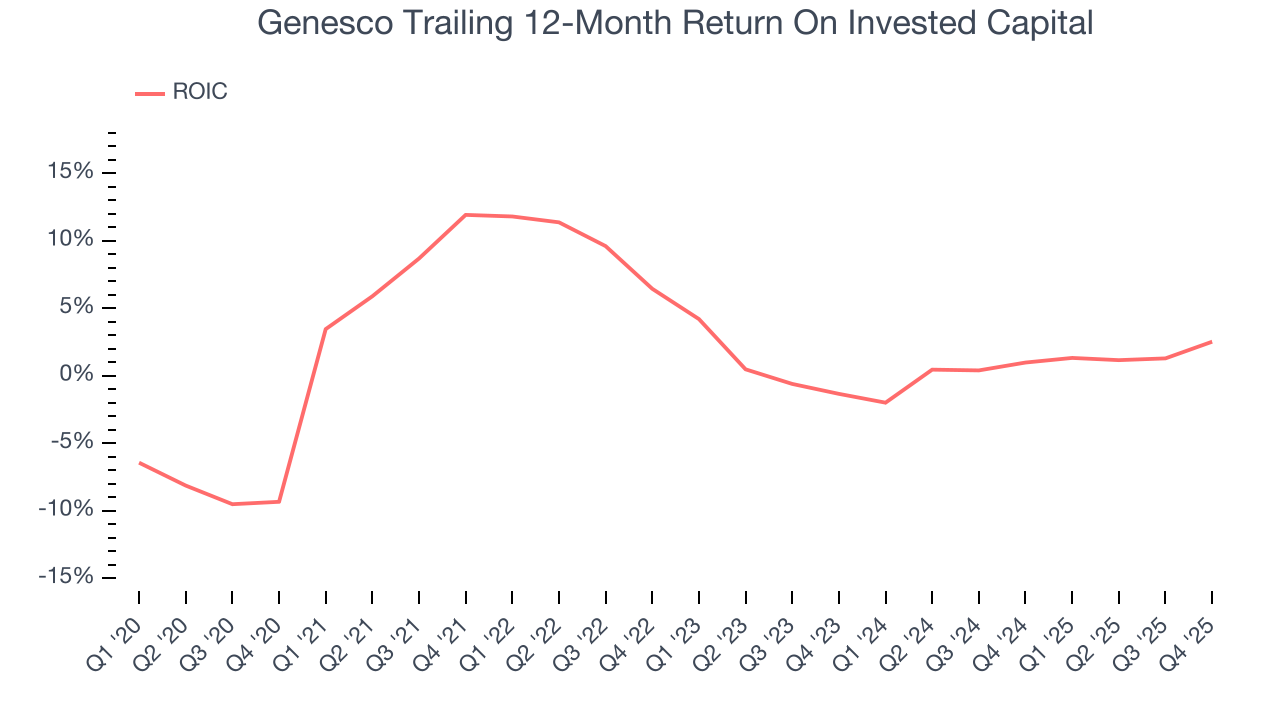
We like to invest in businesses with high returns, but the trend in a company’s ROIC is what often surprises the market and moves the stock price. Unfortunately, Genesco’s ROIC has decreased over the last few years. Paired with its already low returns, these declines suggest its profitable growth opportunities are few and far between.
10. Balance Sheet Risk
As long-term investors, the risk we care about most is the permanent loss of capital, which can happen when a company goes bankrupt or raises money from a disadvantaged position. This is separate from short-term stock price volatility, something we are much less bothered by.
Genesco’s $521.4 million of debt exceeds the $105.4 million of cash on its balance sheet. Furthermore, its 5× net-debt-to-EBITDA ratio (based on its EBITDA of $79.96 million over the last 12 months) shows the company is overleveraged.
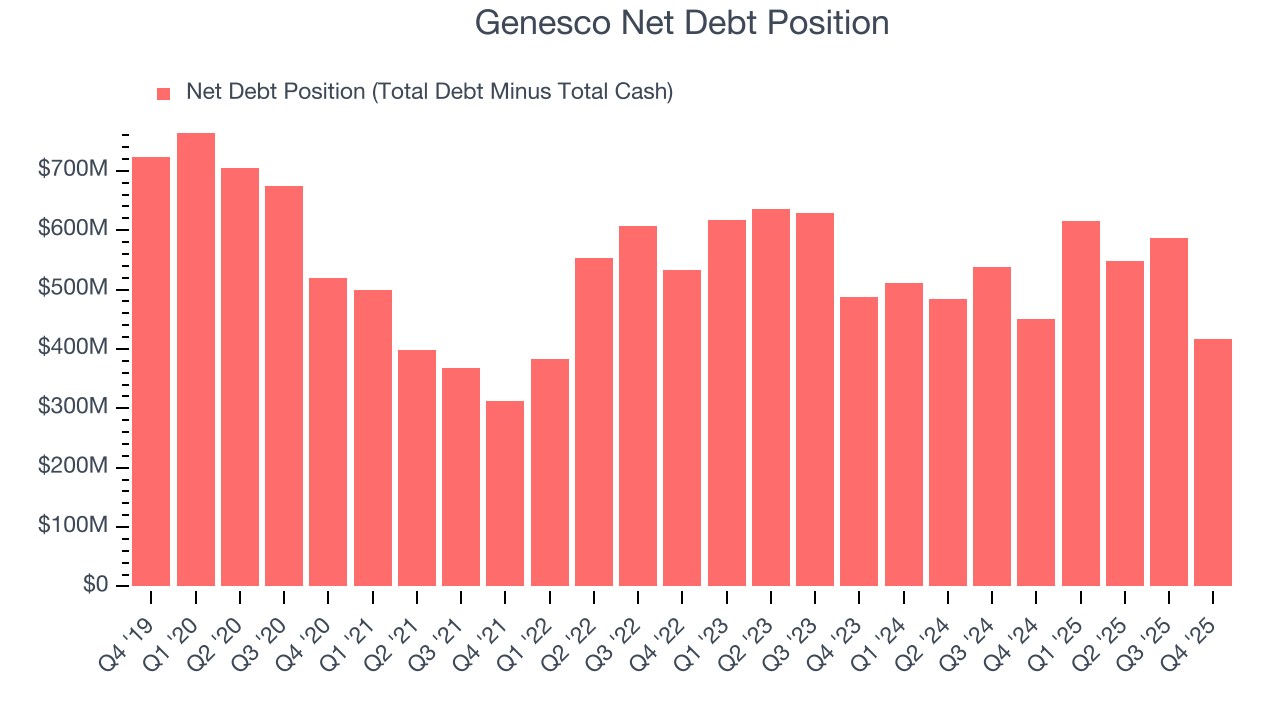
At this level of debt, incremental borrowing becomes increasingly expensive and credit agencies could downgrade the company’s rating if profitability falls. Genesco could also be backed into a corner if the market turns unexpectedly – a situation we seek to avoid as investors in high-quality companies.
We hope Genesco can improve its balance sheet and remain cautious until it increases its profitability or pays down its debt.
11. Key Takeaways from Genesco’s Q4 Results
It was great to see Genesco’s full-year EPS guidance top analysts’ expectations. We were also glad its revenue and EPS both outperformed Wall Street’s estimates in the quarter. Zooming out, we think this was a very good print with some key areas of upside. The stock traded up 7.5% to $28.05 immediately following the results.
12. Is Now The Time To Buy Genesco?
Updated: March 14, 2026 at 10:40 PM EDT
Before deciding whether to buy Genesco or pass, we urge investors to consider business quality, valuation, and the latest quarterly results.
Genesco doesn’t pass our quality test. While its projected EPS for the next year implies the company’s fundamentals will improve, the downside is its same-store sales performance has disappointed. On top of that, its relatively low ROIC suggests management has struggled to find compelling investment opportunities.
Genesco’s P/E ratio based on the next 12 months is 11.9x. This valuation tells us a lot of optimism is priced in - we think there are better opportunities elsewhere.
Wall Street analysts have a consensus one-year price target of $36 on the company (compared to the current share price of $25.01).
Although the price target is bullish, readers should exercise caution because analysts tend to be overly optimistic. The firms they work for, often big banks, have relationships with companies that extend into fundraising, M&A advisory, and other rewarding business lines. As a result, they typically hesitate to say bad things for fear they will lose out. We at StockStory do not suffer from such conflicts of interest, so we’ll always tell it like it is.