
Griffon (GFF)
Griffon doesn’t excite us. Its sluggish sales growth shows demand is soft, a worrisome sign for investors in high-quality stocks.― StockStory Analyst Team
1. News


2. Summary
Why Griffon Is Not Exciting
Initially in the defense industry, Griffon (NYSE:GFF) is a now diversified company specializing in home improvement, professional equipment, and building products.
- Sales are projected to tank by 28.7% over the next 12 months as its demand continues evaporating
- Sales trends were unexciting over the last five years as its 1.5% annual growth was below the typical industrials company
- A silver lining is that its additional sales over the last five years increased its profitability as the 25.7% annual growth in its earnings per share outpaced its revenue


Griffon’s quality doesn’t meet our hurdle. We believe there are better opportunities elsewhere.
Why There Are Better Opportunities Than Griffon


At $70.51 per share, Griffon trades at 13.6x forward P/E. This multiple is lower than most industrials companies, but for good reason.
Cheap stocks can look like a great deal at first glance, but they can be value traps. They often have less earnings power, meaning there is more reliance on a re-rating to generate good returns - an unlikely scenario for low-quality companies.
3. Griffon (GFF) Research Report: Q4 CY2025 Update
Multi-industry consumer and professional products manufacturer Griffon Corporation (NYSE:GFF) reported Q4 CY2025 results beating Wall Street’s revenue expectations, with sales up 2.6% year on year to $649.1 million. On the other hand, the company’s full-year revenue guidance of $1.8 billion at the midpoint came in 28.9% below analysts’ estimates. Its non-GAAP profit of $1.45 per share was 8.9% above analysts’ consensus estimates.
Griffon (GFF) Q4 CY2025 Highlights:
- Revenue: $649.1 million vs analyst estimates of $619.4 million (2.6% year-on-year growth, 4.8% beat)
- Adjusted EPS: $1.45 vs analyst estimates of $1.33 (8.9% beat)
- Adjusted EBITDA: $129.6 million vs analyst estimates of $123.5 million (20% margin, 4.9% beat)
- The company dropped its revenue guidance for the full year to $1.8 billion at the midpoint from $2.5 billion, a 28% decrease
- EBITDA guidance for the full year is $520 million at the midpoint, below analyst estimates of $534 million
- Operating Margin: 17.5%, in line with the same quarter last year
- Free Cash Flow Margin: 15.3%, down from 22.6% in the same quarter last year
- Market Capitalization: $3.95 billion
Company Overview
Initially in the defense industry, Griffon (NYSE:GFF) is a now diversified company specializing in home improvement, professional equipment, and building products.
Founded in 1959 and headquartered in New York, N.Y., Griffon focuses on maintaining leading positions in the markets it serves by providing innovative, branded products with superior quality and industry-leading service.
The company operates through two reportable segments: Home and Building Products (HBP) and Consumer and Professional Products (CPP). The HBP segment consists of Clopay Corporation, the largest manufacturer and marketer of garage doors and rolling steel doors in North America. The CPP segment is a leading global provider of branded consumer and professional tools, residential, industrial and commercial fans, home storage and organization products, and products that enhance indoor and outdoor lifestyles.
Griffon's HBP segment, operating under the Clopay brand, offers a broad line of residential sectional garage doors and commercial doors. Clopay's products are sold through 3,000+ independent professional installing dealers and major home center retail chains.
The CPP segment operates under several brands, including AMES, Hunter, True Temper, and ClosetMaid. This segment manufactures and markets a wide range of products including long-handled tools, landscaping products, home organization solutions, and residential, industrial, and commercial fans. CPP's products are sold through various channels, including home centers, mass market retailers, hardware stores, and e-commerce platforms.
Griffon has undergone significant transformation in recent years, including the divestiture of its Defense Electronics segment in 2022 and the acquisition of Hunter Fan Company in the same year.
4. Home Construction Materials
Traditionally, home construction materials companies have built economic moats with expertise in specialized areas, brand recognition, and strong relationships with contractors. More recently, advances to address labor availability and job site productivity have spurred innovation that is driving incremental demand. However, these companies are at the whim of residential construction volumes, which tend to be cyclical and can be impacted heavily by economic factors such as interest rates. Additionally, the costs of raw materials can be driven by a myriad of worldwide factors and greatly influence the profitability of home construction materials companies.
Other companies competing with Griffon in its respective industries include Masco (NYSE:MAS), Stanley Black & Decker (NYSE:SWK), and Fortune Brands Home & Security (NYSE:FBHS).
5. Revenue Growth
Reviewing a company’s long-term sales performance reveals insights into its quality. Any business can have short-term success, but a top-tier one grows for years. Over the last five years, Griffon grew its sales at a sluggish 1.5% compounded annual growth rate. This fell short of our benchmarks and is a tough starting point for our analysis.
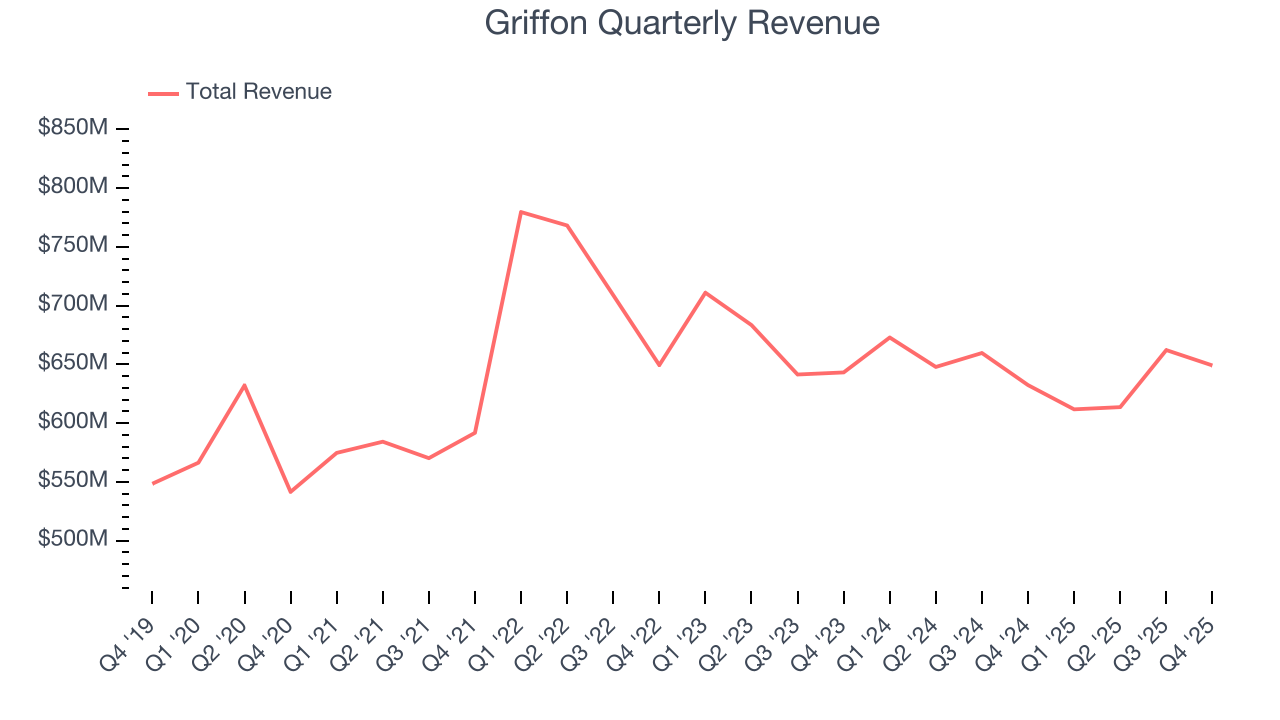
Long-term growth is the most important, but within industrials, a half-decade historical view may miss new industry trends or demand cycles. Griffon’s performance shows it grew in the past but relinquished its gains over the last two years, as its revenue fell by 2.7% annually. 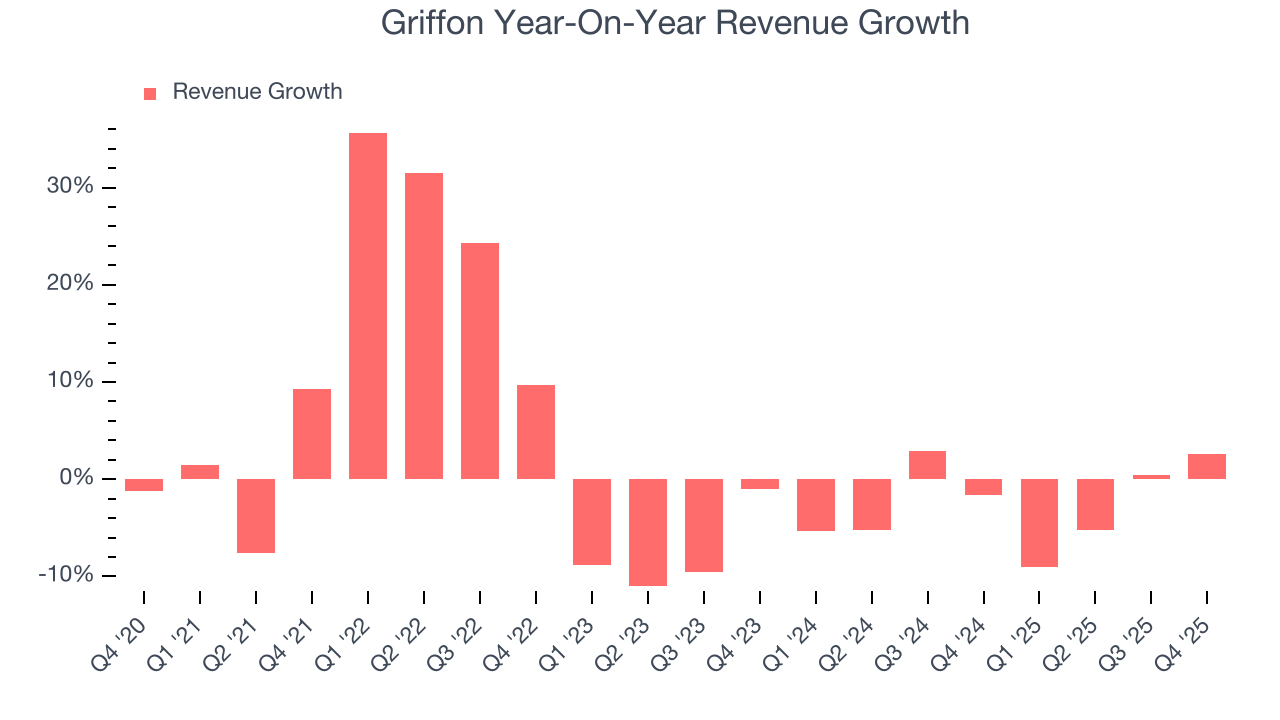
This quarter, Griffon reported modest year-on-year revenue growth of 2.6% but beat Wall Street’s estimates by 4.8%.
Looking ahead, sell-side analysts expect revenue to grow 1.1% over the next 12 months. While this projection suggests its newer products and services will spur better top-line performance, it is still below the sector average.
6. Gross Margin & Pricing Power
Griffon’s unit economics are great compared to the broader industrials sector and signal that it enjoys product differentiation through quality or brand. As you can see below, it averaged an excellent 37.1% gross margin over the last five years. That means Griffon only paid its suppliers $62.88 for every $100 in revenue. 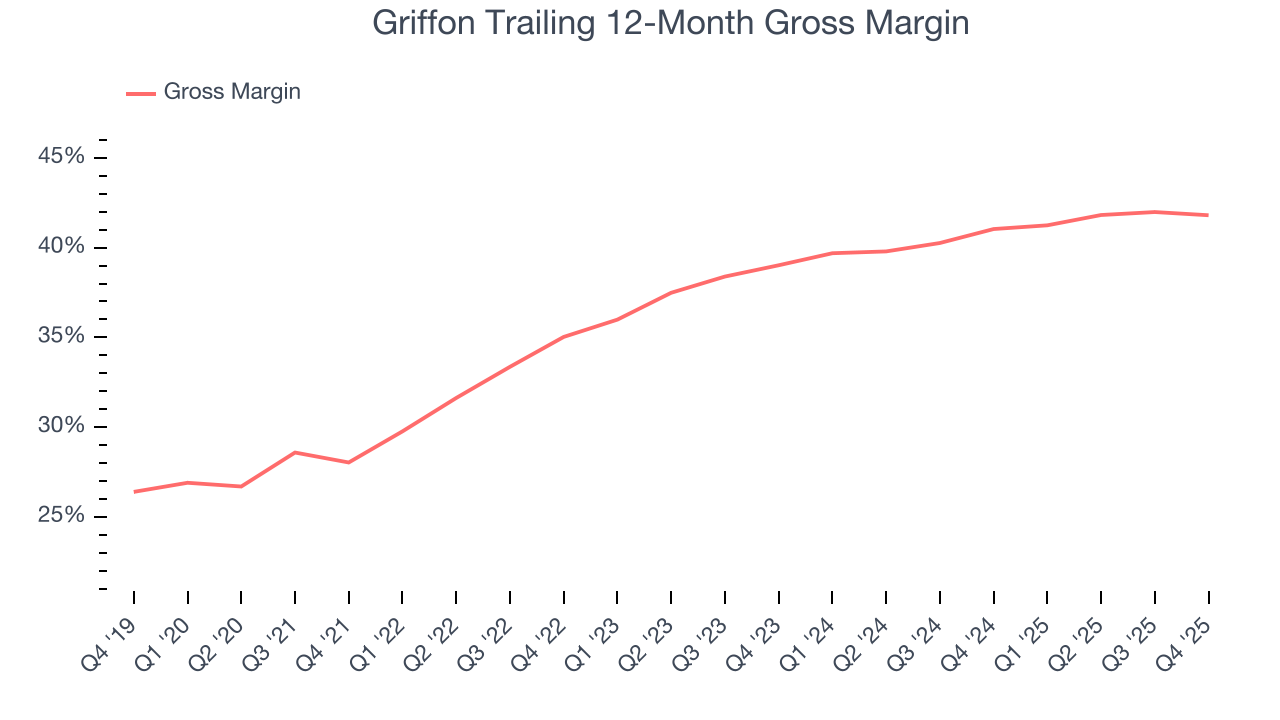
Griffon’s gross profit margin came in at 41.1% this quarter, in line with the same quarter last year. Zooming out, the company’s full-year margin has remained steady over the past 12 months, suggesting its input costs (such as raw materials and manufacturing expenses) have been stable and it isn’t under pressure to lower prices.
7. Operating Margin
Operating margin is one of the best measures of profitability because it tells us how much money a company takes home after procuring and manufacturing its products, marketing and selling those products, and most importantly, keeping them relevant through research and development.
Griffon has been an efficient company over the last five years. It was one of the more profitable businesses in the industrials sector, boasting an average operating margin of 14.8%. This result isn’t surprising as its high gross margin gives it a favorable starting point.
Analyzing the trend in its profitability, Griffon’s operating margin rose by 10.3 percentage points over the last five years, as its sales growth gave it operating leverage.
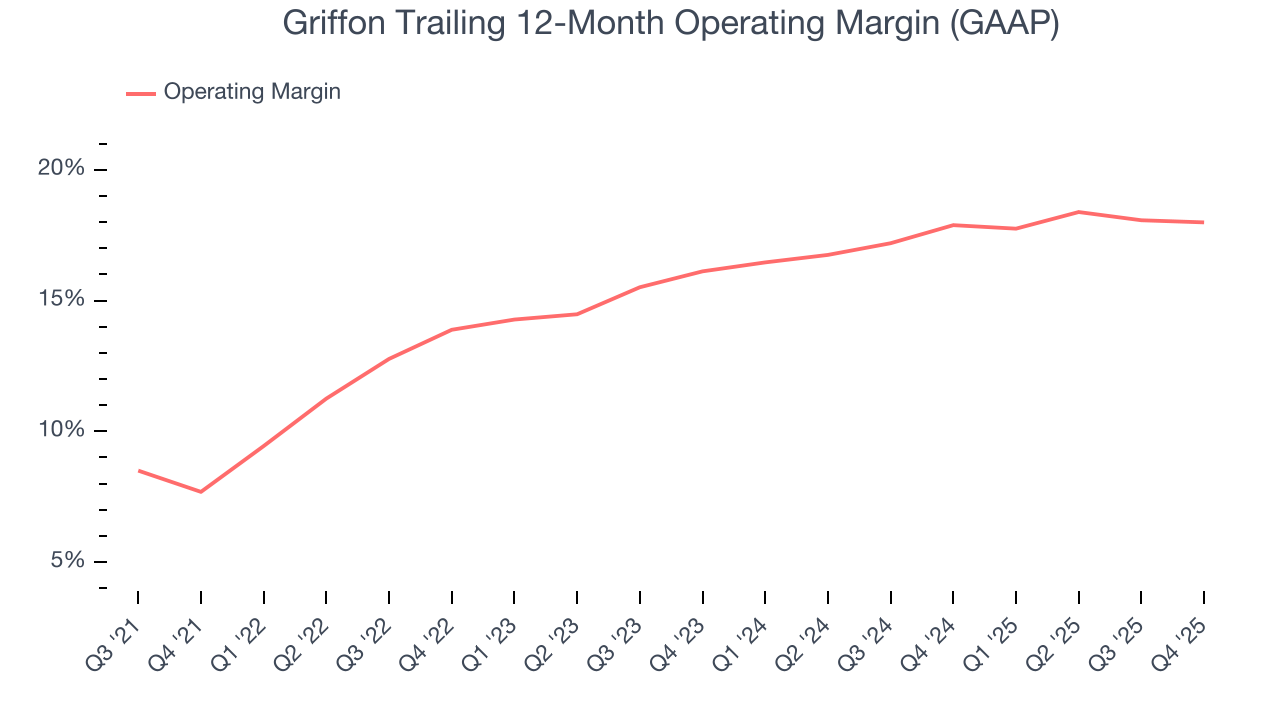
This quarter, Griffon generated an operating margin profit margin of 17.5%, in line with the same quarter last year. This indicates the company’s cost structure has recently been stable.
8. Earnings Per Share
Revenue trends explain a company’s historical growth, but the long-term change in earnings per share (EPS) points to the profitability of that growth – for example, a company could inflate its sales through excessive spending on advertising and promotions.
Griffon’s EPS grew at an astounding 25.7% compounded annual growth rate over the last five years, higher than its 1.5% annualized revenue growth. This tells us the company became more profitable on a per-share basis as it expanded.
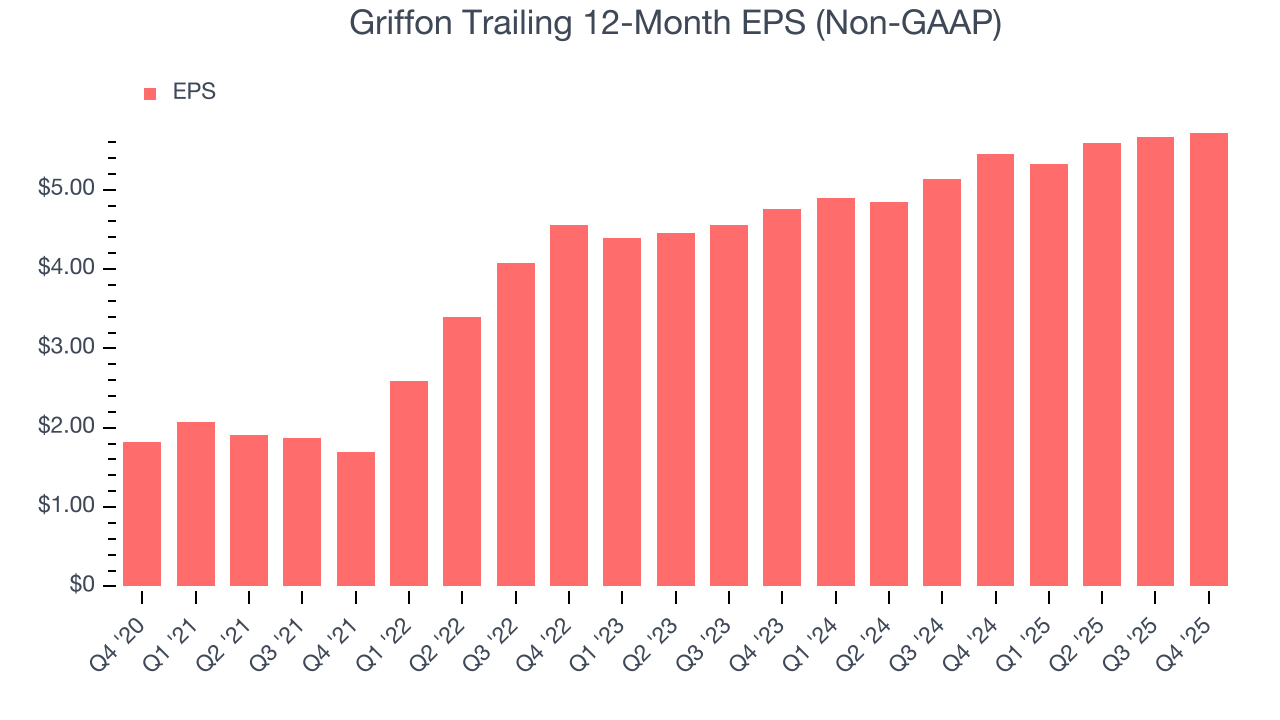
Diving into the nuances of Griffon’s earnings can give us a better understanding of its performance. As we mentioned earlier, Griffon’s operating margin was flat this quarter but expanded by 10.3 percentage points over the last five years. On top of that, its share count shrank by 14%. These are positive signs for shareholders because improving profitability and share buybacks turbocharge EPS growth relative to revenue growth. 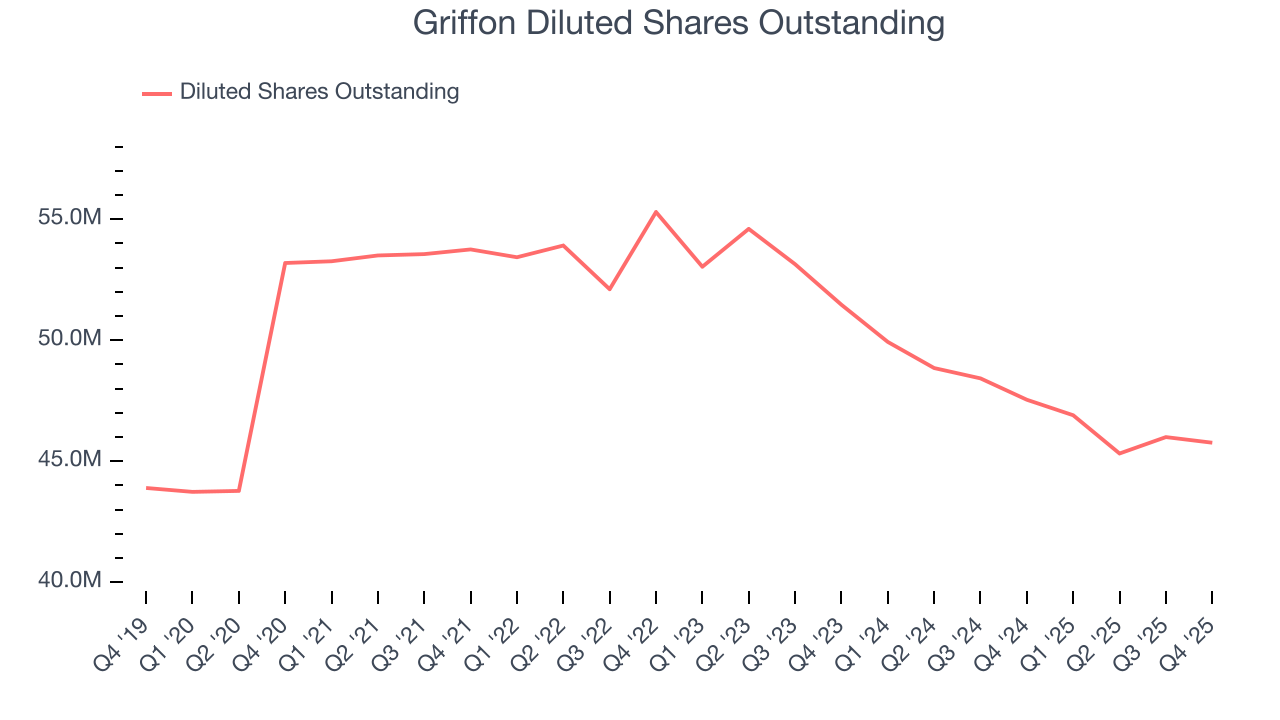
Like with revenue, we analyze EPS over a more recent period because it can provide insight into an emerging theme or development for the business.
For Griffon, its two-year annual EPS growth of 9.6% was lower than its five-year trend. We hope its growth can accelerate in the future.
In Q4, Griffon reported adjusted EPS of $1.45, up from $1.39 in the same quarter last year. This print beat analysts’ estimates by 8.9%. Over the next 12 months, Wall Street expects Griffon’s full-year EPS of $5.72 to grow 9.1%.
9. Cash Is King
If you’ve followed StockStory for a while, you know we emphasize free cash flow. Why, you ask? We believe that in the end, cash is king, and you can’t use accounting profits to pay the bills.
Griffon has shown impressive cash profitability, enabling it to ride out cyclical downturns more easily while maintaining its investments in new and existing offerings. The company’s free cash flow margin averaged 9.1% over the last five years, better than the broader industrials sector.
Taking a step back, we can see that Griffon’s margin expanded by 12 percentage points during that time. This is encouraging, and we can see it became a less capital-intensive business because its free cash flow profitability rose more than its operating profitability.
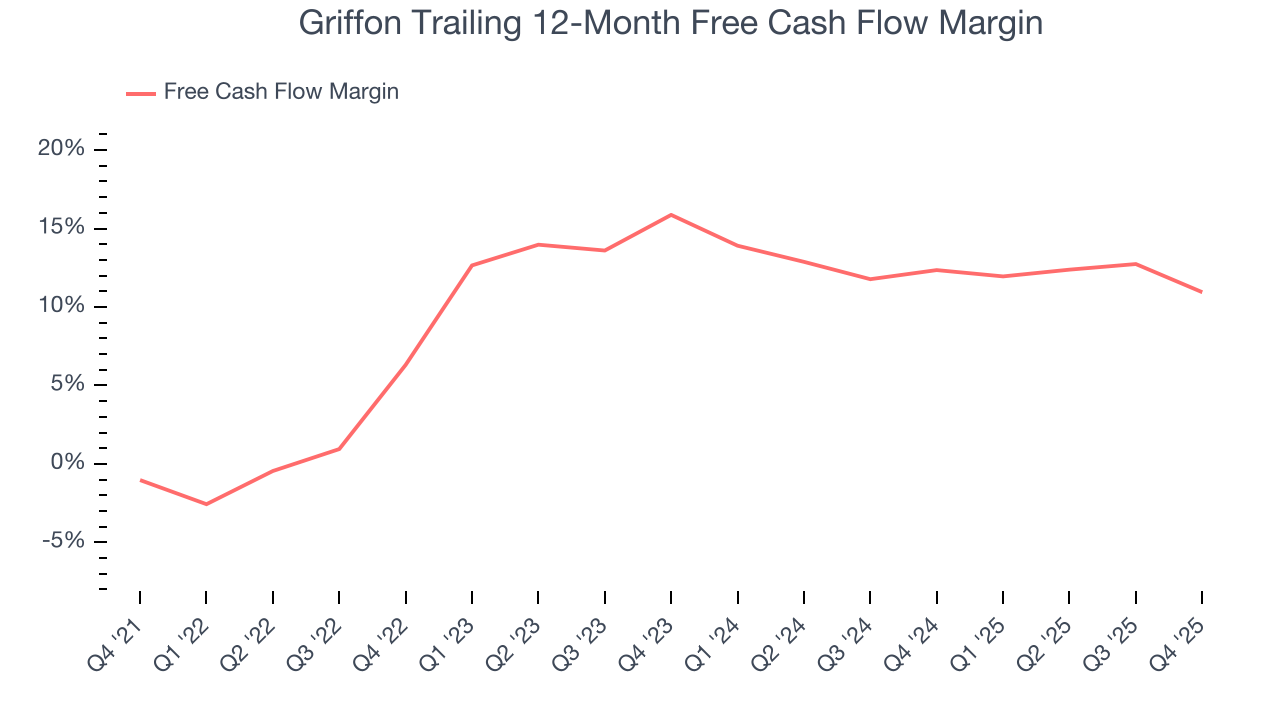
Griffon’s free cash flow clocked in at $99.33 million in Q4, equivalent to a 15.3% margin. The company’s cash profitability regressed as it was 7.3 percentage points lower than in the same quarter last year, but it’s still above its five-year average. We wouldn’t put too much weight on this quarter’s decline because investment needs can be seasonal, causing short-term swings. Long-term trends trump temporary fluctuations.
10. Return on Invested Capital (ROIC)
EPS and free cash flow tell us whether a company was profitable while growing its revenue. But was it capital-efficient? Enter ROIC, a metric showing how much operating profit a company generates relative to the money it has raised (debt and equity).
Although Griffon hasn’t been the highest-quality company lately because of its poor top-line performance, it found a few growth initiatives in the past that worked out wonderfully. Its five-year average ROIC was 18.4%, splendid for an industrials business.
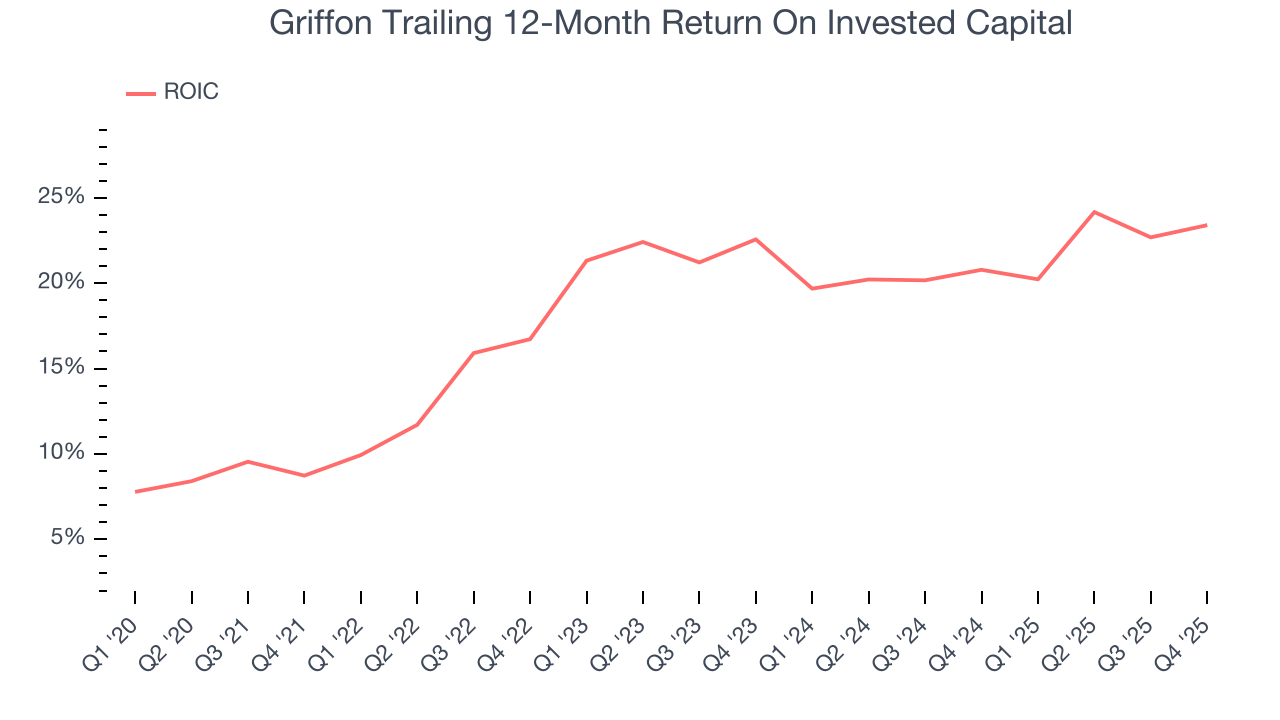
We like to invest in businesses with high returns, but the trend in a company’s ROIC is what often surprises the market and moves the stock price. Over the last few years, Griffon’s ROIC has increased. This is a good sign, and if its returns keep rising, there’s a chance it could evolve into an investable business.
11. Balance Sheet Assessment
Griffon reported $95.28 million of cash and $1.55 billion of debt on its balance sheet in the most recent quarter. As investors in high-quality companies, we primarily focus on two things: 1) that a company’s debt level isn’t too high and 2) that its interest payments are not excessively burdening the business.
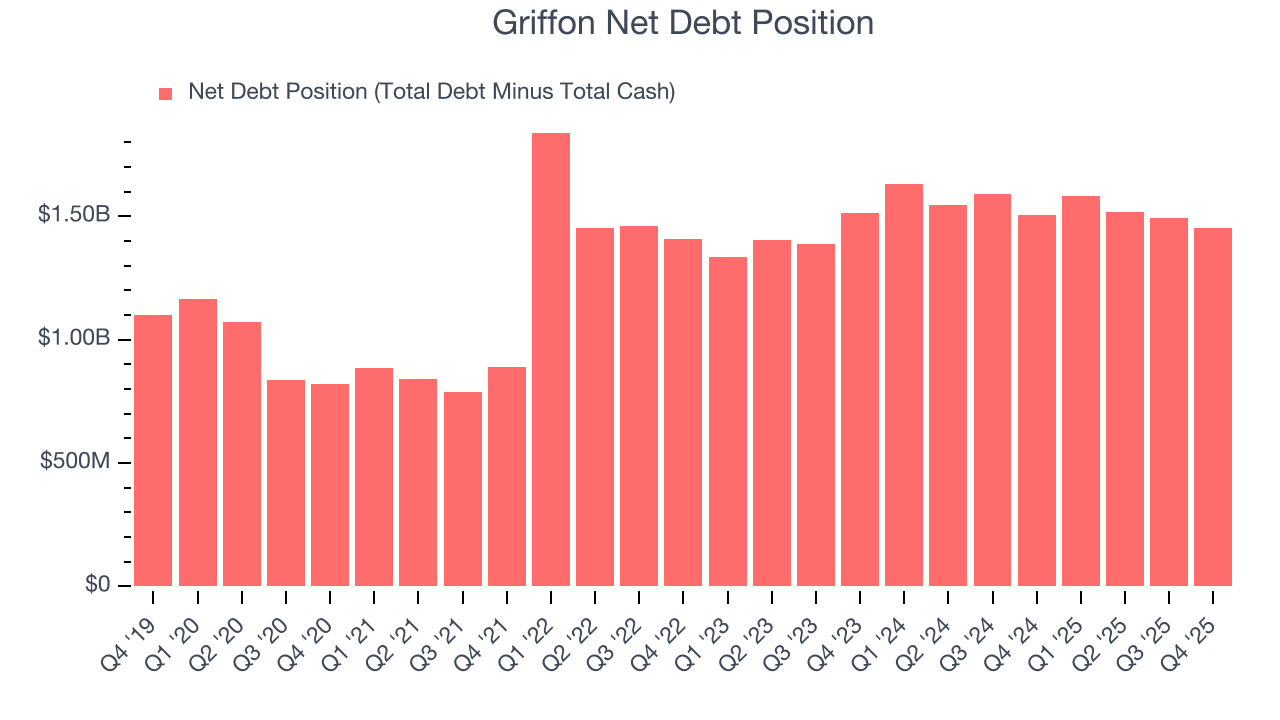
With $520.7 million of EBITDA over the last 12 months, we view Griffon’s 2.8× net-debt-to-EBITDA ratio as safe. We also see its $47.63 million of annual interest expenses as appropriate. The company’s profits give it plenty of breathing room, allowing it to continue investing in growth initiatives.
12. Key Takeaways from Griffon’s Q4 Results
We were impressed by how significantly Griffon blew past analysts’ revenue expectations this quarter. We were also glad its EBITDA outperformed Wall Street’s estimates. On the other hand, its full-year revenue guidance missed and its full-year EBITDA guidance fell short of Wall Street’s estimates. Overall, this quarter could have been better, as guidance is weighing on shares. The stock traded down 3.2% to $82.03 immediately following the results.
13. Is Now The Time To Buy Griffon?
Updated: March 27, 2026 at 11:26 PM EDT
The latest quarterly earnings matters, sure, but we actually think longer-term fundamentals and valuation matter more. Investors should consider all these pieces before deciding whether or not to invest in Griffon.
There are some bright spots in Griffon’s fundamentals, but its business quality ultimately falls short. Although its revenue growth was weak over the last five years and analysts expect growth to slow over the next 12 months, its rising cash profitability gives it more optionality. Tread carefully with this one, however, as its projected EPS for the next year is lacking.
Griffon’s P/E ratio based on the next 12 months is 13.6x. This valuation multiple is fair, but we don’t have much faith in the company. We're fairly confident there are better investments elsewhere.
Wall Street analysts have a consensus one-year price target of $114.14 on the company (compared to the current share price of $70.51).