
Global Industrial (GIC)
Global Industrial is up against the odds. Its poor sales growth and falling returns on capital suggest its growth opportunities are shrinking.― StockStory Analyst Team
1. News


2. Summary
Why We Think Global Industrial Will Underperform
Formerly known as Systemax, Global Industrial (NYSE:GIC) distributes industrial and commercial products to businesses and institutions.
- Flat earnings per share over the last two years underperformed the sector average
- 4% annual revenue growth over the last two years was slower than its industrials peers
- Estimated sales growth of 4.7% for the next 12 months is soft and implies weaker demand


Global Industrial’s quality is lacking. There are more profitable opportunities elsewhere.
Why There Are Better Opportunities Than Global Industrial


Global Industrial’s stock price of $30.08 implies a valuation ratio of 15.3x forward P/E. This multiple is cheaper than most industrials peers, but we think this is justified.
Our advice is to pay up for elite businesses whose advantages are tailwinds to earnings growth. Don’t get sucked into lower-quality businesses just because they seem like bargains. These mediocre businesses often never achieve a higher multiple as hoped, a phenomenon known as a “value trap”.
3. Global Industrial (GIC) Research Report: Q4 CY2025 Update
Industrial and commercial distributor Global Industrial (NYSE:GIC) reported revenue ahead of Wall Street’s expectations in Q4 CY2025, with sales up 14.3% year on year to $345.6 million. Its GAAP profit of $0.38 per share was 18.8% above analysts’ consensus estimates.
Global Industrial (GIC) Q4 CY2025 Highlights:
- Revenue: $345.6 million vs analyst estimates of $324.8 million (14.3% year-on-year growth, 6.4% beat)
- EPS (GAAP): $0.38 vs analyst estimates of $0.32 (18.8% beat)
- Adjusted EBITDA: $23 million vs analyst estimates of $21.1 million (6.7% margin, 9% beat)
- Operating Margin: 5.7%, in line with the same quarter last year
- Free Cash Flow Margin: 5.6%, similar to the same quarter last year
- Market Capitalization: $1.19 billion
Company Overview
Formerly known as Systemax, Global Industrial (NYSE:GIC) distributes industrial and commercial products to businesses and institutions.
The company was originally founded in 1949 under the name Global Equipment Company and was a manufacturer and supplier of industrial machinery, tools, and supplies. Over the years, it expanded by shifting its focus from manufacturing everything itself to listing products made by other companies on its marketplace, thereby transforming into an industrial distributor. This allowed it to provide a broader selection to customers as the company was no longer limited to its manufacturing capabilities.
Today, Global Industrial offers over a million brand name and private label products through its e-commerce site and catalogs. The company also offers maintenance, repair, and operations (MRO) services to businesses, educational institutions, and government entities. Specifically, Global Industrial sets itself apart by carrying vast inventory and reliably delivering big and bulky products such as furniture, storage, and shelving.
Global Industrial generates its revenue from direct product sales and add-on services such as the maintenance of products. It also offers loyal customers bulk purchasing contracts and long-term supply agreements, which can lead to stickier customers.
4. Maintenance and Repair Distributors
Supply chain and inventory management are themes that grew in focus after COVID wreaked havoc on the global movement of raw materials and components. Maintenance and repair distributors that boast reliable selection and quickly deliver products to customers can benefit from this theme. While e-commerce hasn’t disrupted industrial distribution as much as consumer retail, it is still a real threat, forcing investment in omnichannel capabilities to serve customers everywhere. Additionally, maintenance and repair distributors are at the whim of economic cycles that impact the capital spending and construction projects that can juice demand.
Competitors in the industrial and commercial products industry include Grainger (NYSE:GWW), Fastenal (NASDAQ:FAST), and MSC Industrial (NYSE:MSM
5. Revenue Growth
A company’s long-term sales performance can indicate its overall quality. Even a bad business can shine for one or two quarters, but a top-tier one grows for years. Over the last five years, Global Industrial grew its sales at a mediocre 6% compounded annual growth rate. This fell short of our benchmark for the industrials sector and is a rough starting point for our analysis.
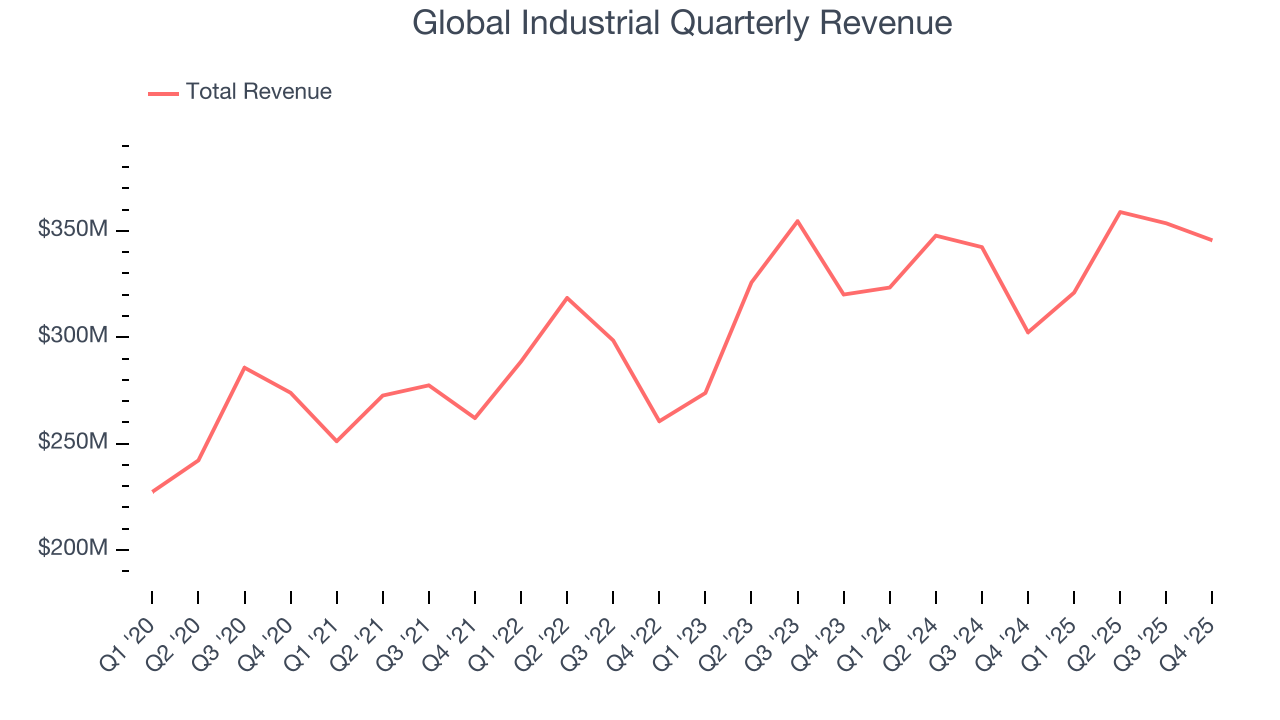
Long-term growth is the most important, but within industrials, a half-decade historical view may miss new industry trends or demand cycles. Global Industrial’s recent performance shows its demand has slowed as its annualized revenue growth of 4% over the last two years was below its five-year trend. We’re wary when companies in the sector see decelerations in revenue growth, as it could signal changing consumer tastes aided by low switching costs. 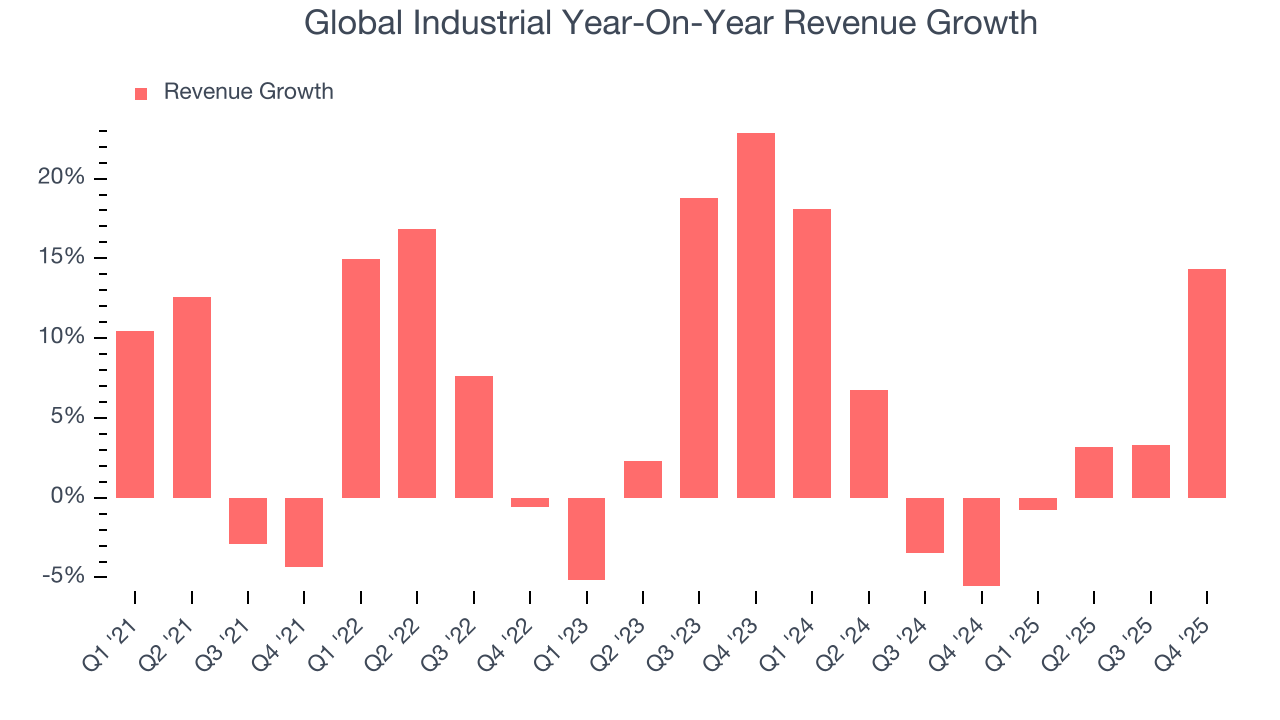
This quarter, Global Industrial reported year-on-year revenue growth of 14.3%, and its $345.6 million of revenue exceeded Wall Street’s estimates by 6.4%.
Looking ahead, sell-side analysts expect revenue to grow 2.1% over the next 12 months, a slight deceleration versus the last two years. This projection doesn't excite us and implies its products and services will see some demand headwinds.
6. Gross Margin & Pricing Power
All else equal, we prefer higher gross margins because they usually indicate that a company sells more differentiated products and commands stronger pricing power.
Global Industrial’s gross margin is good compared to other industrials businesses and signals it sells differentiated products, not commodities. As you can see below, it averaged an impressive 35.1% gross margin over the last five years. Said differently, Global Industrial paid its suppliers $64.94 for every $100 in revenue. 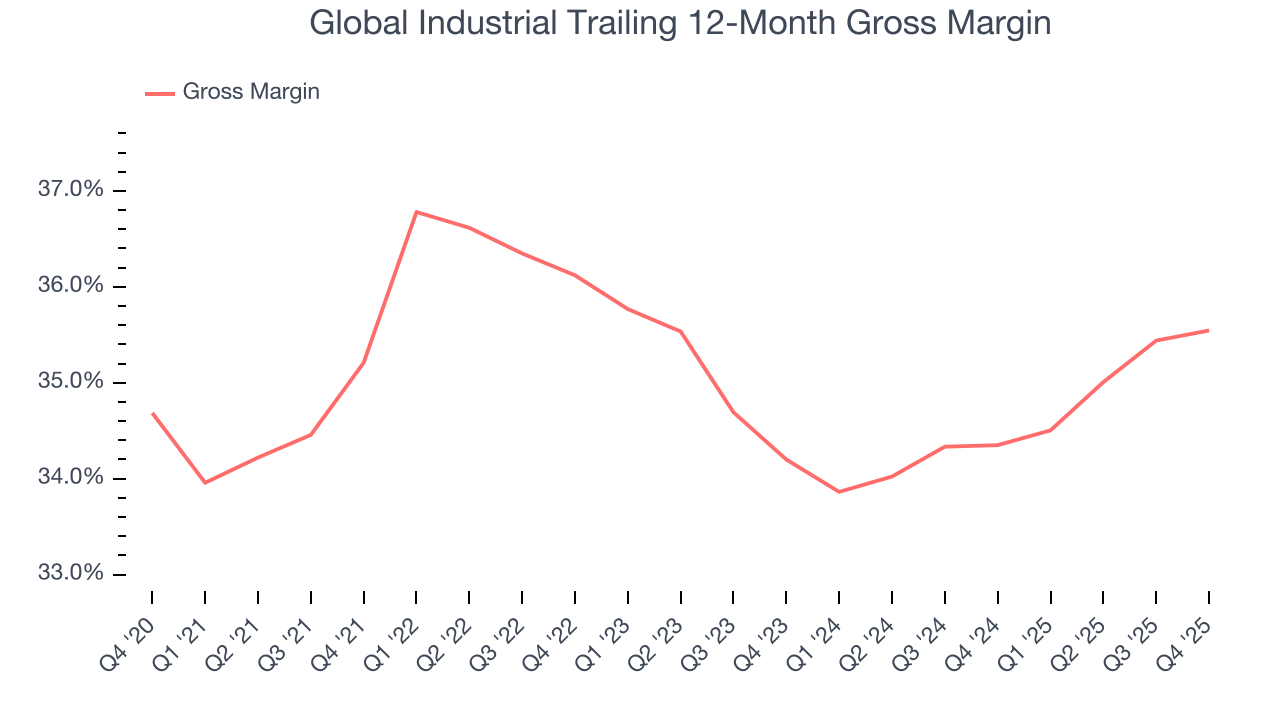
Global Industrial produced a 34.5% gross profit margin in Q4, in line with the same quarter last year. Zooming out, Global Industrial’s full-year margin has been trending up over the past 12 months, increasing by 1.2 percentage points. If this move continues, it could suggest better unit economics due to more leverage from its growing sales on the fixed portion of its cost of goods sold (such as manufacturing expenses).
7. Operating Margin
Global Industrial was profitable over the last five years but held back by its large cost base. Its average operating margin of 7.5% was weak for an industrials business. This result is surprising given its high gross margin as a starting point.
Analyzing the trend in its profitability, Global Industrial’s operating margin decreased by 1.2 percentage points over the last five years. This raises questions about the company’s expense base because its revenue growth should have given it leverage on its fixed costs, resulting in better economies of scale and profitability. Global Industrial’s performance was poor no matter how you look at it - it shows that costs were rising and it couldn’t pass them onto its customers.
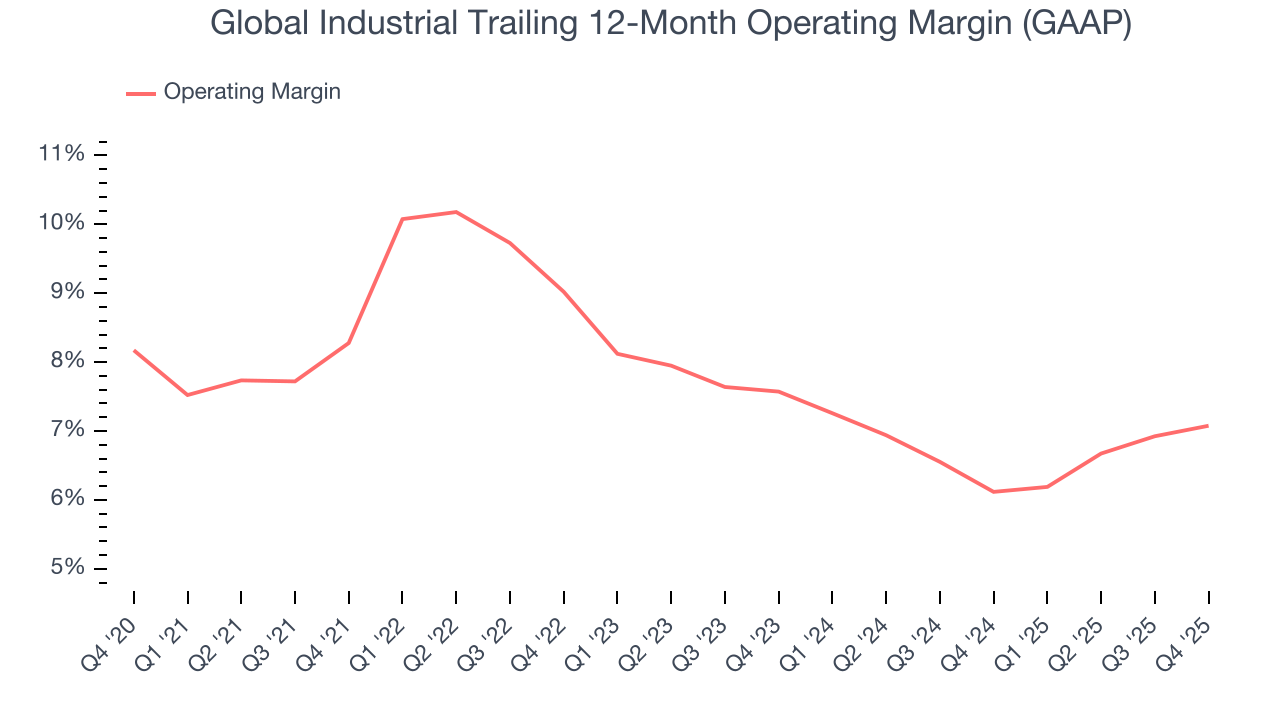
This quarter, Global Industrial generated an operating margin profit margin of 5.7%, in line with the same quarter last year. This indicates the company’s cost structure has recently been stable.
8. Earnings Per Share
We track the long-term change in earnings per share (EPS) for the same reason as long-term revenue growth. Compared to revenue, however, EPS highlights whether a company’s growth is profitable.
Global Industrial’s unimpressive 5.6% annual EPS growth over the last five years aligns with its revenue performance. This tells us it maintained its per-share profitability as it expanded.
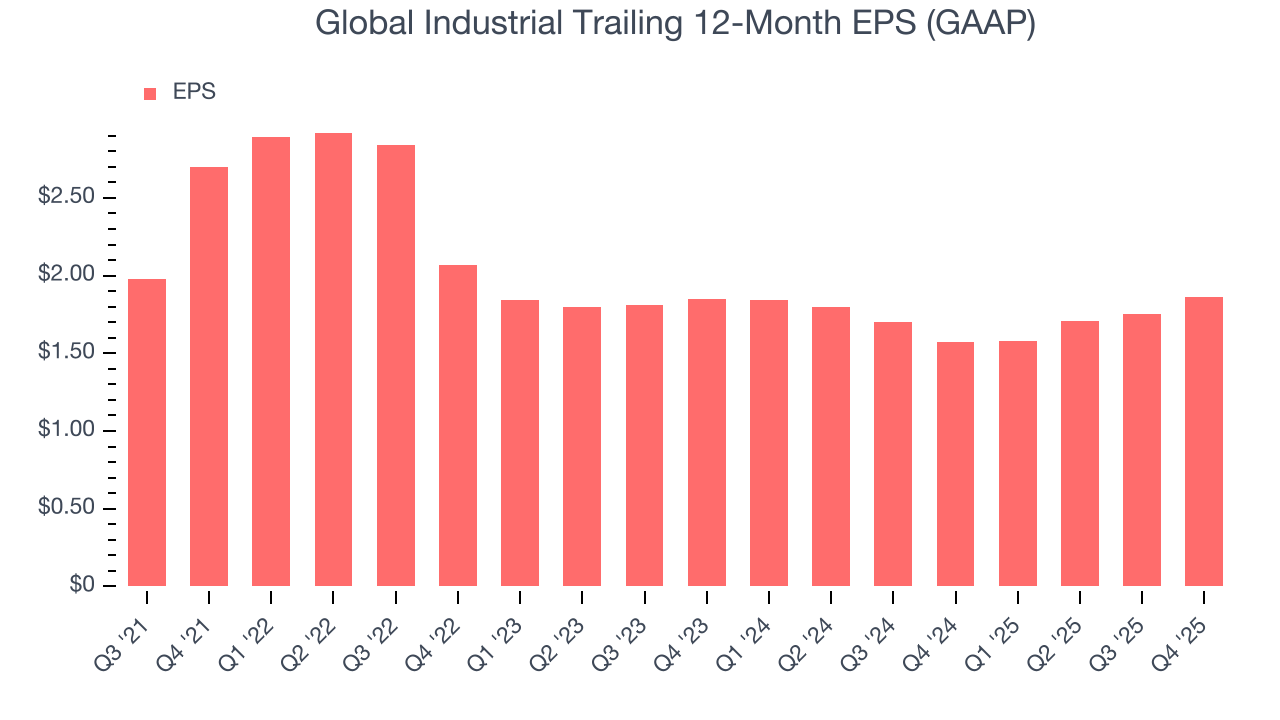
Like with revenue, we analyze EPS over a shorter period to see if we are missing a change in the business.
Global Industrial’s flat two-year EPS was subpar and lower than its 4% two-year revenue growth.
We can take a deeper look into Global Industrial’s earnings to better understand the drivers of its performance. While we mentioned earlier that Global Industrial’s operating margin was flat this quarter, a two-year view shows its margin has declined. This was the most relevant factor (aside from the revenue impact) behind its lower earnings; interest expenses and taxes can also affect EPS but don’t tell us as much about a company’s fundamentals.
In Q4, Global Industrial reported EPS of $0.38, up from $0.27 in the same quarter last year. This print easily cleared analysts’ estimates, and shareholders should be content with the results. Over the next 12 months, Wall Street expects Global Industrial’s full-year EPS of $1.86 to grow 7.5%.
9. Cash Is King
Although earnings are undoubtedly valuable for assessing company performance, we believe cash is king because you can’t use accounting profits to pay the bills.
Global Industrial has shown mediocre cash profitability over the last five years, giving the company limited opportunities to return capital to shareholders. Its free cash flow margin averaged 5%, subpar for an industrials business.
Taking a step back, an encouraging sign is that Global Industrial’s margin expanded by 1.1 percentage points during that time. The company’s improvement shows it’s heading in the right direction, and we can see it became a less capital-intensive business because its free cash flow profitability rose while its operating profitability fell.
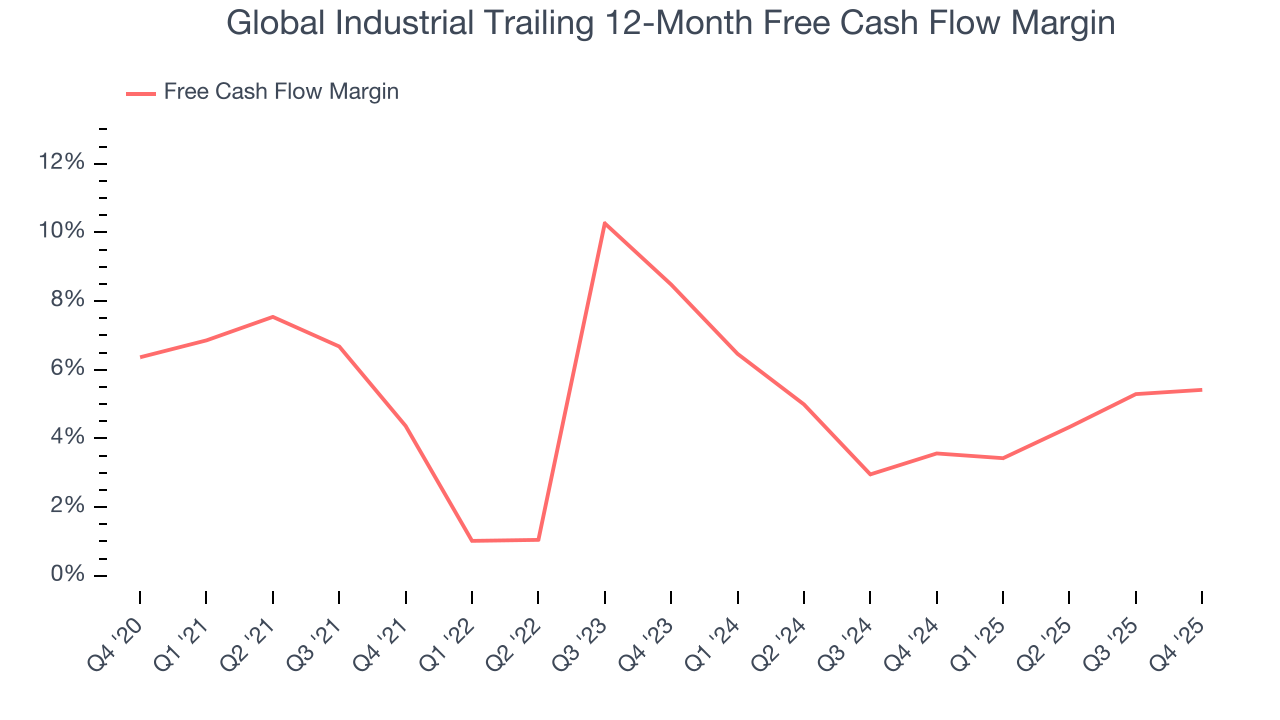
Global Industrial’s free cash flow clocked in at $19.2 million in Q4, equivalent to a 5.6% margin. This cash profitability was in line with the comparable period last year and its five-year average.
10. Return on Invested Capital (ROIC)
EPS and free cash flow tell us whether a company was profitable while growing its revenue. But was it capital-efficient? Enter ROIC, a metric showing how much operating profit a company generates relative to the money it has raised (debt and equity).
Although Global Industrial hasn’t been the highest-quality company lately, it found a few growth initiatives in the past that worked out wonderfully. Its five-year average ROIC was 34.4%, splendid for an industrials business.
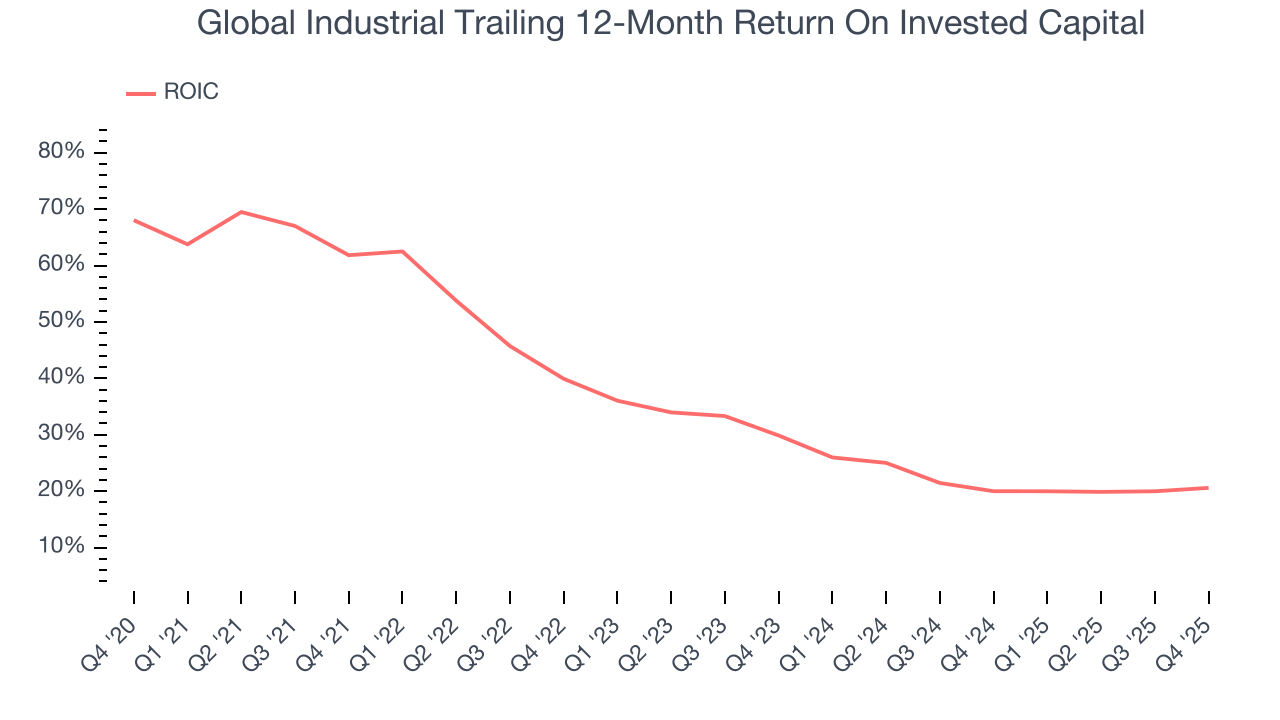
We like to invest in businesses with high returns, but the trend in a company’s ROIC is what often surprises the market and moves the stock price. Over the last few years, Global Industrial’s ROIC has unfortunately decreased significantly. We like what management has done in the past, but its declining returns are perhaps a symptom of fewer profitable growth opportunities.
11. Balance Sheet Assessment
Global Industrial reported $67.5 million of cash and $103.6 million of debt on its balance sheet in the most recent quarter. As investors in high-quality companies, we primarily focus on two things: 1) that a company’s debt level isn’t too high and 2) that its interest payments are not excessively burdening the business.
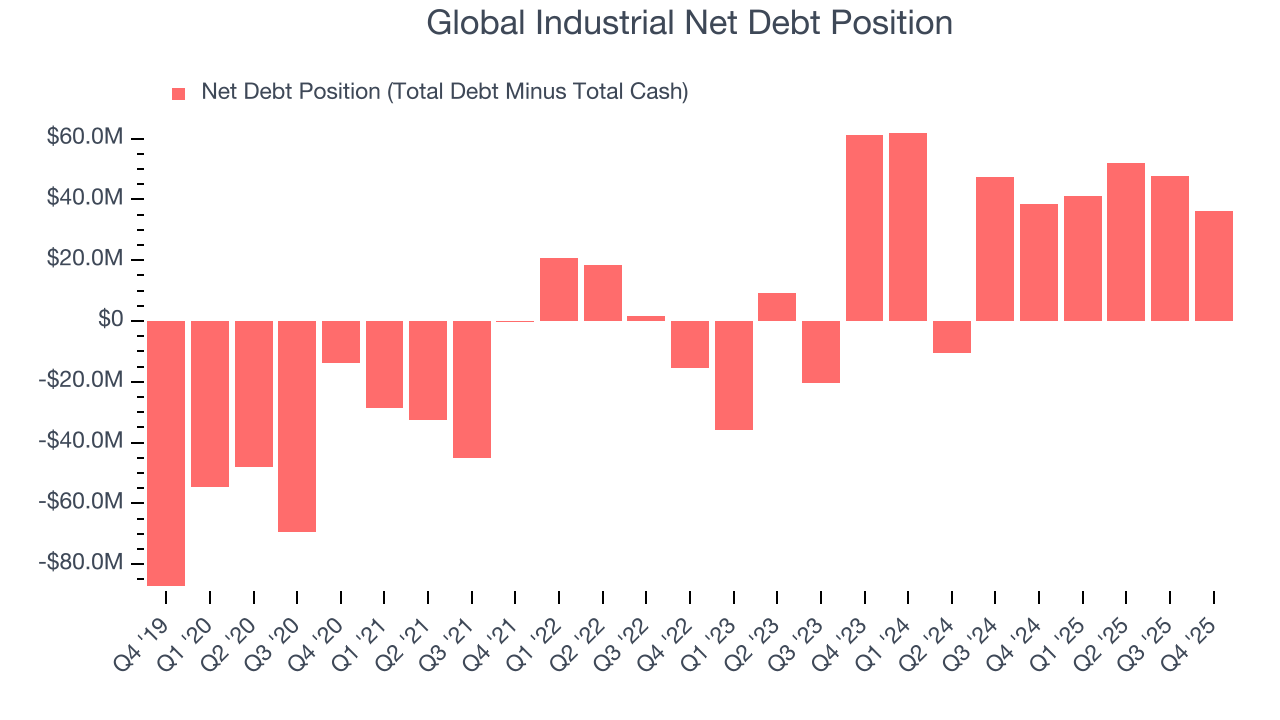
With $106.3 million of EBITDA over the last 12 months, we view Global Industrial’s 0.3× net-debt-to-EBITDA ratio as safe. The company’s profits give it plenty of breathing room, allowing it to continue investing in growth initiatives.
12. Key Takeaways from Global Industrial’s Q4 Results
We were impressed by how significantly Global Industrial blew past analysts’ EBITDA expectations this quarter. We were also excited its revenue outperformed Wall Street’s estimates by a wide margin. Zooming out, we think this was a good print with some key areas of upside. The stock traded up 5.2% to $32.53 immediately following the results.
13. Is Now The Time To Buy Global Industrial?
Updated: March 18, 2026 at 11:33 PM EDT
When considering an investment in Global Industrial, investors should account for its valuation and business qualities as well as what’s happened in the latest quarter.
We cheer for all companies making their customers lives easier, but in the case of Global Industrial, we’ll be cheering from the sidelines. To kick things off, its revenue growth was mediocre over the last five years, and analysts expect its demand to deteriorate over the next 12 months. While its stellar ROIC suggests it has been a well-run company historically, the downside is its diminishing returns show management's prior bets haven't worked out. On top of that, its unimpressive EPS growth over the last five years shows it’s failed to produce meaningful profits for shareholders.
Global Industrial’s P/E ratio based on the next 12 months is 15.3x. While this valuation is reasonable, we don’t see a big opportunity at the moment. There are better stocks to buy right now.
Wall Street analysts have a consensus one-year price target of $40 on the company (compared to the current share price of $30.08).
Although the price target is bullish, readers should exercise caution because analysts tend to be overly optimistic. The firms they work for, often big banks, have relationships with companies that extend into fundraising, M&A advisory, and other rewarding business lines. As a result, they typically hesitate to say bad things for fear they will lose out. We at StockStory do not suffer from such conflicts of interest, so we’ll always tell it like it is.