
HNI (HNI)
HNI is intriguing. Its expanding operating margin shows it’s becoming a more efficient business.― StockStory Analyst Team
1. News


2. Summary
Why HNI Is Interesting
With roots dating back to 1944 and a significant acquisition of Kimball International in 2023, HNI (NYSE:HNI) manufactures and sells office furniture systems, seating, and storage solutions, as well as residential fireplaces and heating products.
- Additional sales over the last five years increased its profitability as the 9.5% annual growth in its earnings per share outpaced its revenue
- Industry-leading 13.8% return on capital demonstrates management’s skill in finding high-return investments, and its rising returns show it’s making even more lucrative bets
- A downside is its poor expense management has led to an operating margin that is below the industry average


HNI has the potential to be a high-quality business. If you like the stock, the valuation seems reasonable.
Why Is Now The Time To Buy HNI?


At $47.58 per share, HNI trades at 12.4x forward P/E. HNI’s current multiple might be below that of most business services peers, but we think this valuation is warranted after considering its business quality.
If you think the market is not giving the company enough credit for its fundamentals, now could be a good time to invest.
3. HNI (HNI) Research Report: Q3 CY2025 Update
Workplace furnishings manufacturer HNI Corporation (NYSE:HNI) fell short of the market’s revenue expectations in Q3 CY2025 as sales only rose 1.7% year on year to $683.8 million. Its non-GAAP profit of $1.10 per share was 3% above analysts’ consensus estimates.
HNI (HNI) Q3 CY2025 Highlights:
- Revenue: $683.8 million vs analyst estimates of $691.5 million (1.7% year-on-year growth, 1.1% miss)
- Adjusted EPS: $1.10 vs analyst estimates of $1.07 (3% beat)
- Adjusted EBITDA: $92.7 million vs analyst estimates of $98.36 million (13.6% margin, 5.8% miss)
- Operating Margin: 9.4%, down from 10.5% in the same quarter last year
- Free Cash Flow Margin: 2.9%, down from 17% in the same quarter last year
- Market Capitalization: $2.06 billion
Company Overview
With roots dating back to 1944 and a significant acquisition of Kimball International in 2023, HNI (NYSE:HNI) manufactures and sells office furniture systems, seating, and storage solutions, as well as residential fireplaces and heating products.
HNI operates through two distinct business segments: Workplace Furnishings and Residential Building Products. The Workplace Furnishings segment offers a comprehensive range of office furniture including panel-based systems, seating, tables, storage solutions, and architectural products under brands like HON, Allsteel, Kimball, and Gunlocke. These products serve both large corporate clients through the contract channel and smaller businesses through the SMB channel.
The company distributes its workplace products through multiple channels: independent office dealers, national office product distributors, eCommerce resellers, wholesalers, and direct sales to government entities. This multi-channel approach allows HNI to reach diverse customer bases from large corporations to small businesses.
In the Residential Building Products segment, HNI operates as Hearth & Home Technologies, North America's largest manufacturer of prefabricated fireplaces and related products. The company produces gas, wood, electric, and pellet-fueled fireplaces, stoves, and outdoor fire features under brands including Heatilator, Heat & Glo, Majestic, and Vermont Castings.
A homebuilder might install HNI's Heatilator gas fireplace as a centerpiece in a new home's living room, while a homeowner renovating an older property might choose a Quadra-Fire wood stove for supplemental heating. The residential products are sold through independent dealers, distributors, and company-owned retail outlets, with sales typically concentrated during the fall and winter months.
HNI maintains vertical manufacturing capabilities that provide flexibility to design and produce new products in-house as market needs evolve. The company serves customers across commercial, financial, healthcare, government, and education sectors throughout North America, with additional international presence, particularly in India.
4. Office & Commercial Furniture
The sector faces a tepid outlook as workplace dynamics continue to evolve. Hybrid work means that enterprise demand for office furniture is lower. Consumer demand for the same products likely will not offset the loss from enterprises, as individual workers tend to have less space and need for the sector's wares. The Trump administration also possesses a high willingness to impose tariffs on key partners, which could result in retaliatory actions, all of which could pressure those selling furniture that may feature components or labor from overseas. Lastly, the COVID-19 pandemic showed that there is always a risk that something disrupts supply chains, and companies need contingency plans for this.
In the workplace furnishings segment, HNI competes with companies like Steelcase (NYSE:SCS), Herman Miller (NASDAQ:MLHR), and Knoll. In the residential building products segment, key competitors include Travis Industries, Innovative Hearth Products, Wolf Steel Ltd. (Napoleon), and FPI Fireplace Products International Ltd. (Regency).
5. Revenue Growth
A company’s long-term performance is an indicator of its overall quality. Any business can put up a good quarter or two, but the best consistently grow over the long haul.
With $2.59 billion in revenue over the past 12 months, HNI is a mid-sized business services company, which sometimes brings disadvantages compared to larger competitors benefiting from better economies of scale. On the bright side, it can still flex high growth rates because it’s working from a smaller revenue base.
As you can see below, HNI’s sales grew at a decent 5.2% compounded annual growth rate over the last five years. This shows its offerings generated slightly more demand than the average business services company, a useful starting point for our analysis.
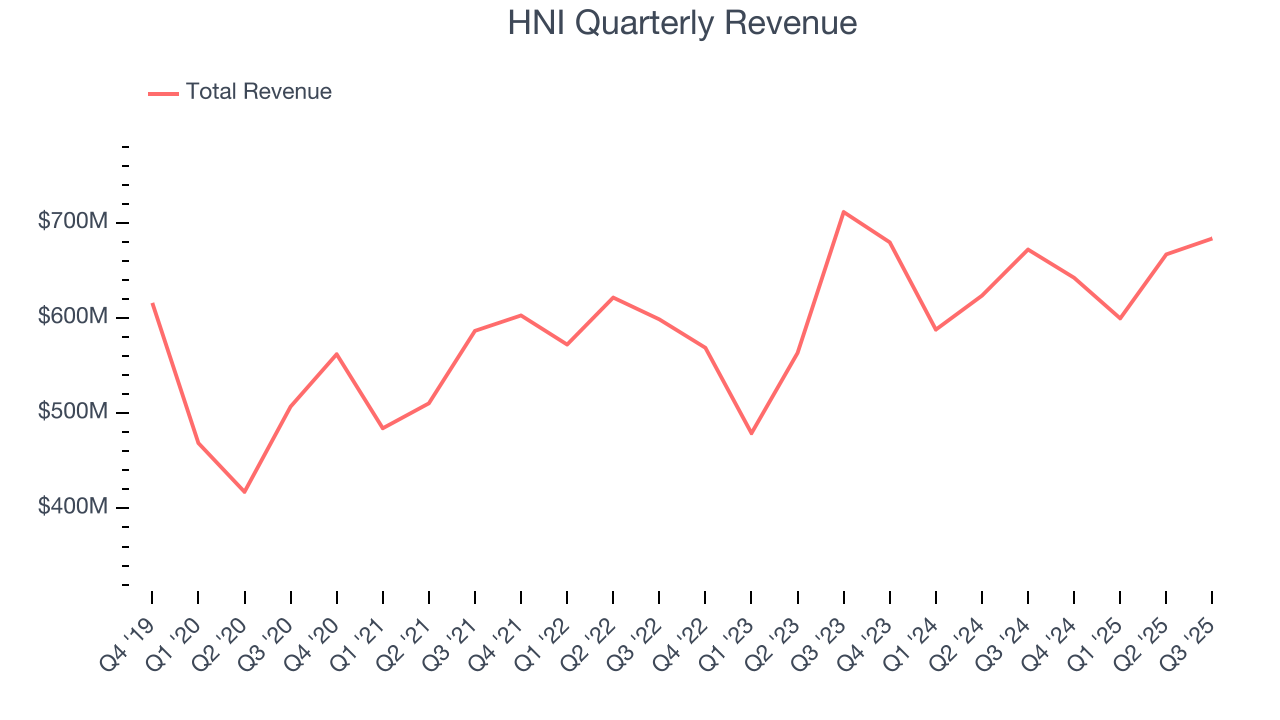
Long-term growth is the most important, but within business services, a half-decade historical view may miss new innovations or demand cycles. HNI’s annualized revenue growth of 5.7% over the last two years aligns with its five-year trend, suggesting its demand was stable. 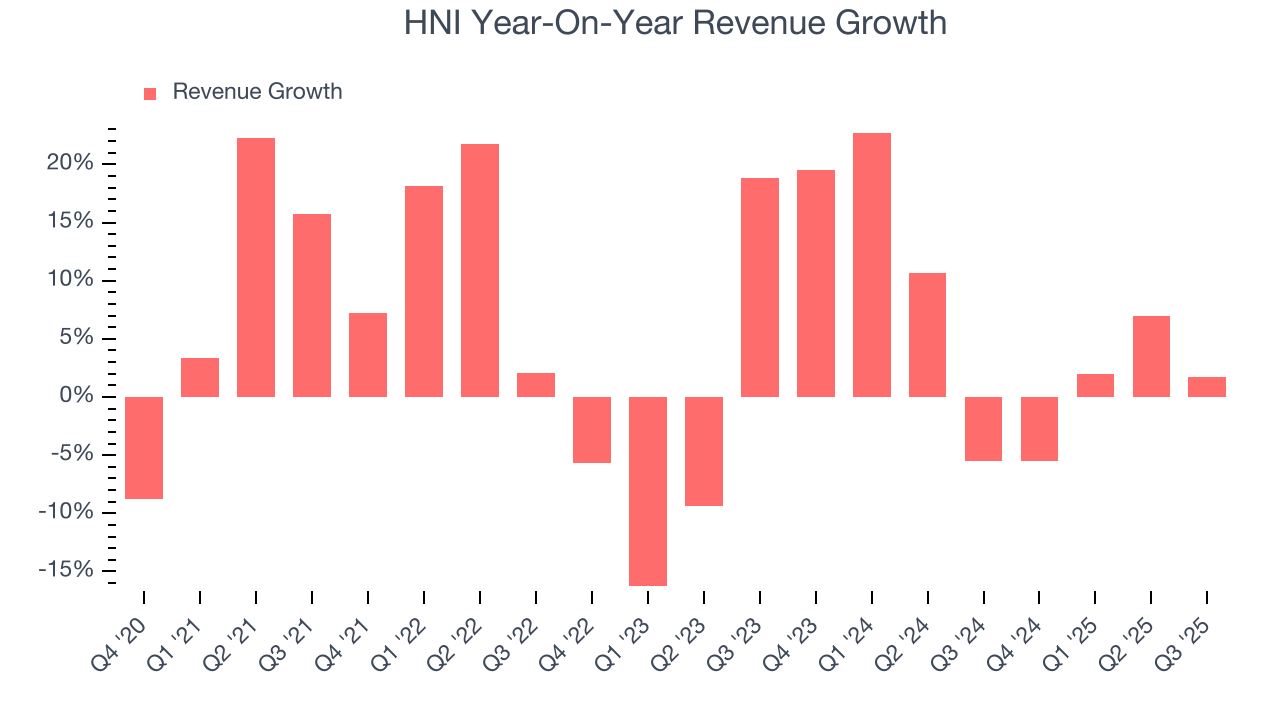
This quarter, HNI’s revenue grew by 1.7% year on year to $683.8 million, falling short of Wall Street’s estimates.
Looking ahead, sell-side analysts expect revenue to grow 5.7% over the next 12 months, similar to its two-year rate. This projection is above the sector average and implies its newer products and services will help sustain its recent top-line performance.
6. Operating Margin
Operating margin is an important measure of profitability as it shows the portion of revenue left after accounting for all core expenses – everything from the cost of goods sold to advertising and wages. It’s also useful for comparing profitability across companies with different levels of debt and tax rates because it excludes interest and taxes.
HNI was profitable over the last five years but held back by its large cost base. Its average operating margin of 6.9% was weak for a business services business.
On the plus side, HNI’s operating margin rose by 3.5 percentage points over the last five years, as its sales growth gave it operating leverage.
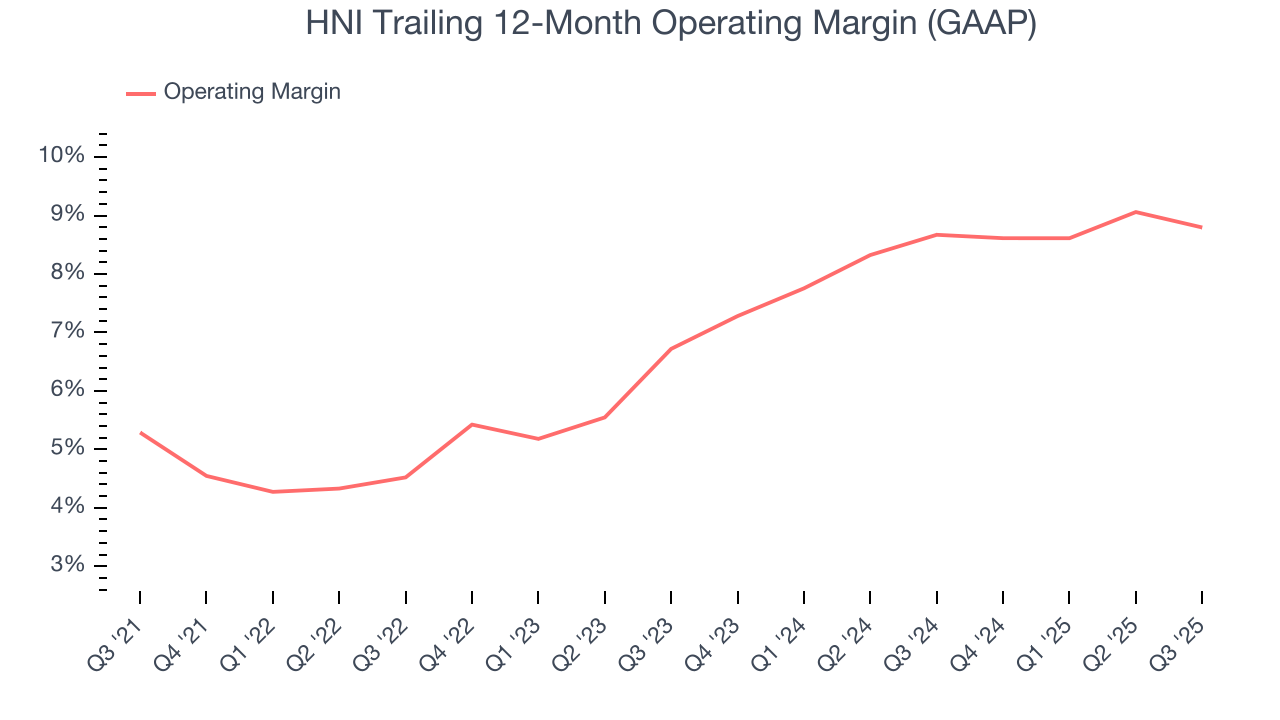
This quarter, HNI generated an operating margin profit margin of 9.4%, down 1 percentage points year on year. This reduction is quite minuscule and indicates the company’s overall cost structure has been relatively stable.
7. Earnings Per Share
We track the long-term change in earnings per share (EPS) for the same reason as long-term revenue growth. Compared to revenue, however, EPS highlights whether a company’s growth is profitable.
HNI’s EPS grew at a solid 9.5% compounded annual growth rate over the last five years, higher than its 5.2% annualized revenue growth. This tells us the company became more profitable on a per-share basis as it expanded.
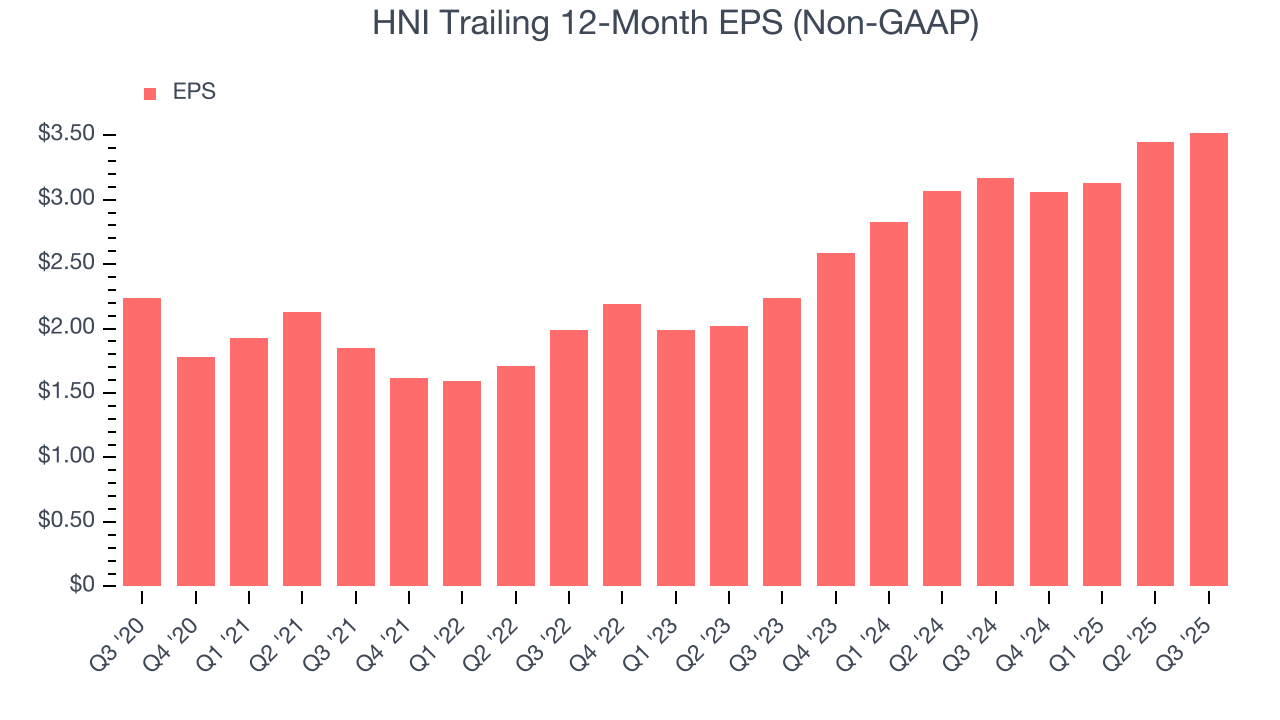
We can take a deeper look into HNI’s earnings to better understand the drivers of its performance. As we mentioned earlier, HNI’s operating margin declined this quarter but expanded by 3.5 percentage points over the last five years. This was the most relevant factor (aside from the revenue impact) behind its higher earnings; interest expenses and taxes can also affect EPS but don’t tell us as much about a company’s fundamentals.
Like with revenue, we analyze EPS over a more recent period because it can provide insight into an emerging theme or development for the business.
For HNI, its two-year annual EPS growth of 25.4% was higher than its five-year trend. We love it when earnings growth accelerates, especially when it accelerates off an already high base.
In Q3, HNI reported adjusted EPS of $1.10, up from $1.03 in the same quarter last year. This print beat analysts’ estimates by 3%. Over the next 12 months, Wall Street expects HNI’s full-year EPS of $3.52 to grow 11.8%.
8. Cash Is King
If you’ve followed StockStory for a while, you know we emphasize free cash flow. Why, you ask? We believe that in the end, cash is king, and you can’t use accounting profits to pay the bills.
HNI has shown mediocre cash profitability over the last five years, giving the company limited opportunities to return capital to shareholders. Its free cash flow margin averaged 4.7%, subpar for a business services business.
Taking a step back, we can see that HNI’s margin dropped by 2.5 percentage points during that time. This along with its unexciting margin put the company in a tough spot, and shareholders are likely hoping it can reverse course. If the trend continues, it could signal it’s becoming a more capital-intensive business.
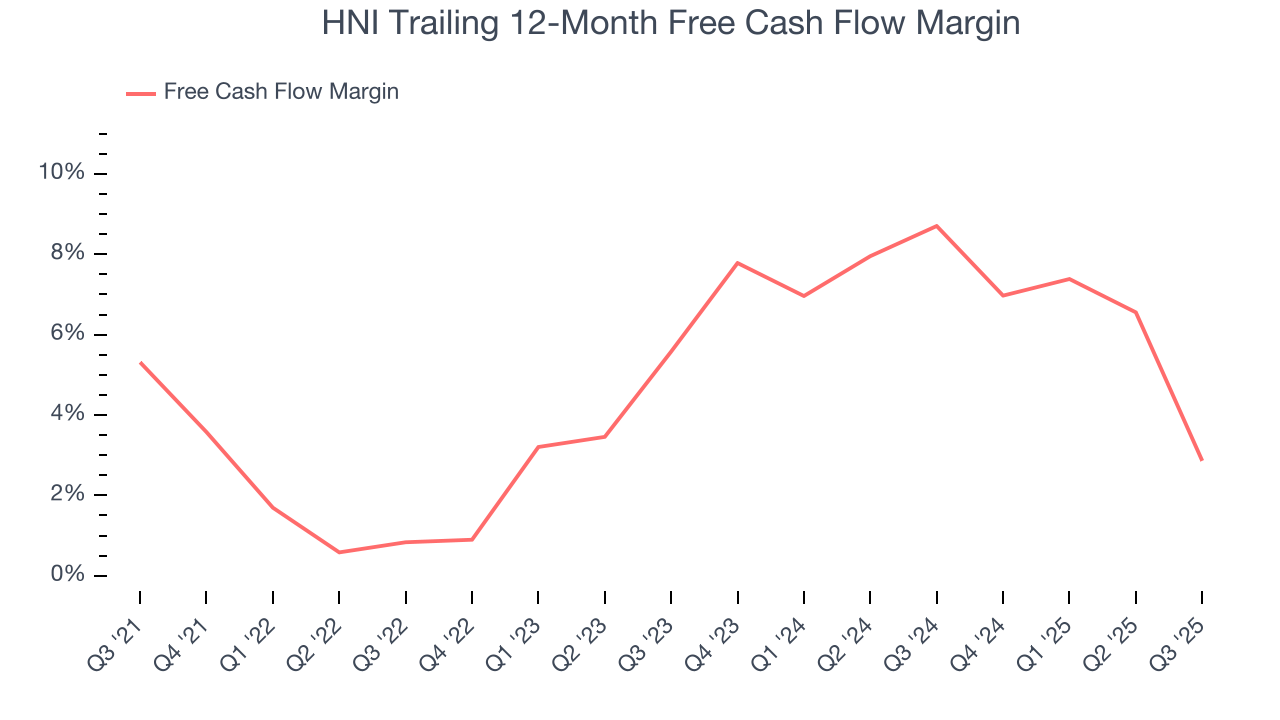
HNI’s free cash flow clocked in at $19.6 million in Q3, equivalent to a 2.9% margin. The company’s cash profitability regressed as it was 14.2 percentage points lower than in the same quarter last year, suggesting its historical struggles have dragged on.
9. Return on Invested Capital (ROIC)
EPS and free cash flow tell us whether a company was profitable while growing its revenue. But was it capital-efficient? Enter ROIC, a metric showing how much operating profit a company generates relative to the money it has raised (debt and equity).
HNI historically did a mediocre job investing in profitable growth initiatives. Its five-year average ROIC was 13.6%, somewhat low compared to the best business services companies that consistently pump out 25%+.
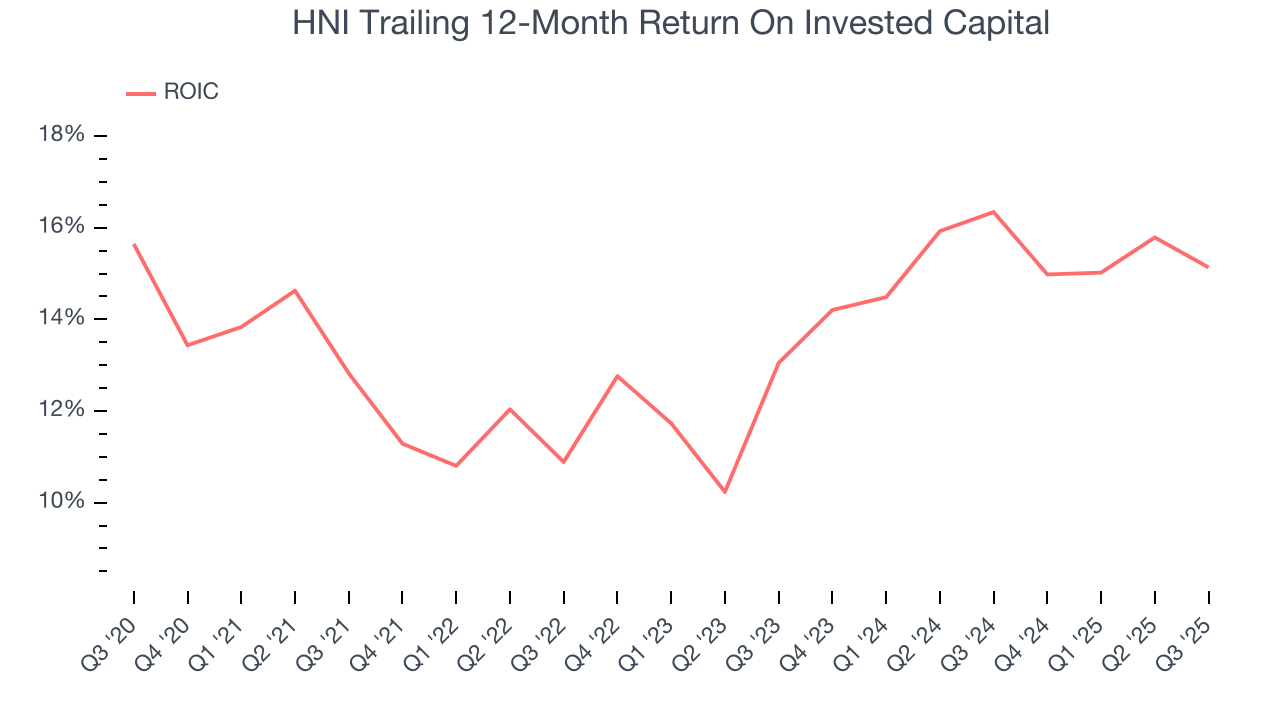
We like to invest in businesses with high returns, but the trend in a company’s ROIC is what often surprises the market and moves the stock price. Over the last few years, HNI’s ROIC averaged 3.9 percentage point increases each year. This is a good sign, and if its returns keep rising, there’s a chance it could evolve into an investable business.
10. Balance Sheet Assessment
HNI reported $28.1 million of cash and $462.4 million of debt on its balance sheet in the most recent quarter. As investors in high-quality companies, we primarily focus on two things: 1) that a company’s debt level isn’t too high and 2) that its interest payments are not excessively burdening the business.
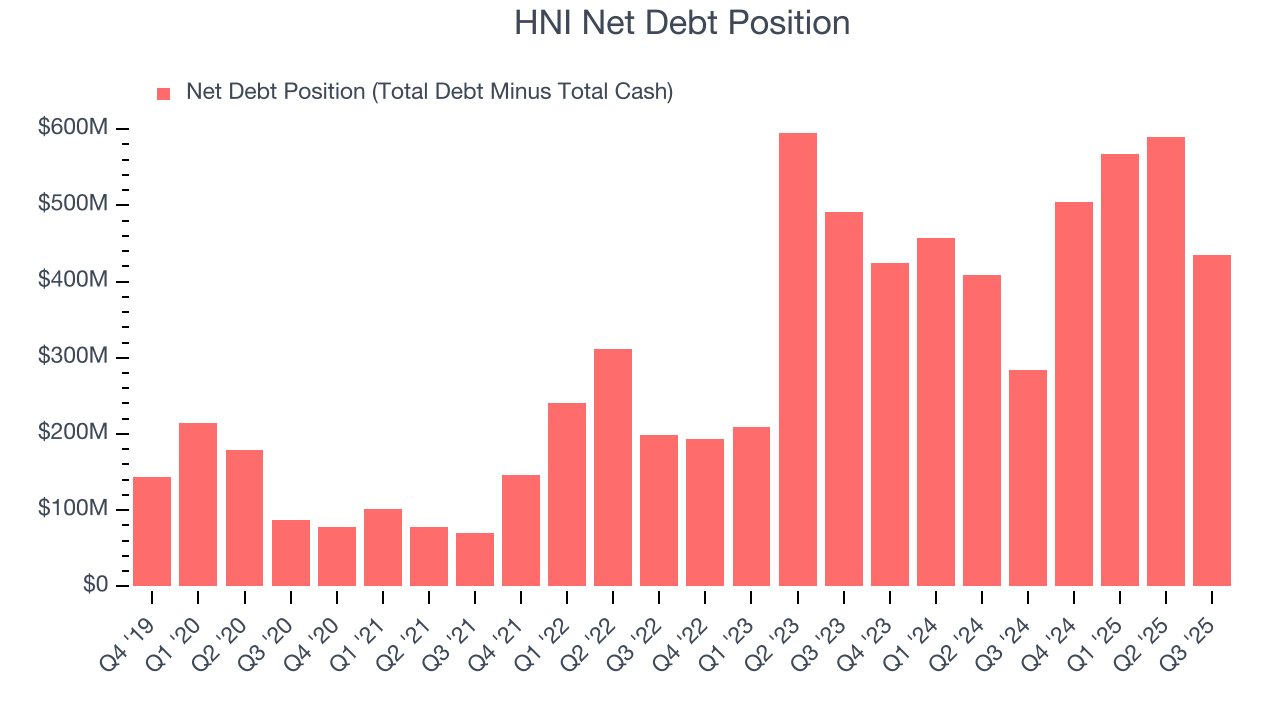
With $253.1 million of EBITDA over the last 12 months, we view HNI’s 1.7× net-debt-to-EBITDA ratio as safe. We also see its $9.5 million of annual interest expenses as appropriate. The company’s profits give it plenty of breathing room, allowing it to continue investing in growth initiatives.
11. Key Takeaways from HNI’s Q3 Results
It was good to see HNI beat analysts’ EPS expectations this quarter. On the other hand, its revenue slightly missed. Overall, this was a weaker quarter. The stock remained flat at $44.95 immediately after reporting.
12. Is Now The Time To Buy HNI?
Updated: January 24, 2026 at 10:52 PM EST
Are you wondering whether to buy HNI or pass? We urge investors to not only consider the latest earnings results but also longer-term business quality and valuation as well.
HNI possesses a number of positive attributes. First off, its revenue growth was decent over the last five years and is expected to accelerate over the next 12 months. And while its operating margins are low compared to other business services companies, its expanding operating margin shows the business has become more efficient. On top of that, its rising returns show management's prior bets are paying off.
HNI’s P/E ratio based on the next 12 months is 12.4x. When scanning the business services space, HNI trades at a fair valuation. If you’re a fan of the business and management team, now is a good time to scoop up some shares.
Wall Street analysts have a consensus one-year price target of $70.75 on the company (compared to the current share price of $47.58), implying they see 48.7% upside in buying HNI in the short term.