Harley-Davidson (HOG)
We wouldn’t buy Harley-Davidson. Its weak sales growth and low returns on capital show it struggled to generate demand and profits.― StockStory Analyst Team
1. News
2. Summary
Why We Think Harley-Davidson Will Underperform
Founded in 1903, Harley-Davidson (NYSE:HOG) is an American motorcycle manufacturer known for its heavyweight motorcycles designed for cruising on highways.
- Lackluster 2% annual revenue growth over the last five years indicates the company is losing ground to competitors
- Forecasted revenue decline of 17% for the upcoming 12 months implies demand will fall even further
- Operating margin falls short of the industry average, and the smaller profit dollars make it harder to react to unexpected market developments


Harley-Davidson doesn’t meet our quality criteria. There’s a wealth of better opportunities.
Why There Are Better Opportunities Than Harley-Davidson


Harley-Davidson’s stock price of $20.92 implies a valuation ratio of 12.9x forward P/E. Harley-Davidson’s multiple may seem like a great deal among consumer discretionary peers, but we think there are valid reasons why it’s this cheap.
Cheap stocks can look like great bargains at first glance, but you often get what you pay for. These mediocre businesses often have less earnings power, meaning there is more reliance on a re-rating to generate good returns - an unlikely scenario for low-quality companies.
3. Harley-Davidson (HOG) Research Report: Q4 CY2025 Update
American motorcycle manufacturing company Harley-Davidson (NYSE:HOG) reported Q4 CY2025 results beating Wall Street’s revenue expectations, but sales fell by 27.9% year on year to $496 million. Its GAAP loss of $2.44 per share was significantly below analysts’ consensus estimates.
Harley-Davidson (HOG) Q4 CY2025 Highlights:
- Revenue: $496 million vs analyst estimates of $479.8 million (27.9% year-on-year decline, 3.4% beat)
- EPS (GAAP): -$2.44 vs analyst estimates of -$1.06 (significant miss)
- Operating Margin: -72.8%, down from -28.1% in the same quarter last year
- Free Cash Flow Margin: 20.2%, up from 11.2% in the same quarter last year
- Motorcycles Sold: 13,500, down 500 year on year
- Market Capitalization: $2.38 billion
Company Overview
Founded in 1903, Harley-Davidson (NYSE:HOG) is an American motorcycle manufacturer known for its heavyweight motorcycles designed for cruising on highways.
Harley-Davidson was established to fulfill the need for a powerful and reliable motorcycle. Its creation was driven by the founders' passion for mechanics and the freedom of the road, leading to the production of motorcycles that would become symbols of American culture and craftsmanship.
Harley-Davidson manufactures and sells an array of heavyweight motorcycles, along with motorcycle parts, accessories, and general merchandise. The company's products are known for their distinctive design, sound, and performance, catering to a global community of enthusiasts seeking the Harley-Davidson riding experience. Additionally, Harley-Davidson offers motorcycle financing services, enhancing accessibility for buyers.
The company's revenue model is multifaceted, encompassing the sale of motorcycles, parts, and accessories, alongside offering financial services such as loans and insurance for buyers. Harley-Davidson also earns from licensing its brand to a variety of merchandise. Its distribution strategy relies on a global network of independent dealerships which also provide maintenance services, further enhancing revenue.
4. Leisure Products
Leisure products cover a wide range of goods in the consumer discretionary sector. Maintaining a strong brand is key to success, and those who differentiate themselves will enjoy customer loyalty and pricing power while those who don’t may find themselves in precarious positions due to the non-essential nature of their offerings.
Competitors in the recreational vehicle industry include Polaris (NYSE:PII), Honda (NYSE:HMC), and Arcimoto (NASDAQ:FUV).
5. Revenue Growth
Reviewing a company’s long-term sales performance reveals insights into its quality. Any business can have short-term success, but a top-tier one grows for years. Regrettably, Harley-Davidson’s sales grew at a weak 2% compounded annual growth rate over the last five years. This was below our standards and is a poor baseline for our analysis.
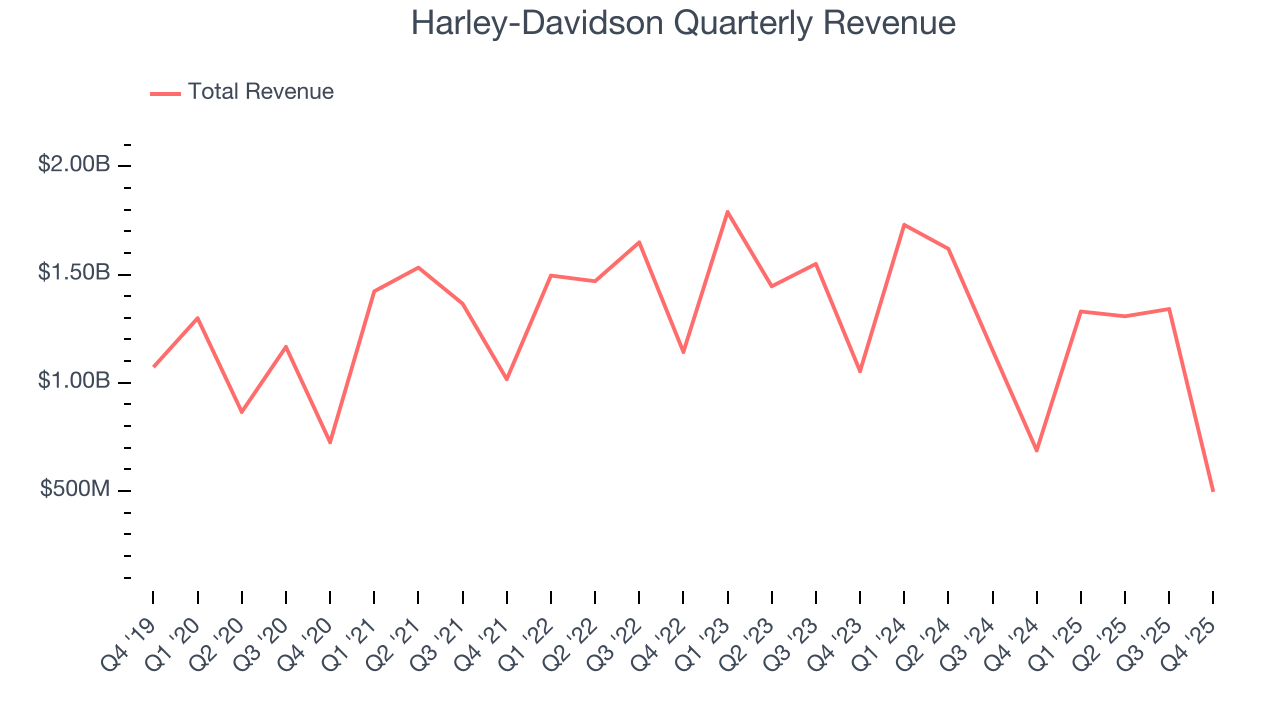
Long-term growth is the most important, but within consumer discretionary, product cycles are short and revenue can be hit-driven due to rapidly changing trends and consumer preferences. Harley-Davidson’s performance shows it grew in the past but relinquished its gains over the last two years, as its revenue fell by 12.5% annually. 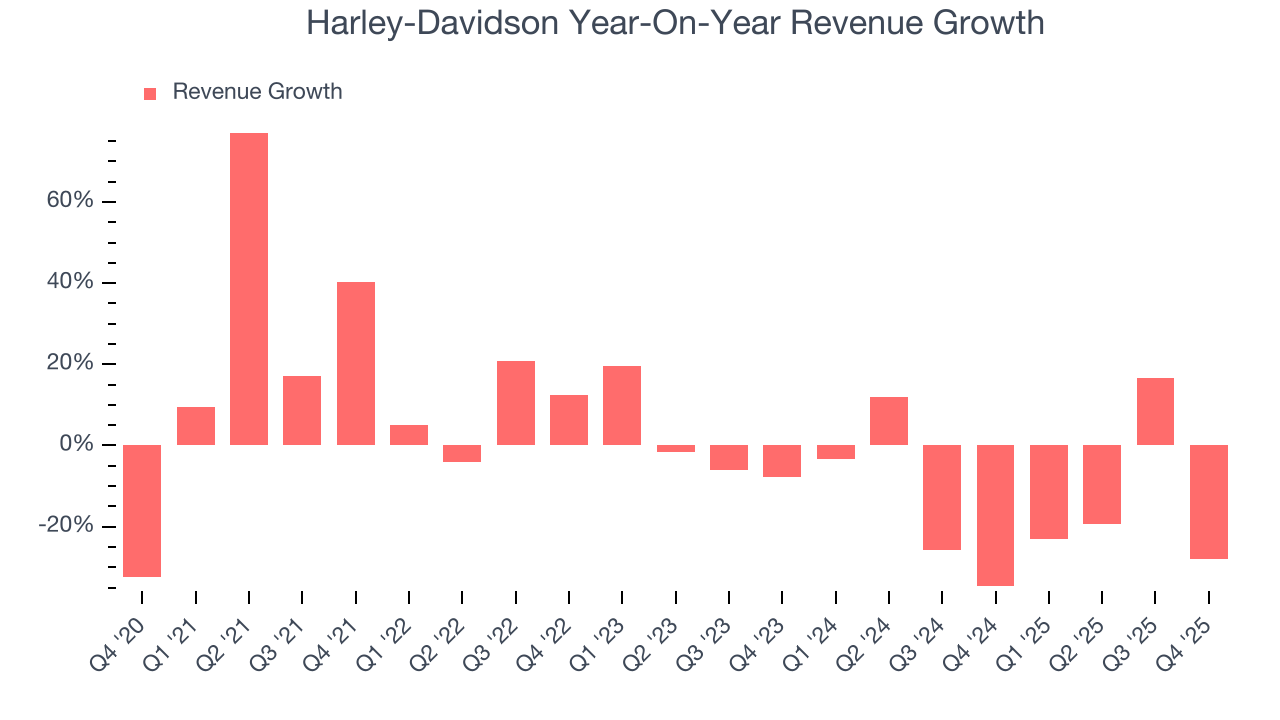
Harley-Davidson also discloses its number of motorcycles sold, which reached 13,500 in the latest quarter. Over the last two years, Harley-Davidson’s motorcycles sold averaged 16.9% year-on-year declines. Because this number is lower than its revenue growth during the same period, we can see the company’s monetization has risen. 
This quarter, Harley-Davidson’s revenue fell by 27.9% year on year to $496 million but beat Wall Street’s estimates by 3.4%.
Looking ahead, sell-side analysts expect revenue to decline by 15.1% over the next 12 months, a slight deceleration versus the last two years. This projection doesn't excite us and implies its products and services will face some demand challenges.
6. Operating Margin
Harley-Davidson’s operating margin might fluctuated slightly over the last 12 months but has remained more or less the same, averaging 8.3% over the last two years. This profitability was inadequate for a consumer discretionary business and caused by its suboptimal cost structure.
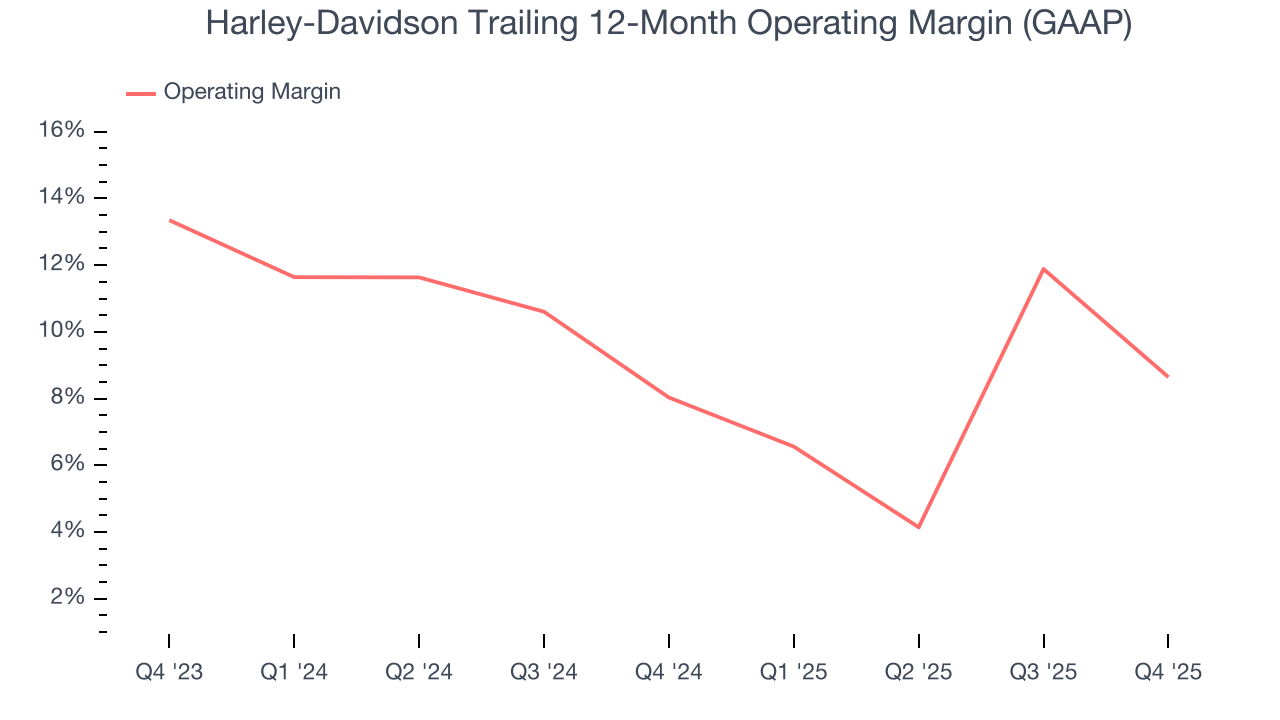
In Q4, Harley-Davidson generated an operating margin profit margin of negative 72.8%, down 44.7 percentage points year on year. This contraction shows it was less efficient because its expenses increased relative to its revenue.
7. Earnings Per Share
Revenue trends explain a company’s historical growth, but the long-term change in earnings per share (EPS) points to the profitability of that growth – for example, a company could inflate its sales through excessive spending on advertising and promotions.
Harley-Davidson’s EPS grew at an astounding 215,899% compounded annual growth rate over the last five years, higher than its 2% annualized revenue growth. However, this alone doesn’t tell us much about its business quality because its operating margin didn’t improve.
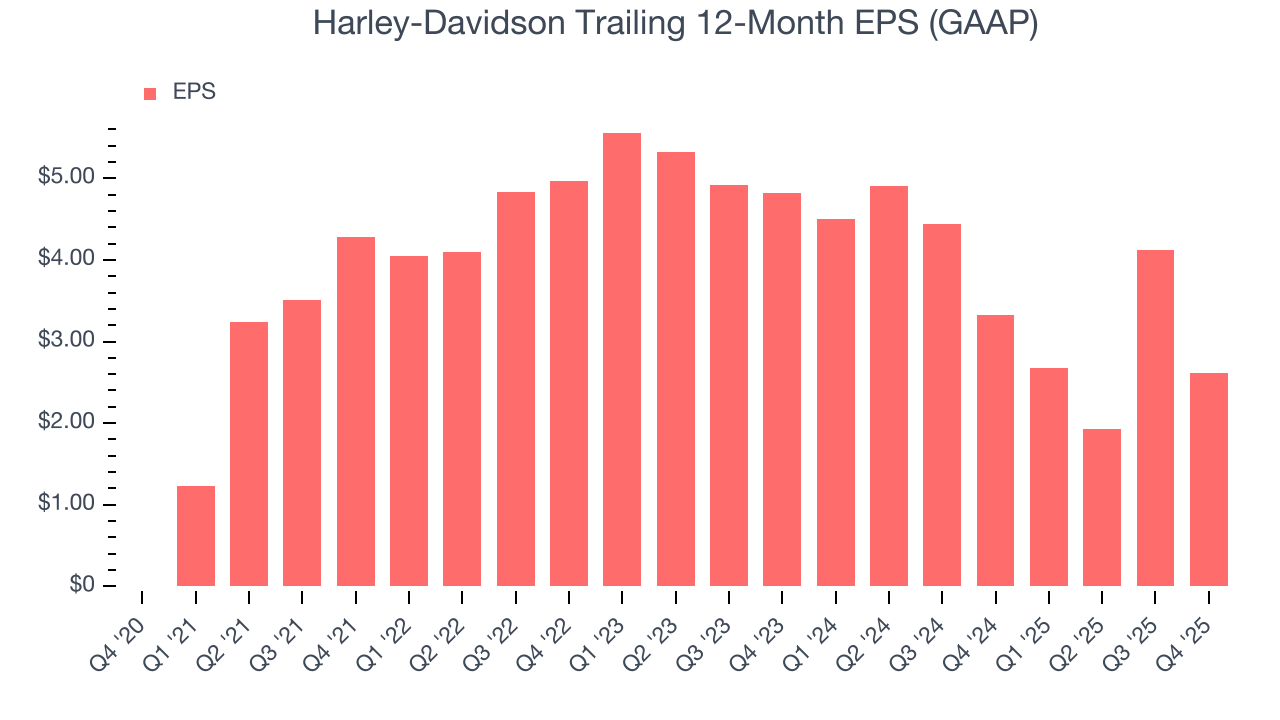
In Q4, Harley-Davidson reported EPS of negative $2.44, down from negative $0.93 in the same quarter last year. This print missed analysts’ estimates, but we care more about long-term EPS growth than short-term movements. Over the next 12 months, Wall Street expects Harley-Davidson’s full-year EPS of $2.61 to shrink by 28.5%.
8. Cash Is King
Although earnings are undoubtedly valuable for assessing company performance, we believe cash is king because you can’t use accounting profits to pay the bills.
Harley-Davidson has shown poor cash profitability over the last two years, giving the company limited opportunities to return capital to shareholders. Its free cash flow margin averaged 13.3%, lousy for a consumer discretionary business.
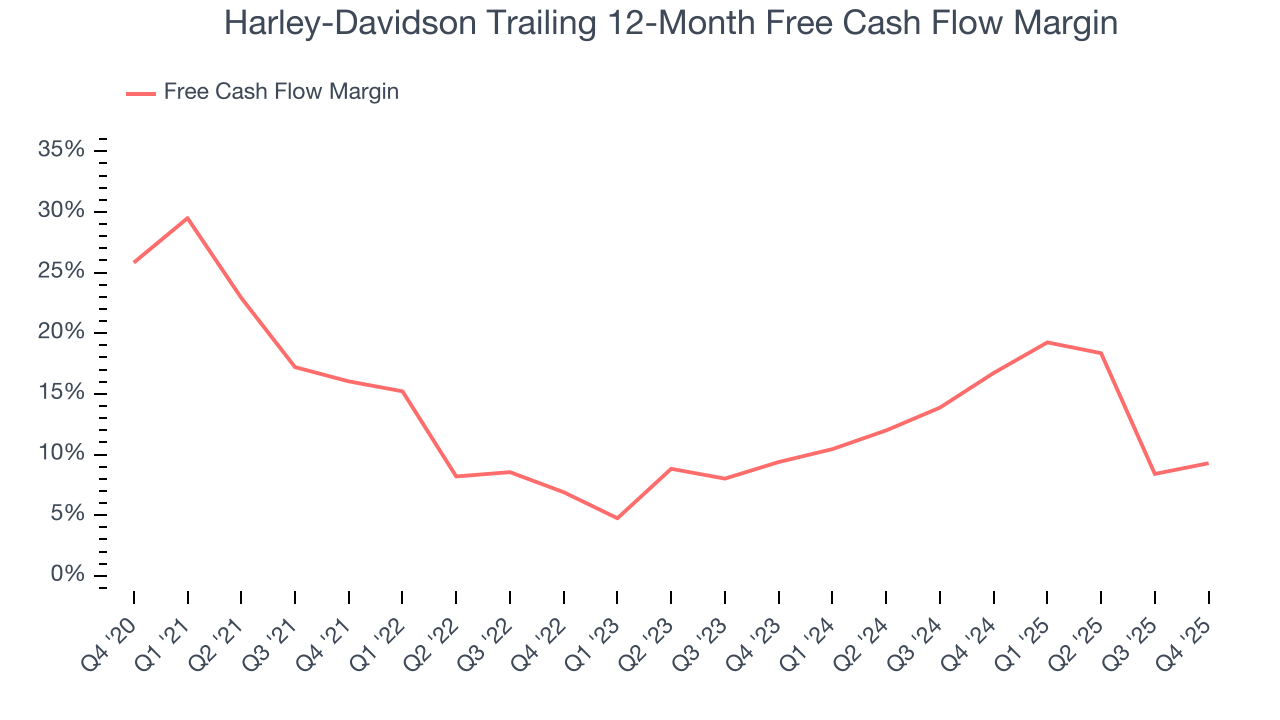
Harley-Davidson’s free cash flow clocked in at $100.4 million in Q4, equivalent to a 20.2% margin. This result was good as its margin was 9 percentage points higher than in the same quarter last year, but we wouldn’t put too much weight on the short term because investment needs can be seasonal, causing temporary swings. Long-term trends carry greater meaning.
Over the next year, analysts predict Harley-Davidson’s cash conversion will slightly improve. Their consensus estimates imply its free cash flow margin of 9.3% for the last 12 months will increase to 11.2%, giving it more flexibility for investments, share buybacks, and dividends.
9. Return on Invested Capital (ROIC)
EPS and free cash flow tell us whether a company was profitable while growing its revenue. But was it capital-efficient? A company’s ROIC explains this by showing how much operating profit it makes compared to the money it has raised (debt and equity).
Harley-Davidson historically did a mediocre job investing in profitable growth initiatives. Its five-year average ROIC was 18.1%, somewhat low compared to the best consumer discretionary companies that consistently pump out 25%+.
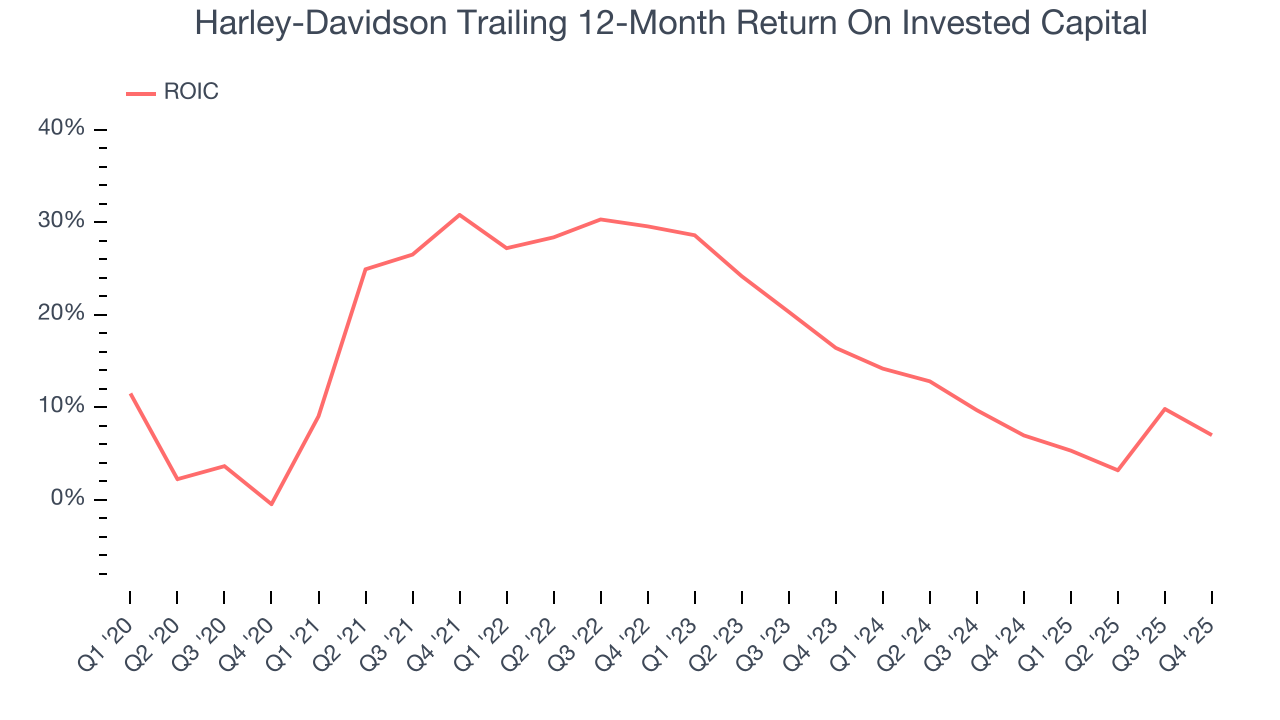
We like to invest in businesses with high returns, but the trend in a company’s ROIC is what often surprises the market and moves the stock price. Over the last few years, Harley-Davidson’s ROIC has unfortunately decreased significantly. Paired with its already low returns, these declines suggest its profitable growth opportunities are few and far between.
10. Balance Sheet Assessment
Harley-Davidson reported $3.09 billion of cash and $3.25 billion of debt on its balance sheet in the most recent quarter. As investors in high-quality companies, we primarily focus on two things: 1) that a company’s debt level isn’t too high and 2) that its interest payments are not excessively burdening the business.
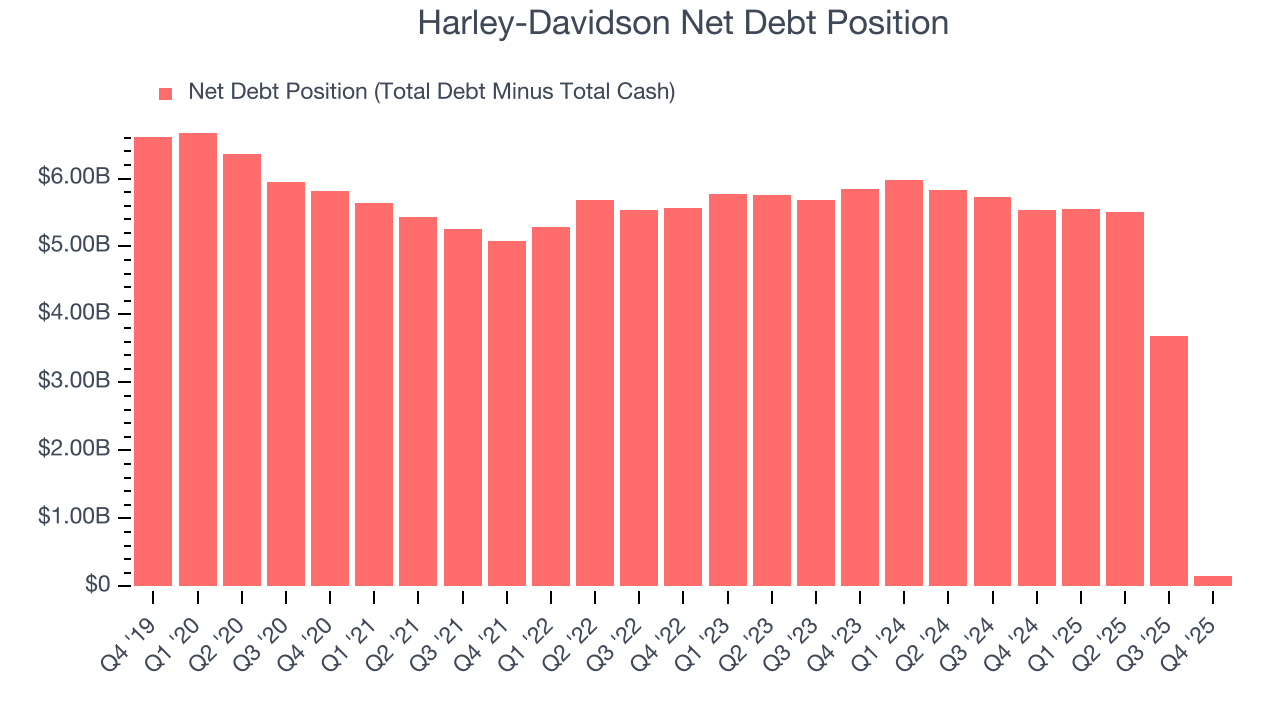
With $285.8 million of EBITDA over the last 12 months, we view Harley-Davidson’s 0.5× net-debt-to-EBITDA ratio as safe. We also see its $2.36 million of annual interest expenses as appropriate. The company’s profits give it plenty of breathing room, allowing it to continue investing in growth initiatives.
11. Key Takeaways from Harley-Davidson’s Q4 Results
It was encouraging to see Harley-Davidson beat analysts’ revenue expectations this quarter. On the other hand, its EPS missed. Overall, this was a softer quarter. The stock traded down 9.9% to $18.14 immediately following the results.
12. Is Now The Time To Buy Harley-Davidson?
Updated: February 10, 2026 at 9:59 PM EST
A common mistake we notice when investors are deciding whether to buy a stock or not is that they simply look at the latest earnings results. Business quality and valuation matter more, so we urge you to understand these dynamics as well.
Harley-Davidson doesn’t pass our quality test. For starters, its revenue growth was weak over the last five years, and analysts expect its demand to deteriorate over the next 12 months. On top of that, Harley-Davidson’s number of motorcycles sold has disappointed, and its Forecasted free cash flow margin suggests the company will have more capital to invest or return to shareholders next year.
Harley-Davidson’s P/E ratio based on the next 12 months is 11.4x. This valuation multiple is fair, but we don’t have much confidence in the company. There are better investments elsewhere.
Wall Street analysts have a consensus one-year price target of $26.50 on the company (compared to the current share price of $20.92).
Although the price target is bullish, readers should exercise caution because analysts tend to be overly optimistic. The firms they work for, often big banks, have relationships with companies that extend into fundraising, M&A advisory, and other rewarding business lines. As a result, they typically hesitate to say bad things for fear they will lose out. We at StockStory do not suffer from such conflicts of interest, so we’ll always tell it like it is.