IDEX (IEX)
IDEX keeps us up at night. Its poor sales growth and falling returns on capital suggest its growth opportunities are shrinking.― StockStory Analyst Team
1. News


2. Summary
Why We Think IDEX Will Underperform
Founded in 1988, IDEX (NYSE:IEX) is a global manufacturer specializing in highly engineered products such as pumps, flow meters, and fluidics systems for various industries.
- Earnings per share fell by 3.1% annually over the last two years while its revenue grew, showing its incremental sales were much less profitable
- Organic sales performance over the past two years indicates the company may need to make strategic adjustments or rely on M&A to catalyze faster growth
- Muted 1.9% annual revenue growth over the last two years shows its demand lagged behind its industrials peers


IDEX falls below our quality standards. Better stocks can be found in the market.
Why There Are Better Opportunities Than IDEX


IDEX’s stock price of $198.53 implies a valuation ratio of 24.4x forward P/E. This multiple is quite expensive for the quality you get.
Paying up for elite businesses with strong earnings potential is better than investing in lower-quality companies with shaky fundamentals. That’s how you avoid big downside over the long term.
3. IDEX (IEX) Research Report: Q3 CY2025 Update
Manufacturing company IDEX (NYSE:IEX) reported Q3 CY2025 results beating Wall Street’s revenue expectations, with sales up 10.1% year on year to $878.7 million. On the other hand, next quarter’s revenue guidance of $871.5 million was less impressive, coming in 2% below analysts’ estimates. Its non-GAAP profit of $2.03 per share was 5.2% above analysts’ consensus estimates.
IDEX (IEX) Q3 CY2025 Highlights:
- Revenue: $878.7 million vs analyst estimates of $861.1 million (10.1% year-on-year growth, 2% beat)
- Adjusted EPS: $2.03 vs analyst estimates of $1.93 (5.2% beat)
- Adjusted EBITDA: $239.8 million vs analyst estimates of $227.2 million (27.3% margin, 5.5% beat)
- Revenue Guidance for Q4 CY2025 is $871.5 million at the midpoint, below analyst estimates of $889.7 million
- Management reiterated its full-year Adjusted EPS guidance of $7.89 at the midpoint
- EBITDA guidance for the full year is $923.7 million at the midpoint, in line with analyst expectations
- Operating Margin: 21.1%, in line with the same quarter last year
- Free Cash Flow Margin: 21.5%, down from 24% in the same quarter last year
- Organic Revenue rose 5% year on year vs analyst estimates of 2.6% growth (235.7 basis point beat)
- Market Capitalization: $12.57 billion
Company Overview
Founded in 1988, IDEX (NYSE:IEX) is a global manufacturer specializing in highly engineered products such as pumps, flow meters, and fluidics systems for various industries.
IDEX was formed when KKR purchased several divisions of Houdaille Industries, a diversified manufacturing company. From the beginning, IDEX’s strategy was to acquire businesses in niche markets and focus on products that moved, measured, and controlled fluids.
The early years were marked by significant acquisitions such as the 1988 acquisition of Viking Pump Company, which produced different pumps for industrial and chemical applications. If you enjoy chocolate, there's a good chance it was processed using a Viking Pump. Throughout the 1990s and 2000s, IDEX expanded its portfolio through further acquisitions, adding companies like Band-It, a leader in stainless steel banding systems, and Hale Products, which specializes in fire and rescue pumping solutions, known for the Hurst "Jaws of Life".
Today, IDEX operates in three distinct categories: fluid and meter technologies, health and science technologies, and fire & safety products. These products serve various markets such as life sciences, industrial processes, such as food and beverage, and fire safety. For instance, its foam systems tackle fire scenarios involving flammable liquids.
A substantial portion of the company’s revenue comes from the sale of equipment. However, IDEX also benefits from recurring revenue streams, including aftermarket parts, maintenance services, and consumables, which are needed for the ongoing operation of the equipment they sell. Additionally, IDEX secures long-term contracts, particularly in the health and science technologies sector, where regular upgrades and service agreements provide steady revenue
IDEX continues to employ an aggressive acquisition strategy. The company targets companies that lead in niche markets or possess specialized technology that complements or enhances IDEX’s existing product offerings.
4. Gas and Liquid Handling
Gas and liquid handling companies possess the technical know-how and specialized equipment to handle valuable (and sometimes dangerous) substances. Lately, water conservation and carbon capture–which requires hydrogen and other gasses as well as specialized infrastructure–have been trending up, creating new demand for products such as filters, pumps, and valves. On the other hand, gas and liquid handling companies are at the whim of economic cycles. Consumer spending and interest rates, for example, can greatly impact the industrial production that drives demand for these companies’ offerings.
Competitors offering similar products include Dover (NYSE:DOV), Xylem (NYSE:XYL), and Parker Hannifin (NYSE:PH).
5. Revenue Growth
Examining a company’s long-term performance can provide clues about its quality. Any business can experience short-term success, but top-performing ones enjoy sustained growth for years. Thankfully, IDEX’s 7.9% annualized revenue growth over the last five years was decent. Its growth was slightly above the average industrials company and shows its offerings resonate with customers.
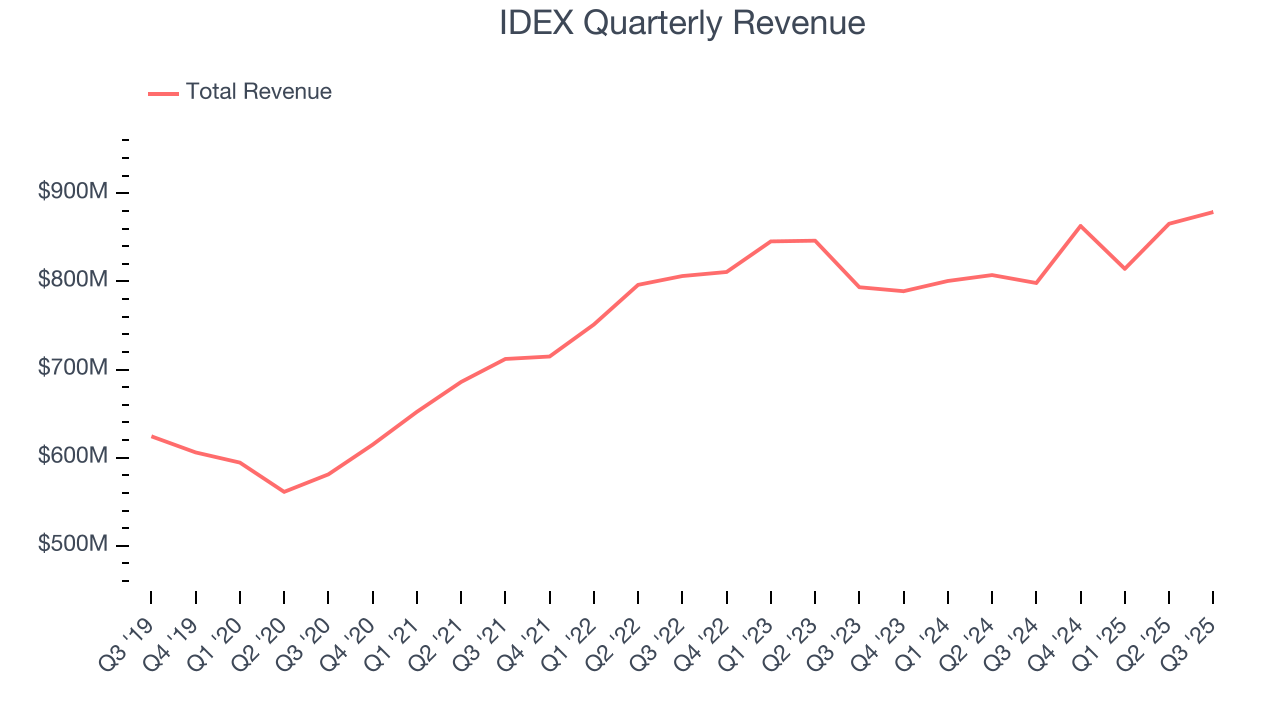
We at StockStory place the most emphasis on long-term growth, but within industrials, a half-decade historical view may miss cycles, industry trends, or a company capitalizing on catalysts such as a new contract win or a successful product line. IDEX’s recent performance shows its demand has slowed as its annualized revenue growth of 1.9% over the last two years was below its five-year trend. 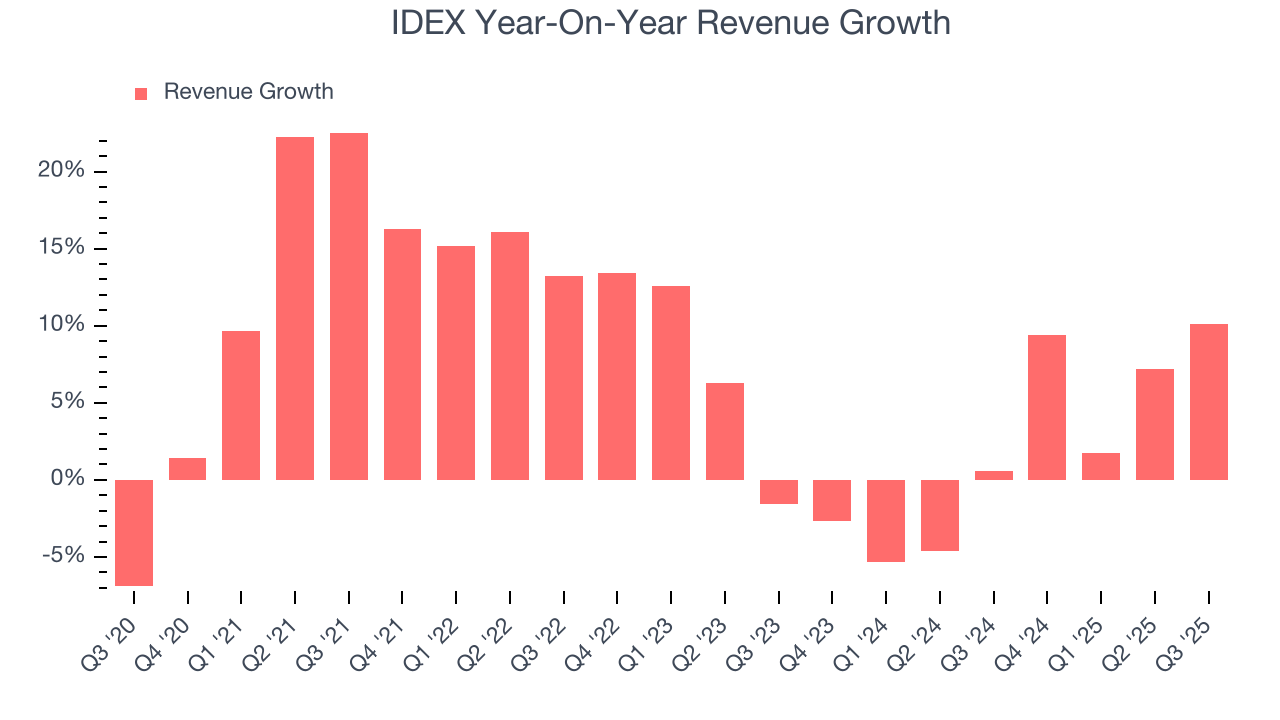
We can dig further into the company’s sales dynamics by analyzing its organic revenue, which strips out one-time events like acquisitions and currency fluctuations that don’t accurately reflect its fundamentals. Over the last two years, IDEX’s organic revenue was flat. Because this number is lower than its two-year revenue growth, we can see that some mixture of acquisitions and foreign exchange rates boosted its headline results. 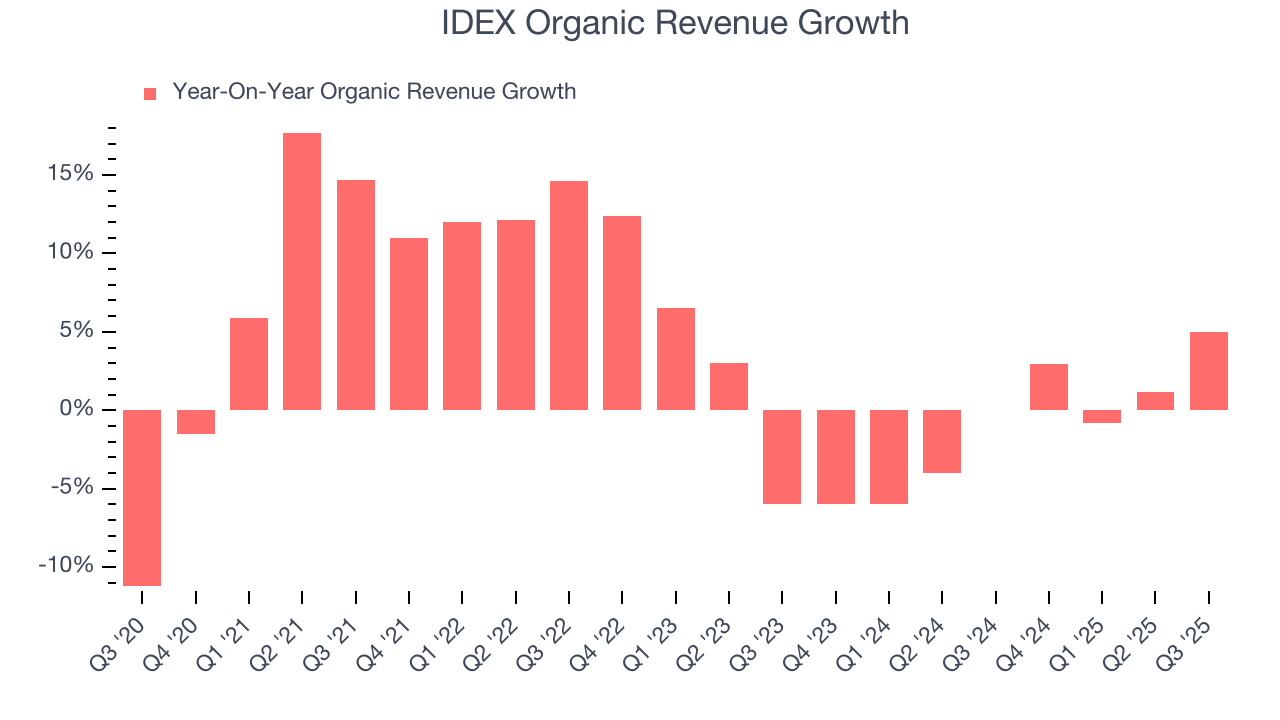
This quarter, IDEX reported year-on-year revenue growth of 10.1%, and its $878.7 million of revenue exceeded Wall Street’s estimates by 2%. Company management is currently guiding for a 1% year-on-year increase in sales next quarter.
Looking further ahead, sell-side analysts expect revenue to grow 3.4% over the next 12 months. Although this projection implies its newer products and services will spur better top-line performance, it is still below the sector average.
6. Gross Margin & Pricing Power
All else equal, we prefer higher gross margins because they make it easier to generate more operating profits and indicate that a company commands pricing power by offering more differentiated products.
IDEX has best-in-class unit economics for an industrials company, enabling it to invest in areas such as research and development. Its margin also signals it sells differentiated products, not commodities. As you can see below, it averaged an elite 44.6% gross margin over the last five years. Said differently, roughly $44.60 was left to spend on selling, marketing, R&D, and general administrative overhead for every $100 in revenue. 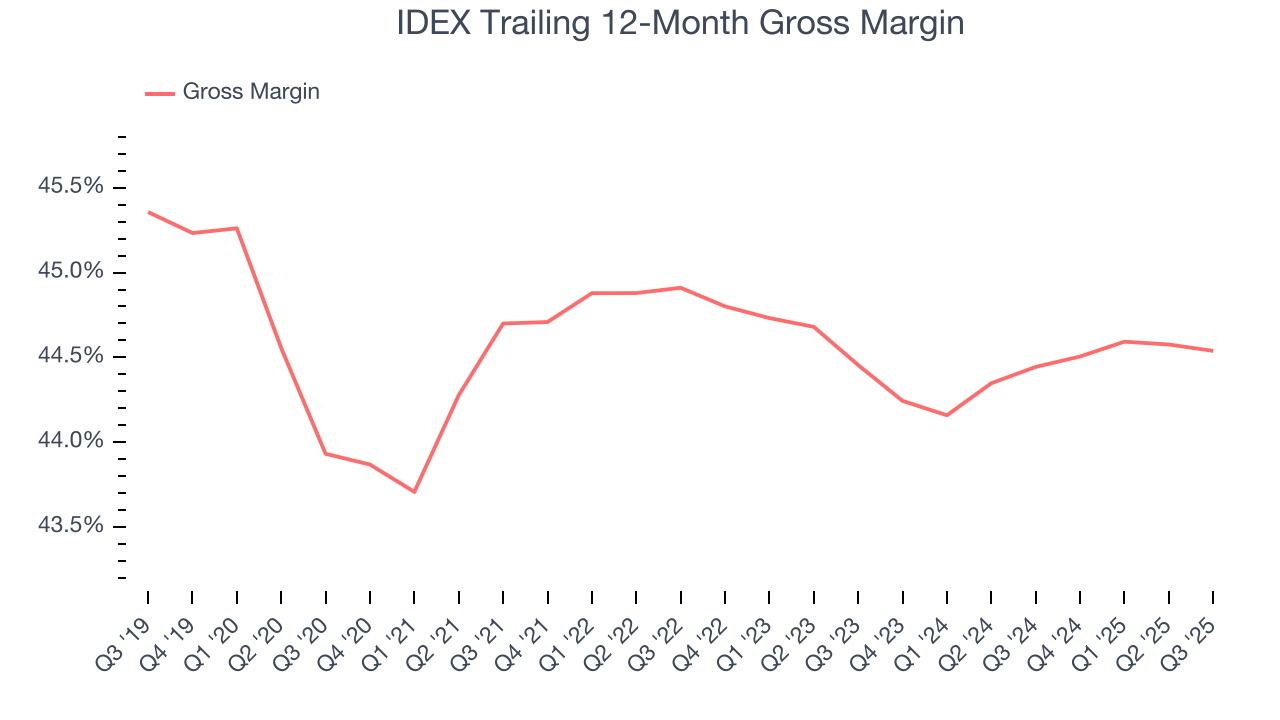
IDEX’s gross profit margin came in at 44.5% this quarter, in line with the same quarter last year. On a wider time horizon, the company’s full-year margin has remained steady over the past four quarters, suggesting its input costs (such as raw materials and manufacturing expenses) have been stable and it isn’t under pressure to lower prices.
7. Operating Margin
Operating margin is one of the best measures of profitability because it tells us how much money a company takes home after procuring and manufacturing its products, marketing and selling those products, and most importantly, keeping them relevant through research and development.
IDEX has been a well-oiled machine over the last five years. It demonstrated elite profitability for an industrials business, boasting an average operating margin of 22.1%. This result isn’t surprising as its high gross margin gives it a favorable starting point.
Analyzing the trend in its profitability, IDEX’s operating margin decreased by 3.1 percentage points over the last five years. This raises questions about the company’s expense base because its revenue growth should have given it leverage on its fixed costs, resulting in better economies of scale and profitability.
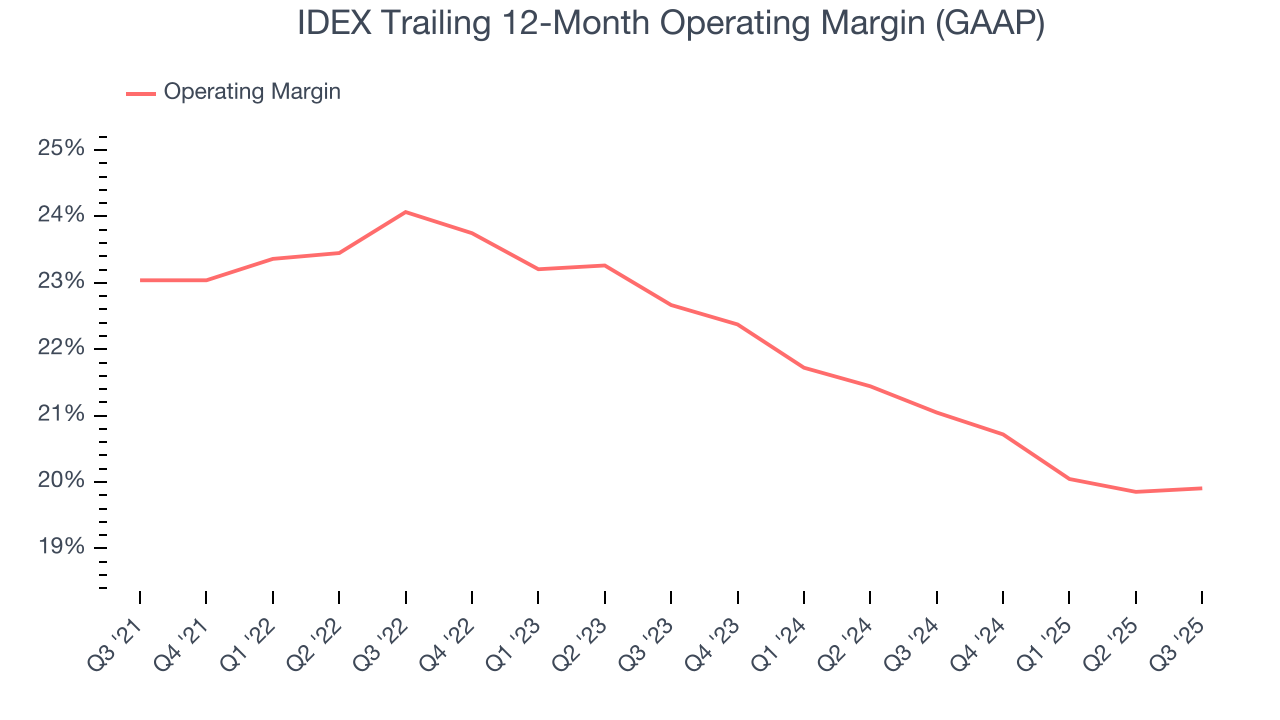
This quarter, IDEX generated an operating margin profit margin of 21.1%, in line with the same quarter last year. This indicates the company’s cost structure has recently been stable.
8. Earnings Per Share
Revenue trends explain a company’s historical growth, but the long-term change in earnings per share (EPS) points to the profitability of that growth – for example, a company could inflate its sales through excessive spending on advertising and promotions.
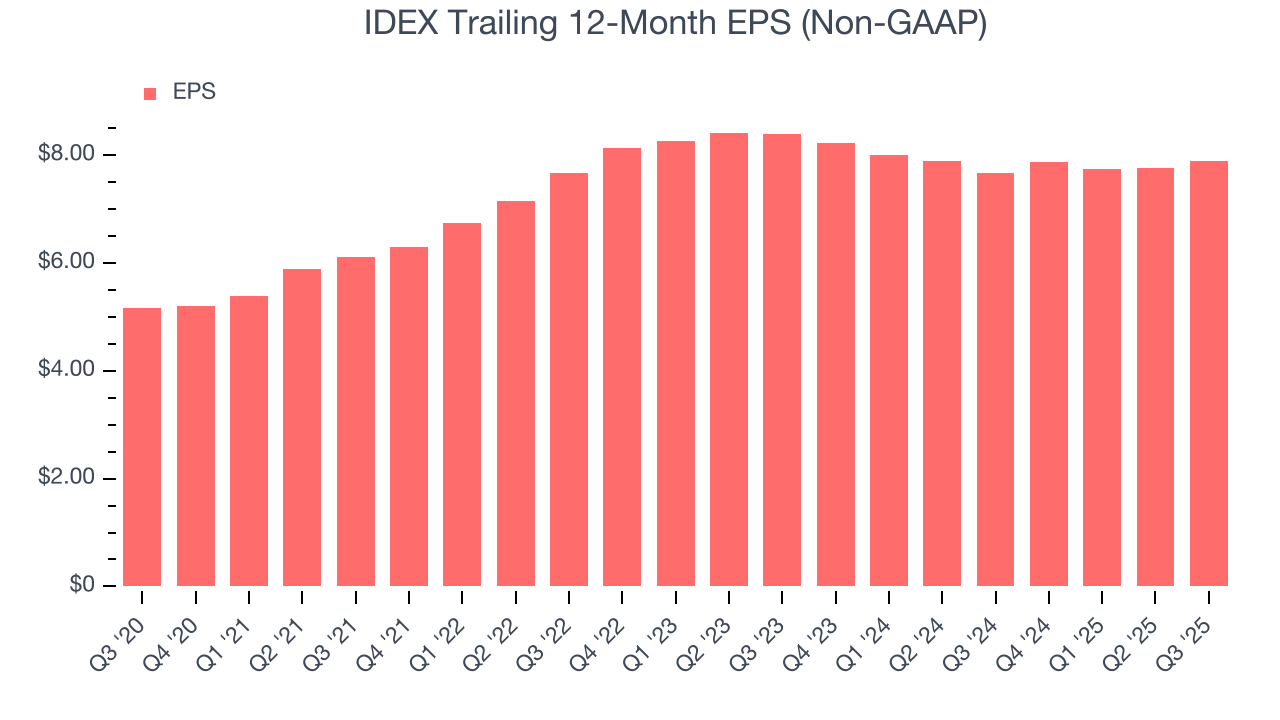
IDEX’s decent 8.9% annual EPS growth over the last five years aligns with its revenue performance. This tells us it maintained its per-share profitability as it expanded.
Like with revenue, we analyze EPS over a more recent period because it can provide insight into an emerging theme or development for the business.
IDEX’s two-year annual EPS declines of 3.1% were bad and lower than its 1.9% two-year revenue growth.
We can take a deeper look into IDEX’s earnings to better understand the drivers of its performance. While we mentioned earlier that IDEX’s operating margin was flat this quarter, a two-year view shows its margin has declined. This was the most relevant factor (aside from the revenue impact) behind its lower earnings; interest expenses and taxes can also affect EPS but don’t tell us as much about a company’s fundamentals.
In Q3, IDEX reported adjusted EPS of $2.03, up from $1.90 in the same quarter last year. This print beat analysts’ estimates by 5.2%. Over the next 12 months, Wall Street expects IDEX’s full-year EPS of $7.89 to grow 6%.
9. Cash Is King
Free cash flow isn't a prominently featured metric in company financials and earnings releases, but we think it's telling because it accounts for all operating and capital expenses, making it tough to manipulate. Cash is king.
IDEX has shown terrific cash profitability, putting it in an advantageous position to invest in new products, return capital to investors, and consolidate the market during industry downturns. The company’s free cash flow margin was among the best in the industrials sector, averaging 17.8% over the last five years.
Taking a step back, we can see that IDEX’s margin dropped by 1.9 percentage points during that time. Continued declines could signal it is in the middle of an investment cycle.
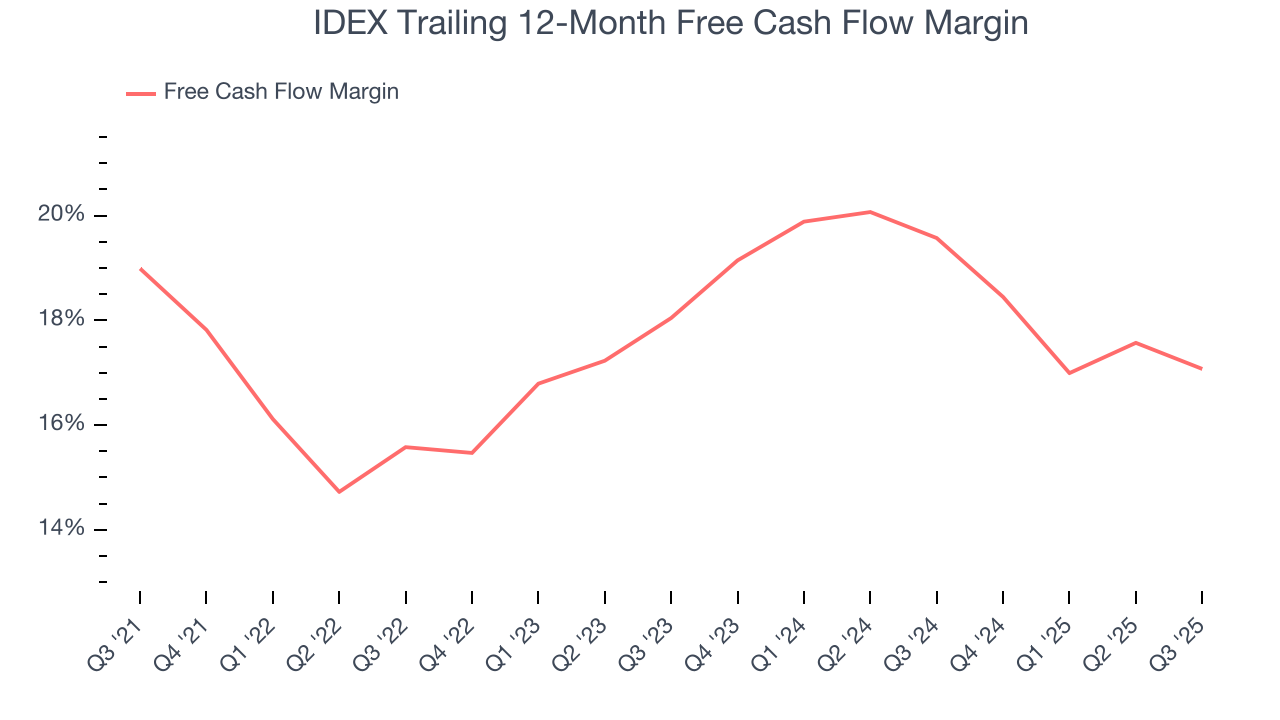
IDEX’s free cash flow clocked in at $188.7 million in Q3, equivalent to a 21.5% margin. The company’s cash profitability regressed as it was 2.5 percentage points lower than in the same quarter last year, but it’s still above its five-year average. We wouldn’t read too much into this quarter’s decline because investment needs can be seasonal, causing short-term swings. Long-term trends are more important.
10. Return on Invested Capital (ROIC)
EPS and free cash flow tell us whether a company was profitable while growing its revenue. But was it capital-efficient? Enter ROIC, a metric showing how much operating profit a company generates relative to the money it has raised (debt and equity).
Although IDEX hasn’t been the highest-quality company lately, it historically found a few growth initiatives that worked. Its five-year average ROIC was 13.3%, higher than most industrials businesses.
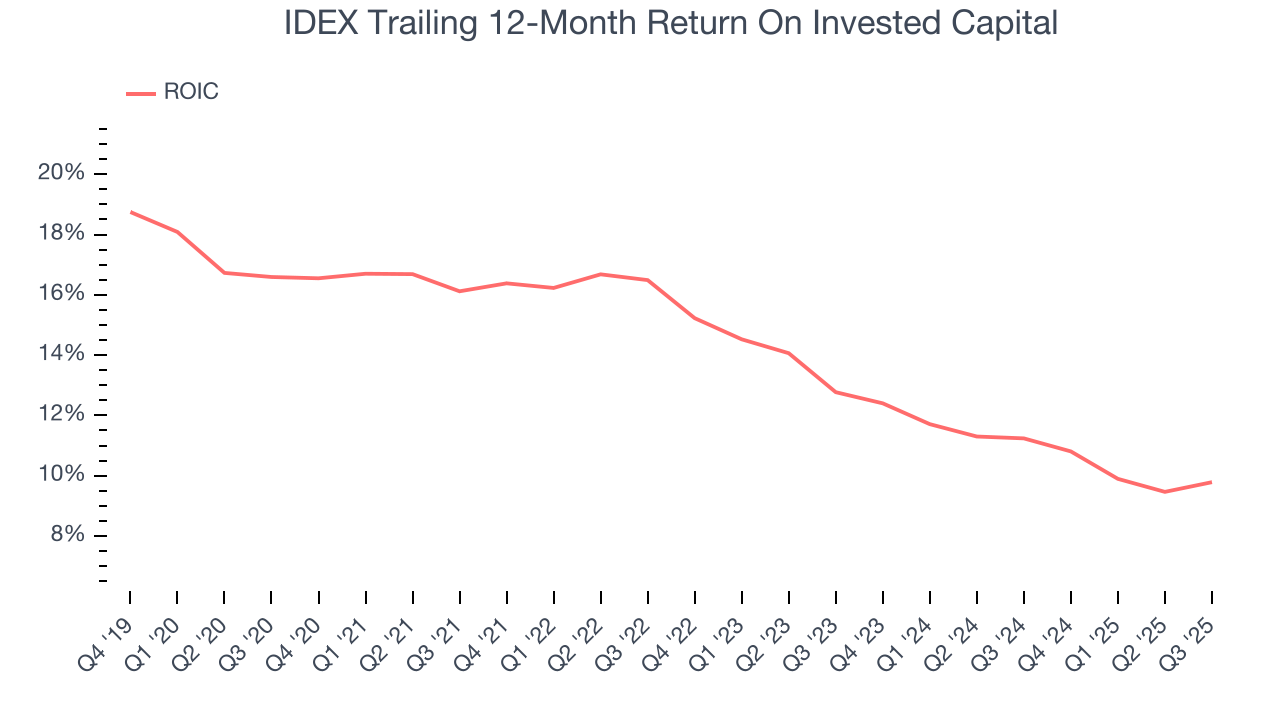
We like to invest in businesses with high returns, but the trend in a company’s ROIC is what often surprises the market and moves the stock price. Unfortunately, IDEX’s ROIC has decreased over the last few years. We like what management has done in the past, but its declining returns are perhaps a symptom of fewer profitable growth opportunities.
11. Balance Sheet Assessment
IDEX reported $593.8 million of cash and $1.90 billion of debt on its balance sheet in the most recent quarter. As investors in high-quality companies, we primarily focus on two things: 1) that a company’s debt level isn’t too high and 2) that its interest payments are not excessively burdening the business.
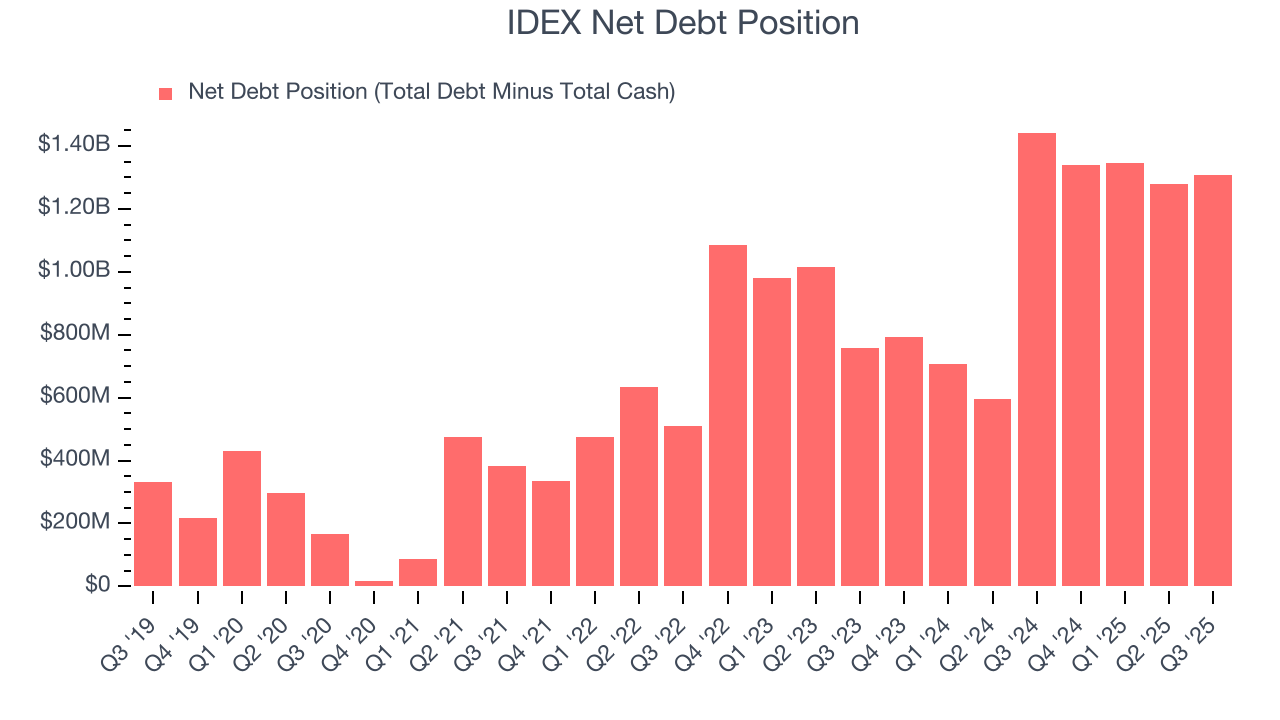
With $912.5 million of EBITDA over the last 12 months, we view IDEX’s 1.4× net-debt-to-EBITDA ratio as safe. We also see its $31.9 million of annual interest expenses as appropriate. The company’s profits give it plenty of breathing room, allowing it to continue investing in growth initiatives.
12. Key Takeaways from IDEX’s Q3 Results
We enjoyed seeing IDEX beat analysts’ organic revenue expectations this quarter. We were also glad its EBITDA outperformed Wall Street’s estimates. On the other hand, its revenue guidance for next quarter missed. Overall, we think this was a solid quarter with some key areas of upside. The stock traded up 1.8% to $170 immediately following the results.
13. Is Now The Time To Buy IDEX?
Updated: January 30, 2026 at 10:39 PM EST
We think that the latest earnings result is only one piece of the bigger puzzle. If you’re deciding whether to own IDEX, you should also grasp the company’s longer-term business quality and valuation.
We see the value of companies helping their customers, but in the case of IDEX, we’re out. Although its revenue growth was decent over the last five years, it’s expected to deteriorate over the next 12 months and its diminishing returns show management's prior bets haven't worked out. And while the company’s powerful free cash flow generation enables it to stay ahead of the competition through consistent reinvestment of profits, the downside is its flat organic revenue disappointed.
IDEX’s P/E ratio based on the next 12 months is 24.4x. This multiple tells us a lot of good news is priced in - we think there are better opportunities elsewhere.
Wall Street analysts have a consensus one-year price target of $198.62 on the company (compared to the current share price of $198.53).