
Macy's (M)
We wouldn’t buy Macy's. Not only are its sales cratering but also its low returns on capital suggest it struggles to generate profits.― StockStory Analyst Team
1. News


2. Summary
Why We Think Macy's Will Underperform
With a storied history that began with its 1858 founding, Macy’s (NYSE:M) is a department store chain that sells clothing, cosmetics, accessories, and home goods.
- Recent store closures and weak same-store sales point to soft demand and an operational restructuring
- Sales tumbled by 4.2% annually over the last three years, showing consumer trends are working against its favor
- Earnings per share have dipped by 22.4% annually over the past three years, which is concerning because stock prices follow EPS over the long term


Macy's doesn’t measure up to our expectations. We’re redirecting our focus to better businesses.
Why There Are Better Opportunities Than Macy's


At $16.91 per share, Macy's trades at 7.9x forward P/E. Macy’s valuation may seem like a bargain, but we think there are valid reasons why it’s so cheap.
Cheap stocks can look like great bargains at first glance, but you often get what you pay for. These mediocre businesses often have less earnings power, meaning there is more reliance on a re-rating to generate good returns - an unlikely scenario for low-quality companies.
3. Macy's (M) Research Report: Q4 CY2025 Update
Department store chain Macy’s (NYSE:M) reported Q4 CY2025 results topping the market’s revenue expectations, but sales fell by 1.1% year on year to $7.92 billion. The company’s full-year revenue guidance of $21.53 billion at the midpoint came in 2.6% above analysts’ estimates. Its non-GAAP profit of $1.67 per share was 6.8% above analysts’ consensus estimates.
Macy's (M) Q4 CY2025 Highlights:
- Revenue: $7.92 billion vs analyst estimates of $7.78 billion (1.1% year-on-year decline, 1.7% beat)
- Adjusted EPS: $1.67 vs analyst estimates of $1.56 (6.8% beat)
- Adjusted EBITDA: $840 million vs analyst estimates of $812 million (10.6% margin, 3.4% beat)
- Adjusted EPS guidance for the upcoming financial year 2026 is $2 at the midpoint, missing analyst estimates by 6.5%
- Operating Margin: 9.4%, up from 6.2% in the same quarter last year
- Free Cash Flow Margin: 12.2%, down from 13.4% in the same quarter last year
- Same-Store Sales rose 1.8% year on year (0.2% in the same quarter last year)
- Market Capitalization: $4.50 billion
Company Overview
With a storied history that began with its 1858 founding, Macy’s (NYSE:M) is a department store chain that sells clothing, cosmetics, accessories, and home goods.
As the name suggests, a department store offers a wide variety of merchandise organized into different departments or sections. Before the introduction of department stores in the 19th century, consumers would have to visit three different stores to buy a hat, a bottle of perfume, and pillows for their bedroom. While not the first department store, Macy’s was a pioneer.
Today, the core customer is a woman between the ages of 25 and 54 who is looking for name-brand products in a variety of categories. This customer can find prominent brands such as Calvin Klein, Levi’s, MAC, Cuisinart, and Sony in a Macy’s store or on its e-commerce site. Stores tend to be large, between 100,000 and 200,000 square feet, and serving as anchor tenants in many suburban malls. Common departments in a store include women’s/men’s/children’s apparel, beauty/cosmetics, and home goods. Additionally, Macy's has an active e-commerce presence, launched in 1997 as one of the first major retailers to offer online purchases.
Since the introduction of e-commerce, Macy’s and peers have faced increased competition. Evolving specialty retailers and developments such as fast fashion have also pressured the department store model.
4. Department Store
Department stores emerged in the 19th century to provide customers with a wide variety of merchandise under one roof, offering a convenient and luxurious shopping experience. They played an important role in the history of American retail and urbanization, and prior to department stores, retailers tended to sell narrow specialty and niche items. But what was once new is now old, and department stores are somewhat considered a relic of the past. They are being attacked from multiple angles–stagnant foot traffic at malls where they’ve served as anchors; more nimble off-price and fast-fashion retailers; and e-commerce-first competitors not burdened by large physical footprints.
Department or general merchandise retail competitors include Nordstrom (NYSE:JWN), Kohl’s (NYSE:KSS), and Dillard’s (NYSE:DDS).
5. Revenue Growth
A company’s long-term performance is an indicator of its overall quality. Any business can have short-term success, but a top-tier one grows for years.
With $22.62 billion in revenue over the past 12 months, Macy's is one of the larger companies in the consumer retail industry and benefits from a well-known brand that influences purchasing decisions. However, its scale is a double-edged sword because there are only a finite number of places to build new stores, making it harder to find incremental growth. To accelerate sales, Macy's likely needs to optimize its pricing or lean into international expansion.
As you can see below, Macy’s revenue declined by 3.9% per year over the last three years as it closed stores.
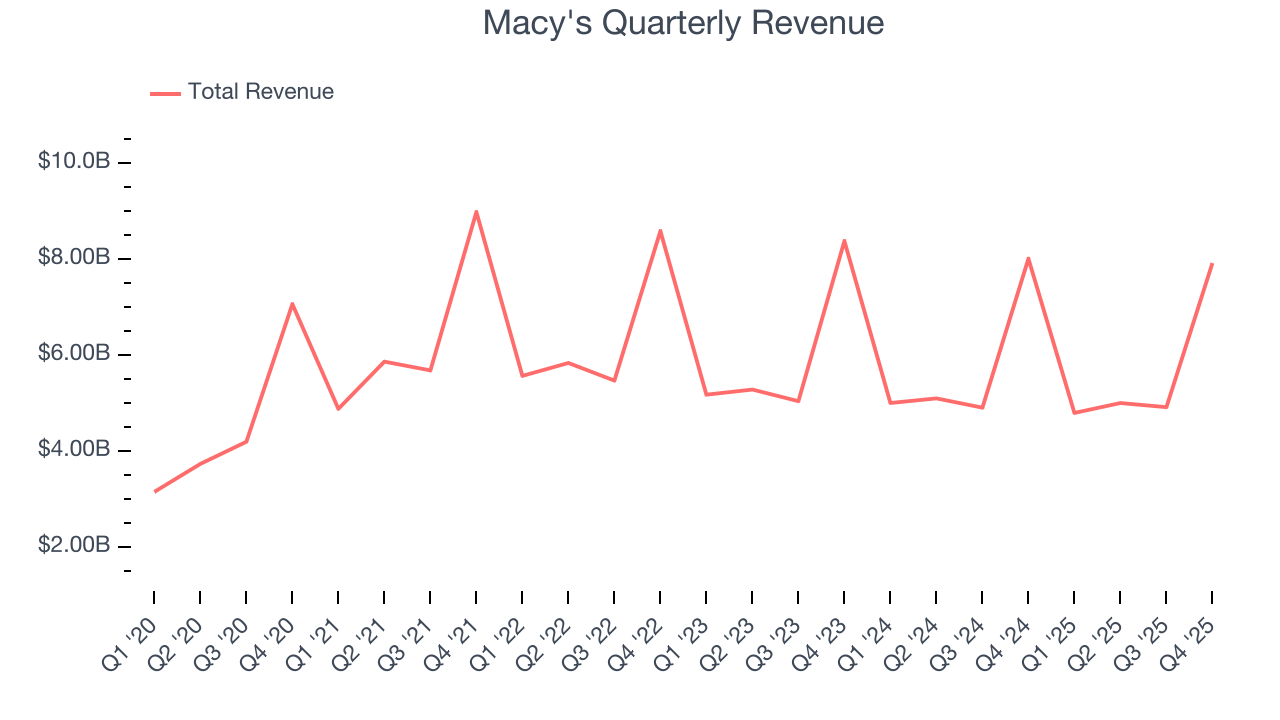
This quarter, Macy’s revenue fell by 1.1% year on year to $7.92 billion but beat Wall Street’s estimates by 1.7%.
Looking ahead, sell-side analysts expect revenue to decline by 3.1% over the next 12 months, similar to its three-year rate. This projection is underwhelming and indicates its newer products will not accelerate its top-line performance yet.
6. Store Performance
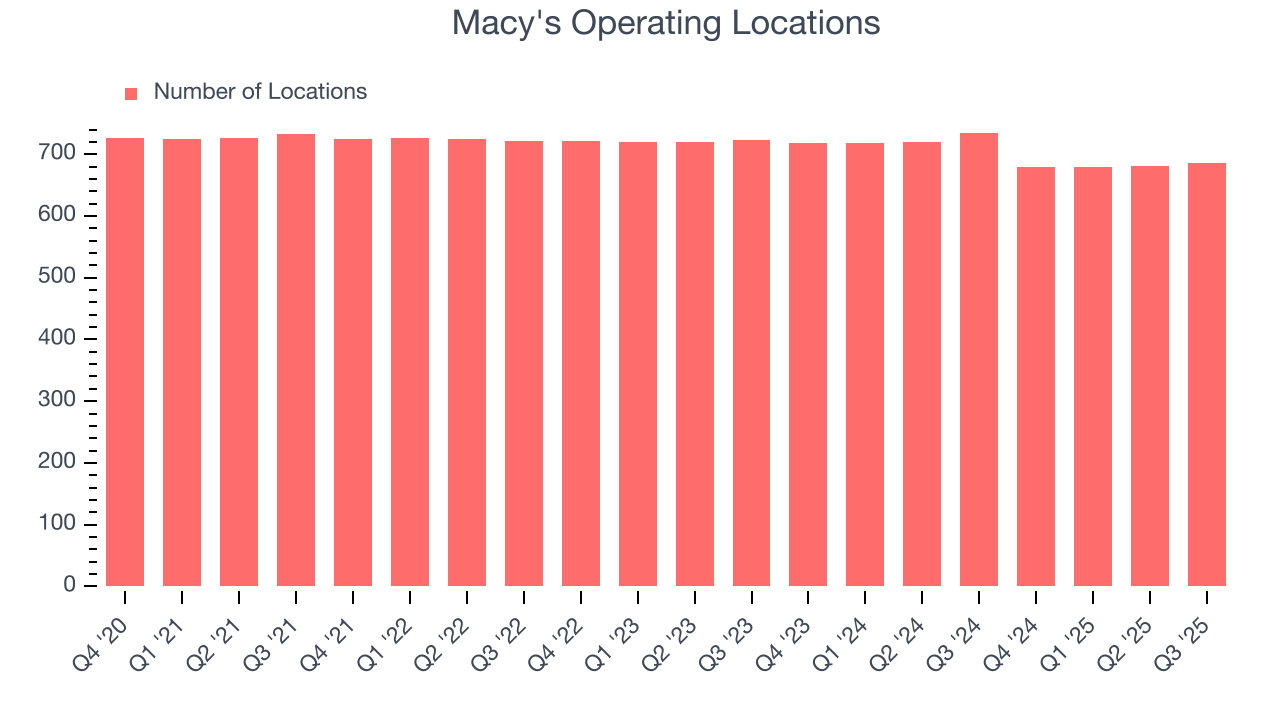
Number of Stores
A retailer’s store count influences how much it can sell and how quickly revenue can grow.
Macy's has generally closed its stores over the last two years, averaging 3.1% annual declines.
When a retailer shutters stores, it usually means that brick-and-mortar demand is less than supply, and it is responding by closing underperforming locations to improve profitability.
Note that Macy's reports its store count intermittently, so some data points are missing in the chart below.
Same-Store Sales
A company's store base only paints one part of the picture. When demand is high, it makes sense to open more. But when demand is low, it’s prudent to close some locations and use the money in other ways. Same-store sales provides a deeper understanding of this issue because it measures organic growth at brick-and-mortar shops for at least a year.
Macy’s demand within its existing locations has barely increased over the last two years as its same-store sales were flat. This performance isn’t ideal, and Macy's is attempting to boost same-store sales by closing stores (fewer locations sometimes lead to higher same-store sales).
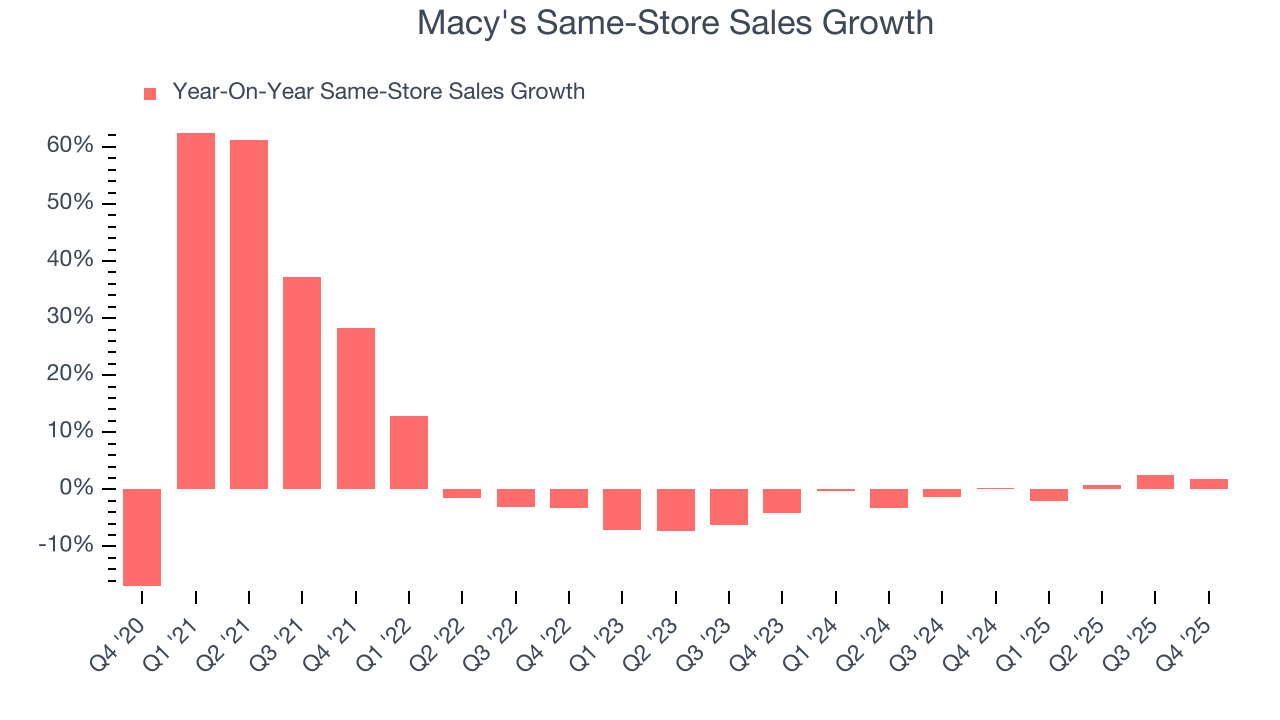
In the latest quarter, Macy’s same-store sales rose 1.8% year on year. This growth was a well-appreciated turnaround from its historical levels, showing the business is regaining momentum.
7. Gross Margin & Pricing Power
Macy’s unit economics are higher than the typical retailer, giving it the flexibility to invest in areas such as marketing and talent to reach more consumers. As you can see below, it averaged a decent 40.3% gross margin over the last two years. Said differently, Macy's paid its suppliers $59.69 for every $100 in revenue. 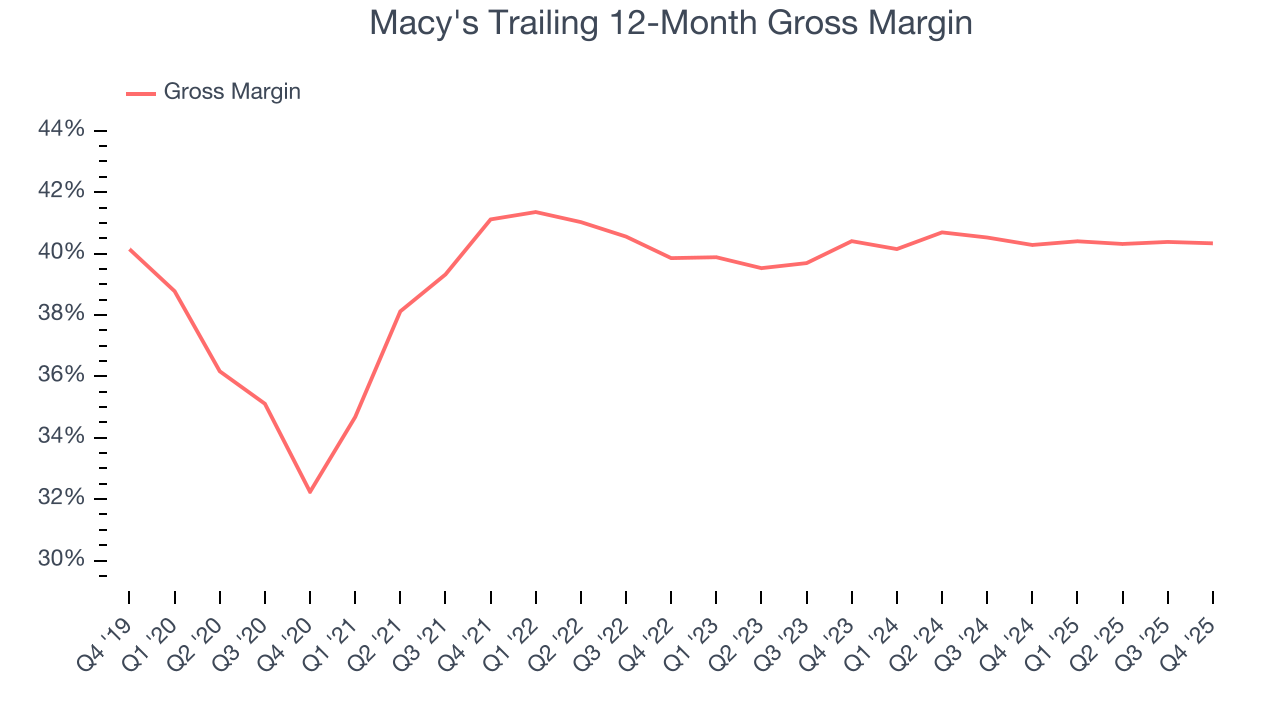
This quarter, Macy’s gross profit margin was 37.5%, in line with the same quarter last year. On a wider time horizon, the company’s full-year margin has remained steady over the past four quarters, suggesting it strives to keep prices low for customers and has stable input costs (such as labor and freight expenses to transport goods).
8. Operating Margin
Macy’s operating margin has more or less stayed the same over the last 12 months , averaging 4.3% over the last two years. This profitability was lousy for a consumer retail business and caused by its suboptimal cost structure.
Analyzing the trend in its profitability, Macy’s operating margin might fluctuated slightly but has generally stayed the same over the last year, meaning it will take a fundamental shift in the business model to change.
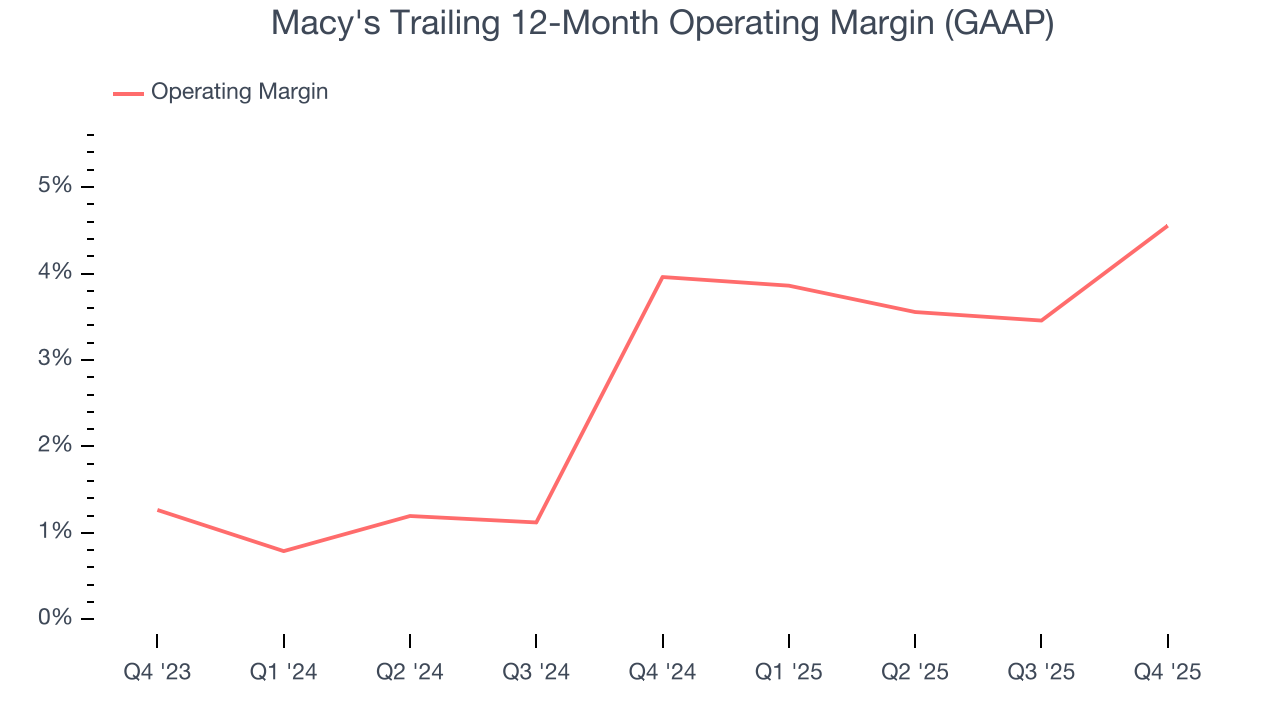
This quarter, Macy's generated an operating margin profit margin of 9.4%, up 3.2 percentage points year on year. The increase was encouraging, and because its operating margin rose more than its gross margin, we can infer it was more efficient with expenses such as marketing, and administrative overhead.
9. Earnings Per Share
We track the long-term change in earnings per share (EPS) for the same reason as long-term revenue growth. Compared to revenue, however, EPS highlights whether a company’s growth is profitable.
Sadly for Macy's, its EPS declined by 20.7% annually over the last three years, more than its revenue. We can see the difference stemmed from higher interest expenses or taxes as the company actually improved its operating margin and repurchased its shares during this time.
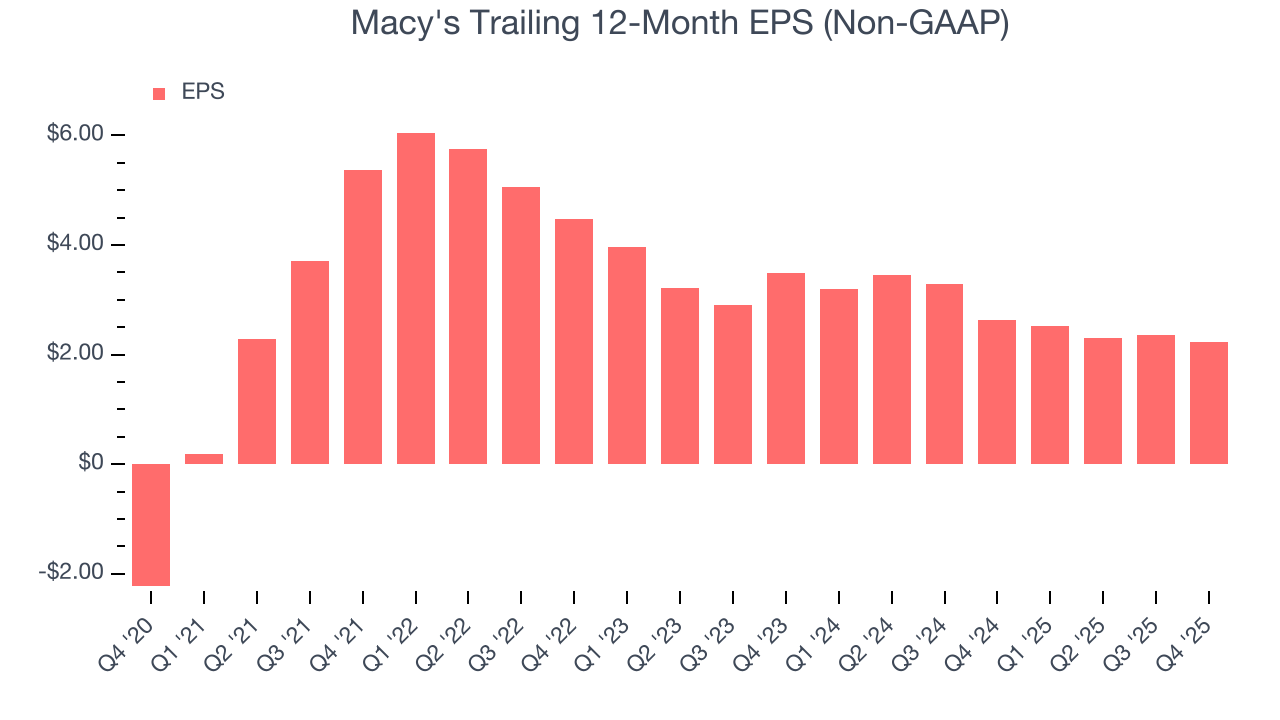
In Q4, Macy's reported adjusted EPS of $1.67, down from $1.80 in the same quarter last year. Despite falling year on year, this print beat analysts’ estimates by 6.8%. Over the next 12 months, Wall Street expects Macy’s full-year EPS of $2.23 to shrink by 4.3%.
10. Cash Is King
If you’ve followed StockStory for a while, you know we emphasize free cash flow. Why, you ask? We believe that in the end, cash is king, and you can’t use accounting profits to pay the bills.
Macy's has shown mediocre cash profitability relative to peers over the last two years, giving the company fewer opportunities to return capital to shareholders. Its free cash flow margin averaged 2.4%, below what we’d expect for a consumer retail business.
Taking a step back, an encouraging sign is that Macy’s margin expanded by 1.3 percentage points over the last year. We have no doubt shareholders would like to continue seeing its cash conversion rise as it gives the company more optionality.
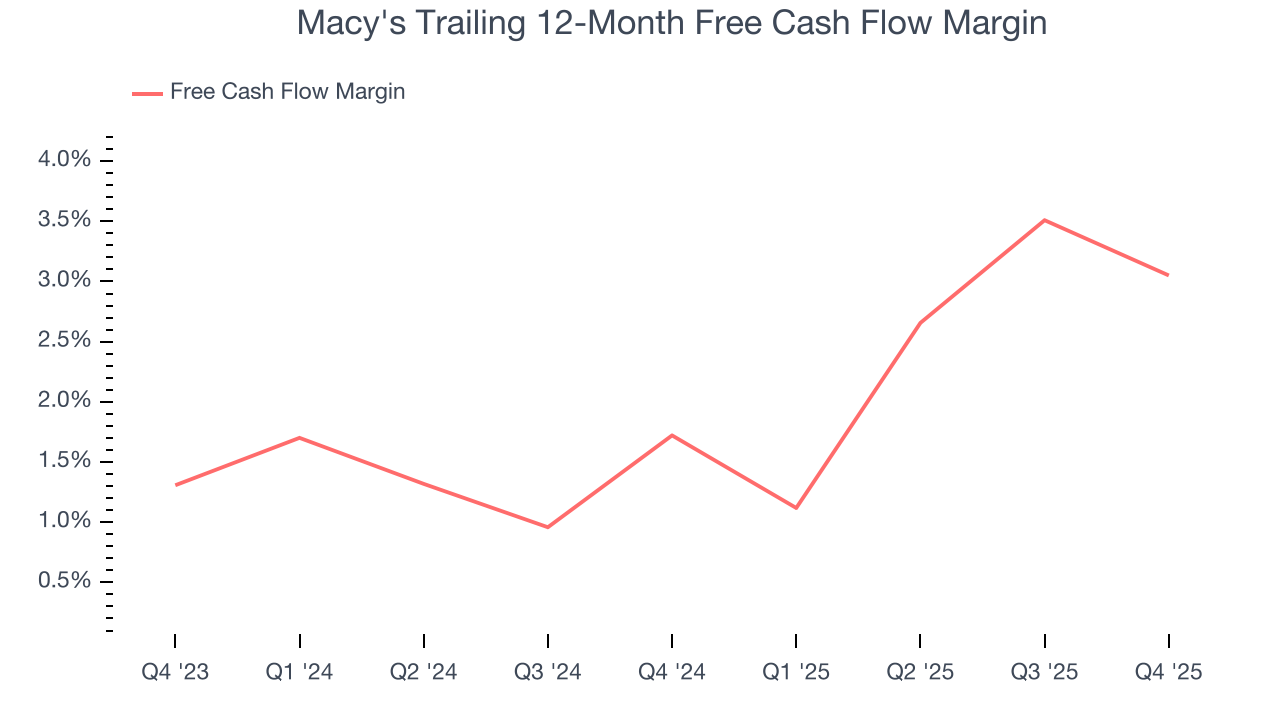
Macy’s free cash flow clocked in at $968 million in Q4, equivalent to a 12.2% margin. The company’s cash profitability regressed as it was 1.2 percentage points lower than in the same quarter last year, but it’s still above its two-year average. We wouldn’t read too much into this quarter’s decline because investment needs can be seasonal, leading to short-term swings. Long-term trends trump temporary fluctuations.
11. Return on Invested Capital (ROIC)
EPS and free cash flow tell us whether a company was profitable while growing its revenue. But was it capital-efficient? A company’s ROIC explains this by showing how much operating profit it makes compared to the money it has raised (debt and equity).
Macy's historically did a mediocre job investing in profitable growth initiatives. Its five-year average ROIC was 11.4%, somewhat low compared to the best consumer retail companies that consistently pump out 25%+.
12. Balance Sheet Assessment
Macy's reported $1.25 billion of cash and $5.20 billion of debt on its balance sheet in the most recent quarter. As investors in high-quality companies, we primarily focus on two things: 1) that a company’s debt level isn’t too high and 2) that its interest payments are not excessively burdening the business.
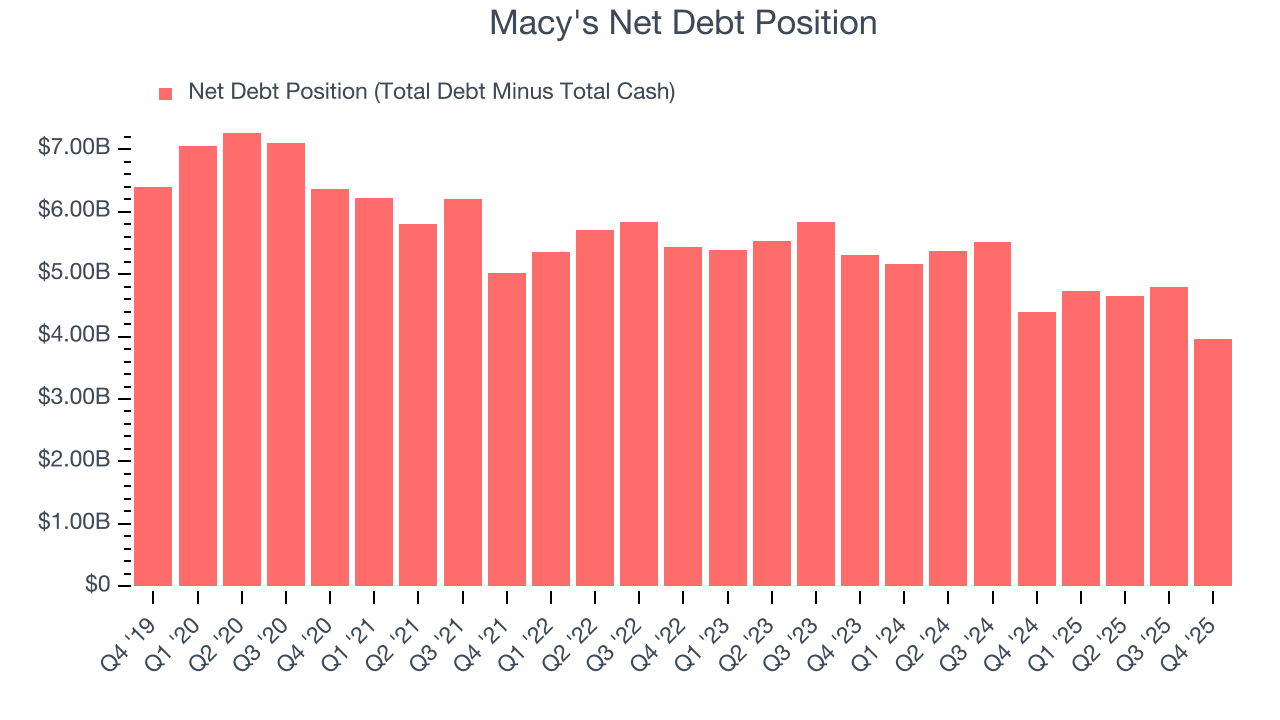
With $1.83 billion of EBITDA over the last 12 months, we view Macy’s 2.2× net-debt-to-EBITDA ratio as safe. We also see its $97 million of annual interest expenses as appropriate. The company’s profits give it plenty of breathing room, allowing it to continue investing in growth initiatives.
13. Key Takeaways from Macy’s Q4 Results
We were impressed by how significantly Macy's blew past analysts’ gross margin expectations this quarter. We were also glad its full-year revenue guidance exceeded Wall Street’s estimates. On the other hand, its full-year EPS guidance missed. Overall, this print was mixed. The stock traded up 7.1% to $18.12 immediately following the results.
14. Is Now The Time To Buy Macy's?
Updated: March 18, 2026 at 7:15 AM EDT
Are you wondering whether to buy Macy's or pass? We urge investors to not only consider the latest earnings results but also longer-term business quality and valuation as well.
Macy's doesn’t pass our quality test. For starters, its revenue has declined over the last three years, and analysts don’t see anything changing over the next 12 months. While its popular brand gives it meaningful influence over consumers’ purchasing decisions, the downside is its declining physical locations suggests its demand is falling. On top of that, its declining EPS over the last three years makes it a less attractive asset to the public markets.
Macy’s P/E ratio based on the next 12 months is 7.9x. While this valuation is optically cheap, the potential downside is huge given its shaky fundamentals. There are better stocks to buy right now.
Wall Street analysts have a consensus one-year price target of $21.40 on the company (compared to the current share price of $18.12).
Although the price target is bullish, readers should exercise caution because analysts tend to be overly optimistic. The firms they work for, often big banks, have relationships with companies that extend into fundraising, M&A advisory, and other rewarding business lines. As a result, they typically hesitate to say bad things for fear they will lose out. We at StockStory do not suffer from such conflicts of interest, so we’ll always tell it like it is.