Nike (NKE)
We wouldn’t recommend Nike. Its sales have underperformed and its low returns on capital show it has few growth opportunities.― StockStory Analyst Team
1. News


2. Summary
Why We Think Nike Will Underperform
Originally selling Japanese Onitsuka Tiger sneakers as Blue Ribbon Sports, Nike (NYSE:NKE) is a global titan in athletic footwear, apparel, equipment, and accessories.
- Scale is a double-edged sword because it limits the company’s growth potential compared to its smaller competitors, as reflected in its below-average annual revenue increases of 4% for the last five years
- Earnings per share fell by 3.2% annually over the last five years while its revenue grew, showing its incremental sales were much less profitable
- Subpar operating margin constrains its ability to invest in process improvements or effectively respond to new competitive threats


Nike is in the penalty box. We’re on the lookout for more interesting opportunities.
Why There Are Better Opportunities Than Nike


Nike is trading at $64.88 per share, or 34.5x forward P/E. Not only is Nike’s multiple richer than most consumer discretionary peers, but it’s also expensive for its revenue characteristics.
There are stocks out there featuring similar valuation multiples with better fundamentals. We prefer to invest in those.
3. Nike (NKE) Research Report: Q4 CY2025 Update
Athletic apparel brand Nike (NYSE:NKE) announced better-than-expected revenue in Q4 CY2025, but sales were flat year on year at $12.43 billion. Its GAAP profit of $0.53 per share was 41.9% above analysts’ consensus estimates.
Nike (NKE) Q4 CY2025 Highlights:
- Revenue: $12.43 billion vs analyst estimates of $12.22 billion (flat year on year, 1.7% beat)
- North America revenue rose 9% year-on-year (beat) while Greater China revenue dropped 17% (miss)
- EPS (GAAP): $0.53 vs analyst estimates of $0.37 (41.9% beat)
- Operating Margin: 8%, down from 11.2% in the same quarter last year
- Constant Currency Revenue was flat year on year (-9% in the same quarter last year)
- Market Capitalization: $97.1 billion
Company Overview
Originally selling Japanese Onitsuka Tiger sneakers as Blue Ribbon Sports, Nike (NYSE:NKE) is a global titan in athletic footwear, apparel, equipment, and accessories.
Nike's extensive product line covers a range of sports and fitness activities. The company is known for its athletic footwear with iconic series such as Air Jordan, Air Max, and Nike Free. These products are not just functional; they are also fashion statements, often setting trends in the broader footwear and apparel industry. In apparel, Nike offers everything from sports uniforms to casual wear.
To make its products, Nike primarily outsources manufacturing to various suppliers globally, leveraging cost efficiencies and scale production according to demand. This network of suppliers is managed under strict guidelines to maintain quality and ethical standards in production. Consumers can find the company’s products in its brick-and-mortar locations, department stores, and online.
While Nike's image has been crafted around elite athletes, its customers include everyone from a middle school boy idolizing NBA players to a middle-aged yoga enthusiast. Because of its broad customer base that spans all income levels, Nike sells its product in a wide variety of channels from mass merchandisers to higher-end retailers. Department stores, fashion-focused retailers, athletic footwear stores, and a variety of e-commerce sites also carry Nike products.
Over the last decade, Nike has increasingly sold directly to consumers through its own branded stores and website, where it achieves higher profit margins and can release exclusive products and designs that are not available at your local retailer.
4. Footwear
Before the advent of the internet, styles changed, but consumers mainly bought shoes by visiting local brick-and-mortar shoe, department, and specialty stores. Today, not only do styles change more frequently as fads travel through social media and the internet but consumers are also shifting the way they buy their goods, favoring omnichannel and e-commerce experiences. Some footwear companies have made concerted efforts to adapt while those who are slower to move may fall behind.
Nike's primary competitors include Adidas (ETR:ADS), Under Armour (NYSE:UAA), Puma (ETR:PUM), ASICS (TYO:7936), Columbia Sportswear (NASDAQ:COLM), and Reebok (owned by private company Authentic Brands Group).
5. Revenue Growth
Reviewing a company’s long-term sales performance reveals insights into its quality. Any business can put up a good quarter or two, but the best consistently grow over the long haul. Regrettably, Nike’s sales grew at a weak 4% compounded annual growth rate over the last five years. This fell short of our benchmark for the consumer discretionary sector and is a poor baseline for our analysis.
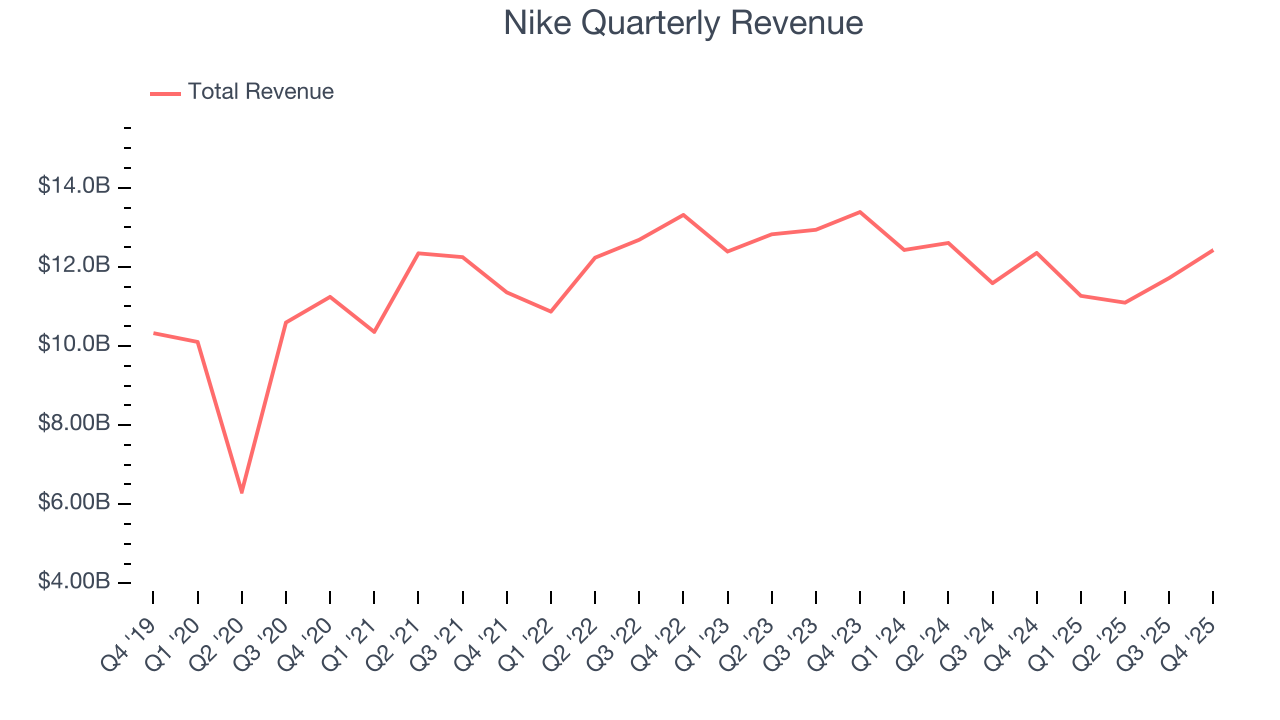
Long-term growth is the most important, but within consumer discretionary, product cycles are short and revenue can be hit-driven due to rapidly changing trends and consumer preferences. Nike’s performance shows it grew in the past but relinquished its gains over the last two years, as its revenue fell by 5% annually. 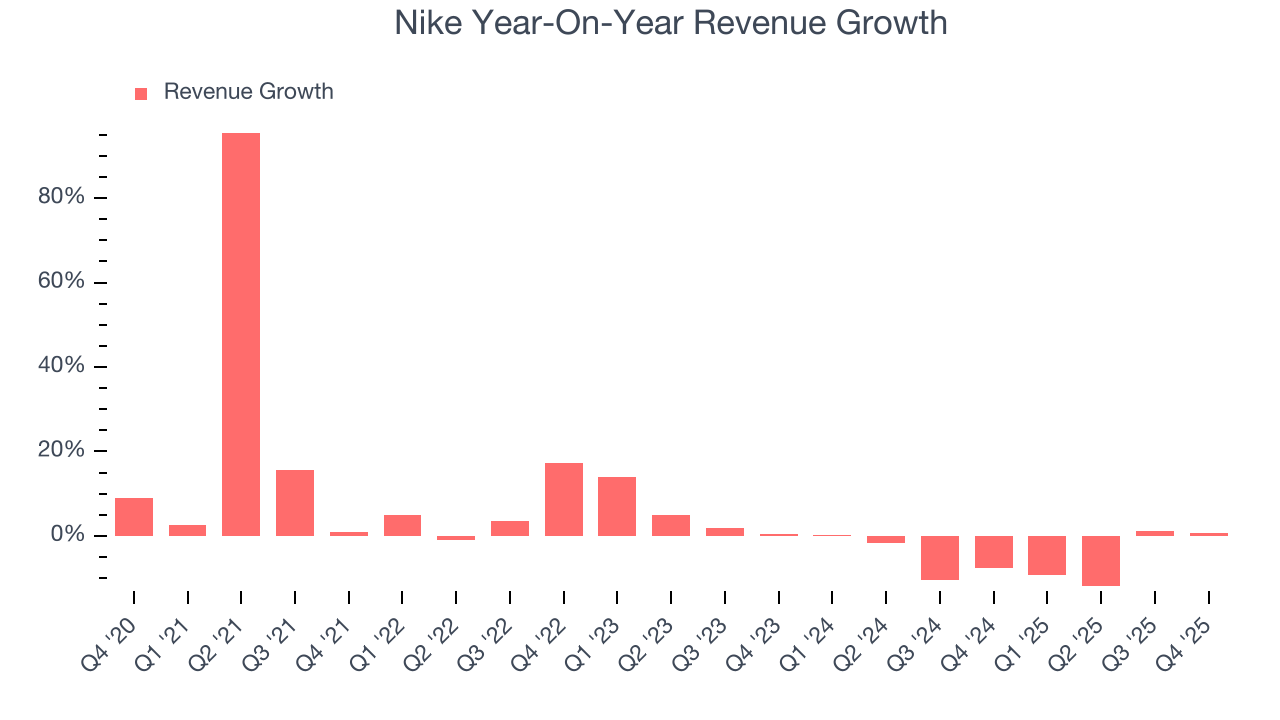
Nike also reports sales performance excluding currency movements, which are outside the company’s control and not indicative of demand. Over the last two years, its constant currency sales averaged 4.6% year-on-year declines. Because this number aligns with its normal revenue growth, we can see that Nike has properly hedged its foreign currency exposure. 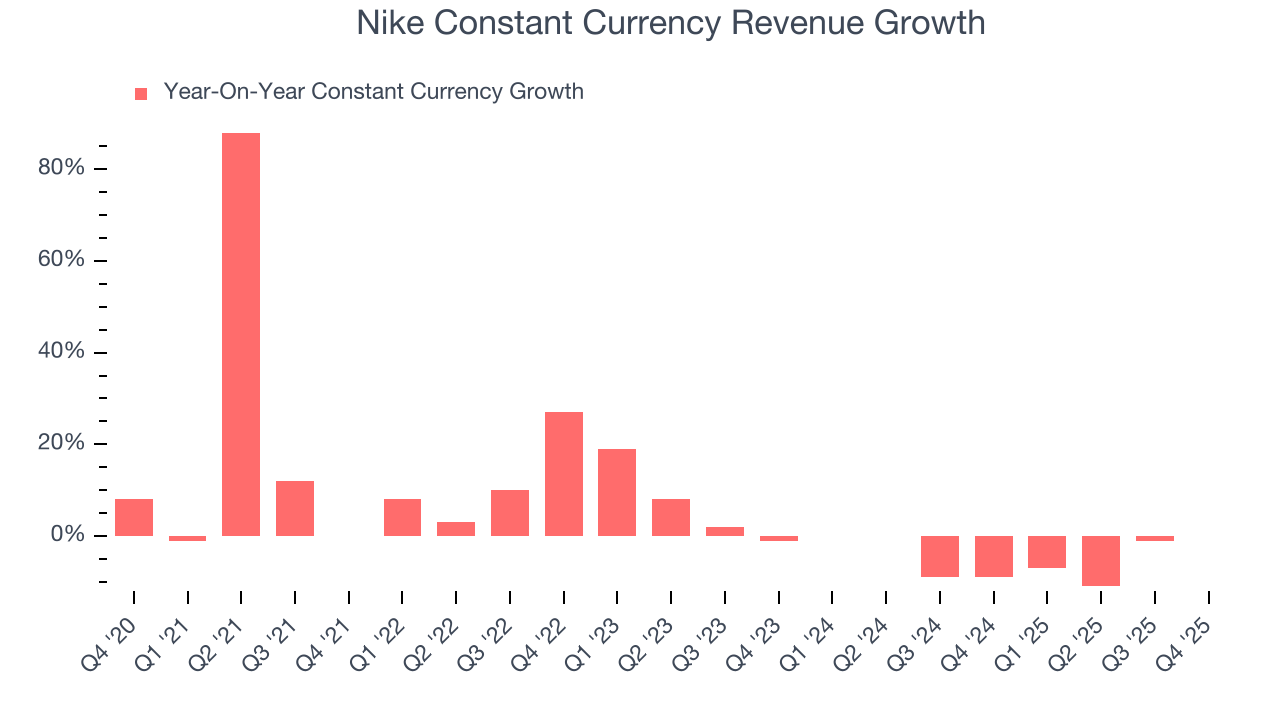
This quarter, Nike’s $12.43 billion of revenue was flat year on year but beat Wall Street’s estimates by 1.7%.
Looking ahead, sell-side analysts expect revenue to grow 3.3% over the next 12 months. While this projection implies its newer products and services will spur better top-line performance, it is still below average for the sector.
6. Operating Margin
Nike’s operating margin has shrunk over the last 12 months and averaged 8.9% over the last two years. The company’s profitability was mediocre for a consumer discretionary business and shows it couldn’t pass its higher operating expenses onto its customers.
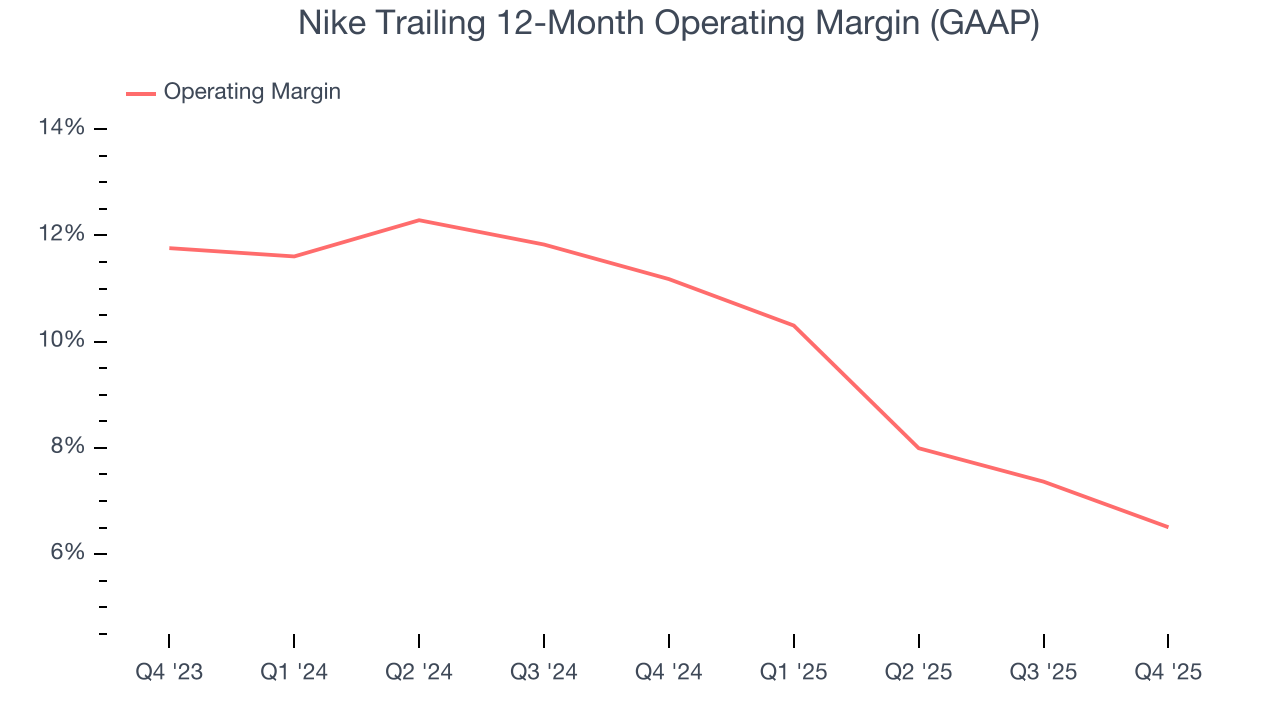
In Q4, Nike generated an operating margin profit margin of 8%, down 3.2 percentage points year on year. This contraction shows it was less efficient because its expenses increased relative to its revenue.
7. Earnings Per Share
Revenue trends explain a company’s historical growth, but the long-term change in earnings per share (EPS) points to the profitability of that growth – for example, a company could inflate its sales through excessive spending on advertising and promotions.
Nike’s flat EPS over the last five years was below its 4% annualized revenue growth. This tells us the company became less profitable on a per-share basis as it expanded due to non-fundamental factors such as interest expenses and taxes.
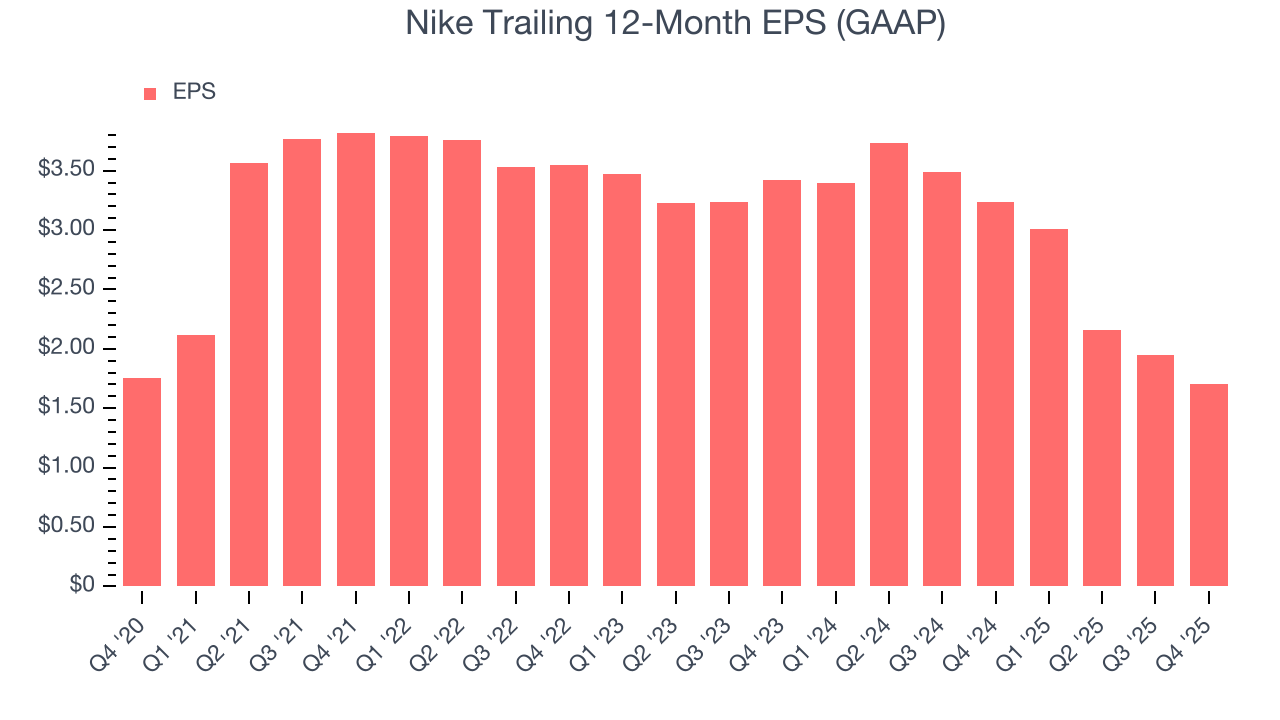
In Q4, Nike reported EPS of $0.53, down from $0.78 in the same quarter last year. Despite falling year on year, this print easily cleared analysts’ estimates. Over the next 12 months, Wall Street expects Nike’s full-year EPS of $1.70 to grow 27.6%.
8. Cash Is King
Free cash flow isn't a prominently featured metric in company financials and earnings releases, but we think it's telling because it accounts for all operating and capital expenses, making it tough to manipulate. Cash is king.
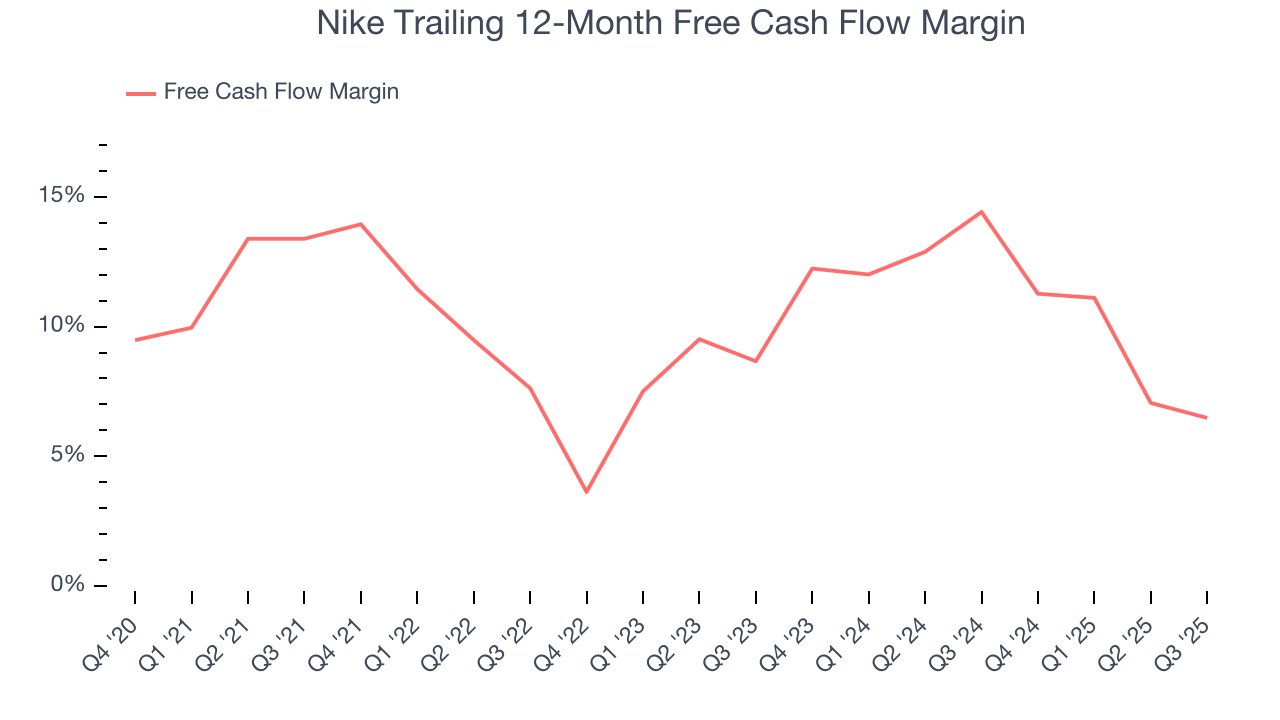
Nike has shown poor cash profitability over the last two years, giving the company limited opportunities to return capital to shareholders. Its free cash flow margin averaged 9.2%, lousy for a consumer discretionary business.
9. Return on Invested Capital (ROIC)
EPS and free cash flow tell us whether a company was profitable while growing its revenue. But was it capital-efficient? Enter ROIC, a metric showing how much operating profit a company generates relative to the money it has raised (debt and equity).
Nike historically did a mediocre job investing in profitable growth initiatives. Its five-year average ROIC was 37.9%, somewhat low compared to the best consumer discretionary companies that consistently pump out 25%+.
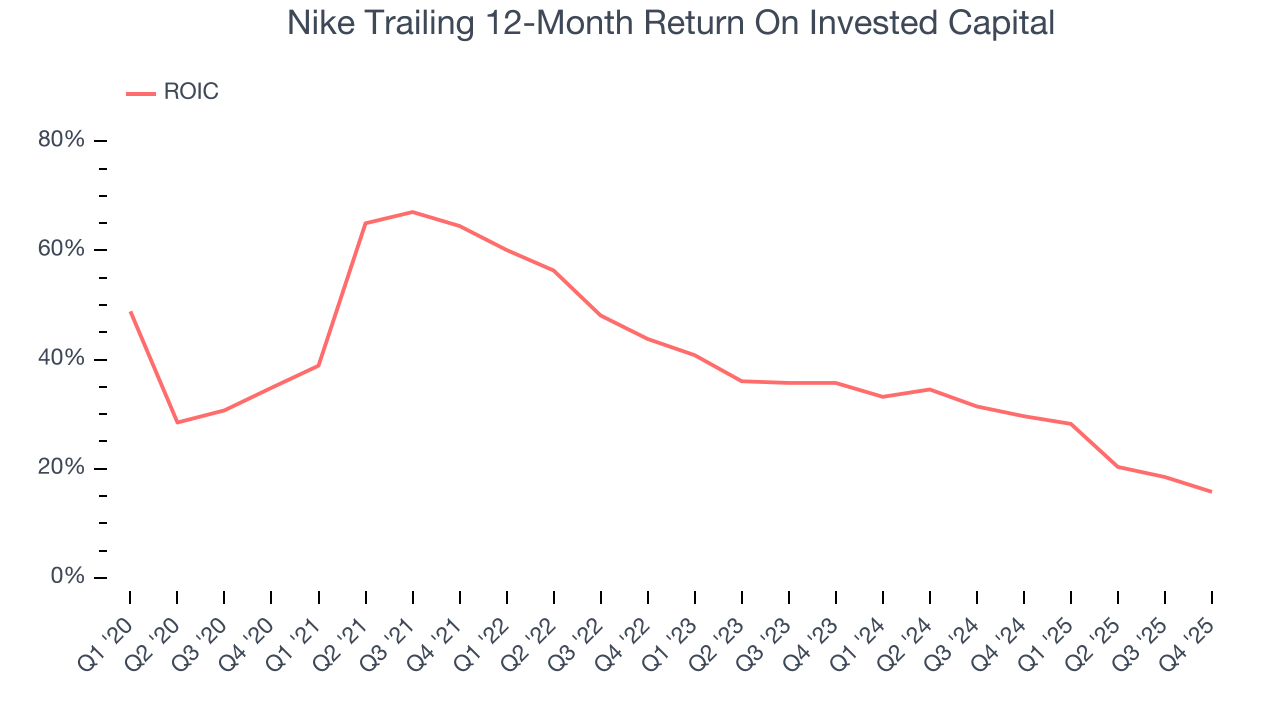
We like to invest in businesses with high returns, but the trend in a company’s ROIC is what often surprises the market and moves the stock price. Over the last few years, Nike’s ROIC has unfortunately decreased significantly. Paired with its already low returns, these declines suggest its profitable growth opportunities are few and far between.
10. Balance Sheet Assessment
Nike reported $8.35 billion of cash and $11.28 billion of debt on its balance sheet in the most recent quarter. As investors in high-quality companies, we primarily focus on two things: 1) that a company’s debt level isn’t too high and 2) that its interest payments are not excessively burdening the business.
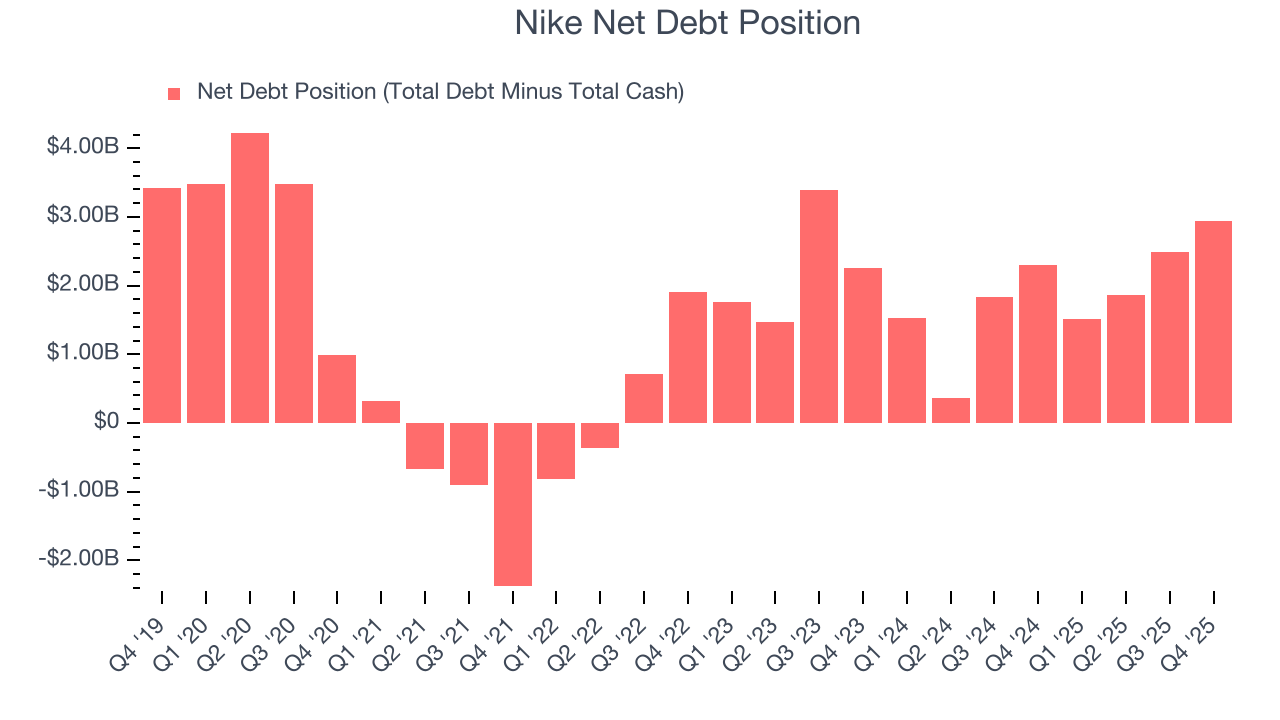
With $3.82 billion of EBITDA over the last 12 months, we view Nike’s 0.8× net-debt-to-EBITDA ratio as safe. We also see its $67 million of annual interest expenses as appropriate. The company’s profits give it plenty of breathing room, allowing it to continue investing in growth initiatives.
11. Key Takeaways from Nike’s Q4 Results
It was good to see Nike beat analysts’ constant currency revenue and EPS expectations this quarter. On the other hand, China revenue declined meaningfully. Zooming out, we think this was a mixed print. The market seemed to be hoping for more, and the stock traded down 2.3% to $64.35 immediately after reporting.
12. Is Now The Time To Buy Nike?
Updated: January 25, 2026 at 9:55 PM EST
Before investing in or passing on Nike, we urge you to understand the company’s business quality (or lack thereof), valuation, and the latest quarterly results - in that order.
Nike falls short of our quality standards. To kick things off, its revenue growth was weak over the last five years, and analysts expect its demand to deteriorate over the next 12 months. On top of that, Nike’s Forecasted free cash flow margin suggests the company will ramp up its investments next year, and its constant currency sales performance has disappointed.
Nike’s P/E ratio based on the next 12 months is 34.5x. This valuation tells us a lot of optimism is priced in - we think there are better opportunities elsewhere.
Wall Street analysts have a consensus one-year price target of $76.38 on the company (compared to the current share price of $64.88).
Although the price target is bullish, readers should exercise caution because analysts tend to be overly optimistic. The firms they work for, often big banks, have relationships with companies that extend into fundraising, M&A advisory, and other rewarding business lines. As a result, they typically hesitate to say bad things for fear they will lose out. We at StockStory do not suffer from such conflicts of interest, so we’ll always tell it like it is.