
Douglas Dynamics (PLOW)
Douglas Dynamics is a sound business. Its revenue and EPS are projected to skyrocket next year, an optimistic sign for its share price.― StockStory Analyst Team
1. News


2. Summary
Why Douglas Dynamics Is Interesting
Once manufacturing snowplows designed for the iconic jeep vehicle precursor, Douglas Dynamics (NYSE:PLOW) offers snow and ice equipment for the roads and sidewalks.
- Earnings per share grew by 13.6% annually over the last five years, comfortably beating the peer group average
- Projected revenue growth of 11.4% for the next 12 months indicates demand will rise above its two-year trend
- One pitfall is its gross margin of 25.4% reflects its high production costs


Douglas Dynamics almost passes our quality test. If you’ve been itching to buy the stock, the valuation looks fair.
Why Is Now The Time To Buy Douglas Dynamics?


At $41.25 per share, Douglas Dynamics trades at 16.1x forward P/E. This multiple is lower than most industrials companies, and we think the valuation is reasonable for the quality you get.
It could be a good time to invest if you see something the market doesn’t.
3. Douglas Dynamics (PLOW) Research Report: Q4 CY2025 Update
Snow and ice equipment company Douglas Dynamics (NYSE:PLOW) reported Q4 CY2025 results exceeding the market’s revenue expectations, with sales up 28.6% year on year to $184.5 million. The company’s full-year revenue guidance of $735 million at the midpoint came in 3.8% above analysts’ estimates. Its non-GAAP profit of $0.62 per share was 19.2% above analysts’ consensus estimates.
Douglas Dynamics (PLOW) Q4 CY2025 Highlights:
- Revenue: $184.5 million vs analyst estimates of $170 million (28.6% year-on-year growth, 8.6% beat)
- Adjusted EPS: $0.62 vs analyst estimates of $0.52 (19.2% beat)
- Adjusted EBITDA: $25.77 million vs analyst estimates of $21.63 million (14% margin, 19.1% beat)
- Adjusted EPS guidance for the upcoming financial year 2026 is $2.55 at the midpoint, beating analyst estimates by 5.8%
- EBITDA guidance for the upcoming financial year 2026 is $110 million at the midpoint, above analyst estimates of $103.9 million
- Operating Margin: 10.5%, up from 9% in the same quarter last year
- Free Cash Flow Margin: 50.3%, up from 49.2% in the same quarter last year
- Market Capitalization: $982.5 million
Company Overview
Once manufacturing snowplows designed for the iconic jeep vehicle precursor, Douglas Dynamics (NYSE:PLOW) offers snow and ice equipment for the roads and sidewalks.
Douglas Dynamics was founded in 1977 and began as a manufacturer of vehicle attachments and equipment. The company has significantly grown through acquisitions that have enabled it to enter new markets and expand from its original singular offering. For example, the $206 million acquisition of Dejana Truck & Utility Equipment in 2016 enabled it to offer custom upfitting services which reduced its dependency on seasonal weather patterns by diversifying its product offerings and expanding into year-round markets.
Douglas Dynamics specializes in producing equipment designed to manage snow on roads and sidewalks. Specifically, the company offers snowplows used to clear snow from roads and driveways as well as salt and sand spreaders which help to manage ice on roads and walkways. It does not provide the service of clearing snow, rather, it only provides the equipment needed.
Beyond its core offerings, the company also offers truck and utility vehicle attachments (dump bodies and service bodies to carry heavy things), material spreaders for landscaping and agricultural applications, and custom upfitting services for commercial vehicles. For example, some of its custom upfitting services include installing storage units such as toolboxes and shelving or adding equipment like cranes and lift gates to utility trucks.
It sells its products through direct sales and long-term contracts. These contracts typically span three to five years and often include service agreements for maintenance and support, ensuring the equipment stays in great condition.
4. Heavy Transportation Equipment
Heavy transportation equipment companies are investing in automated vehicles that increase efficiencies and connected machinery that collects actionable data. Some are also developing electric vehicles and mobility solutions to address customers’ concerns about carbon emissions, creating new sales opportunities. Additionally, they are increasingly offering automated equipment that increases efficiencies and connected machinery that collects actionable data. On the other hand, heavy transportation equipment companies are at the whim of economic cycles. Interest rates, for example, can greatly impact the construction and transport volumes that drive demand for these companies’ offerings.
Competitors offering similar products include Caterpillar (NYSE:CAT), Toro (NYSE:TTC), and Alamo (NYSE:ALG).
5. Revenue Growth
Reviewing a company’s long-term sales performance reveals insights into its quality. Any business can put up a good quarter or two, but many enduring ones grow for years. Unfortunately, Douglas Dynamics’s 6.4% annualized revenue growth over the last five years was mediocre. This was below our standard for the industrials sector and is a tough starting point for our analysis.
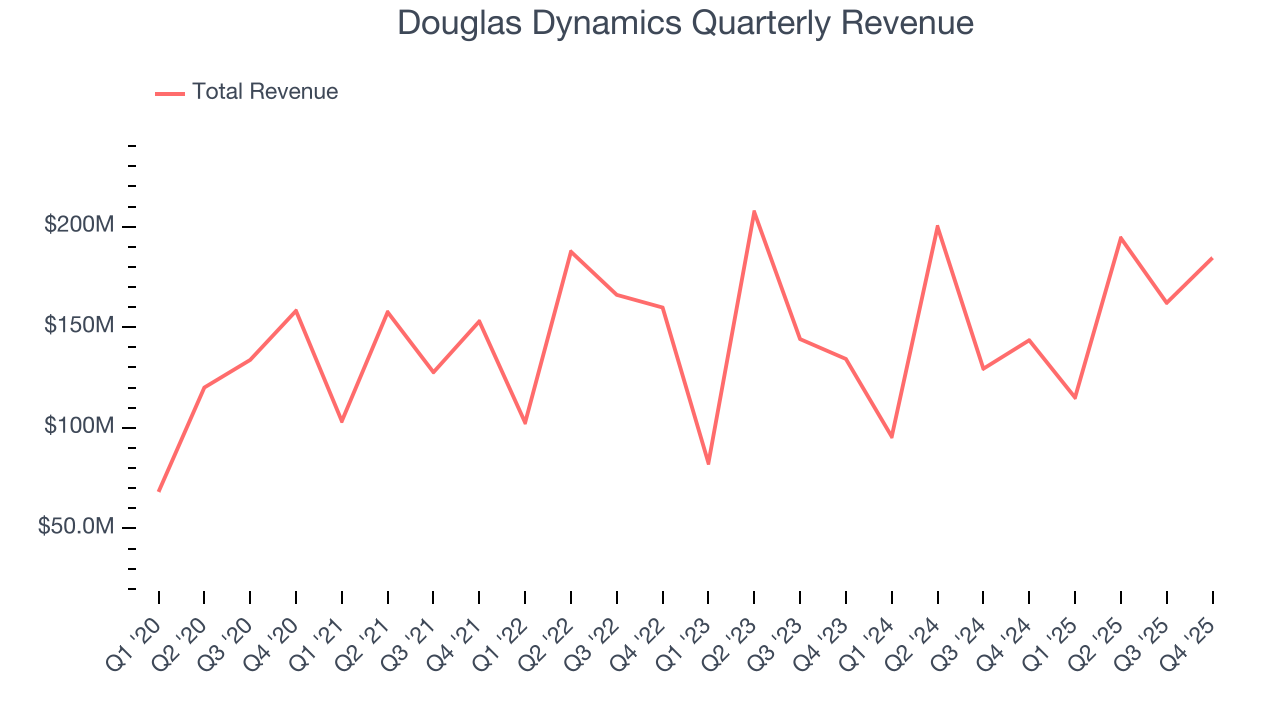
We at StockStory place the most emphasis on long-term growth, but within industrials, a half-decade historical view may miss cycles, industry trends, or a company capitalizing on catalysts such as a new contract win or a successful product line. Douglas Dynamics’s annualized revenue growth of 7.5% over the last two years is above its five-year trend, which is encouraging. We also note many other Heavy Transportation Equipment businesses have faced declining sales because of cyclical headwinds. While Douglas Dynamics grew slower than we’d like, it did do better than its peers. 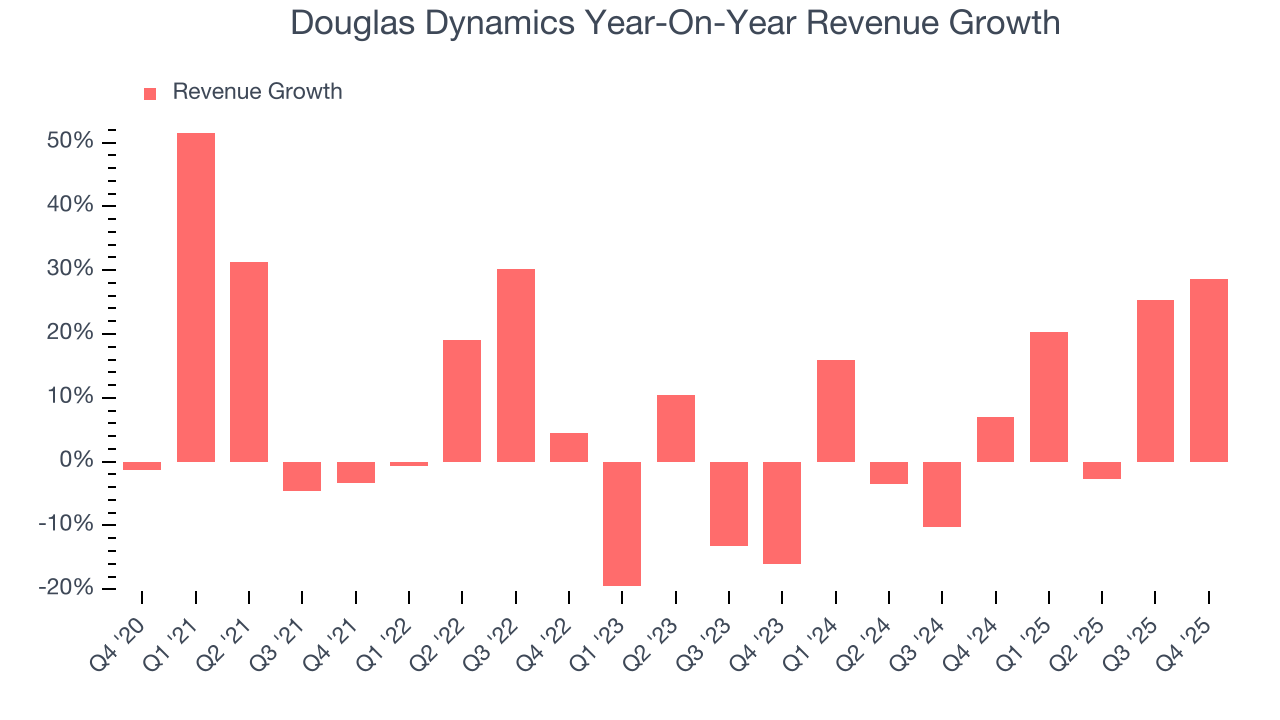
This quarter, Douglas Dynamics reported robust year-on-year revenue growth of 28.6%, and its $184.5 million of revenue topped Wall Street estimates by 8.6%.
Looking ahead, sell-side analysts expect revenue to grow 7.7% over the next 12 months, similar to its two-year rate. This projection is above average for the sector and indicates its newer products and services will help maintain its recent top-line performance.
6. Gross Margin & Pricing Power
Cost of sales for an industrials business is usually comprised of the direct labor, raw materials, and supplies needed to offer a product or service. These costs can be impacted by inflation and supply chain dynamics.
Douglas Dynamics has bad unit economics for an industrials company, giving it less room to reinvest and develop new offerings. As you can see below, it averaged a 25.4% gross margin over the last five years. That means Douglas Dynamics paid its suppliers a lot of money ($74.61 for every $100 in revenue) to run its business. 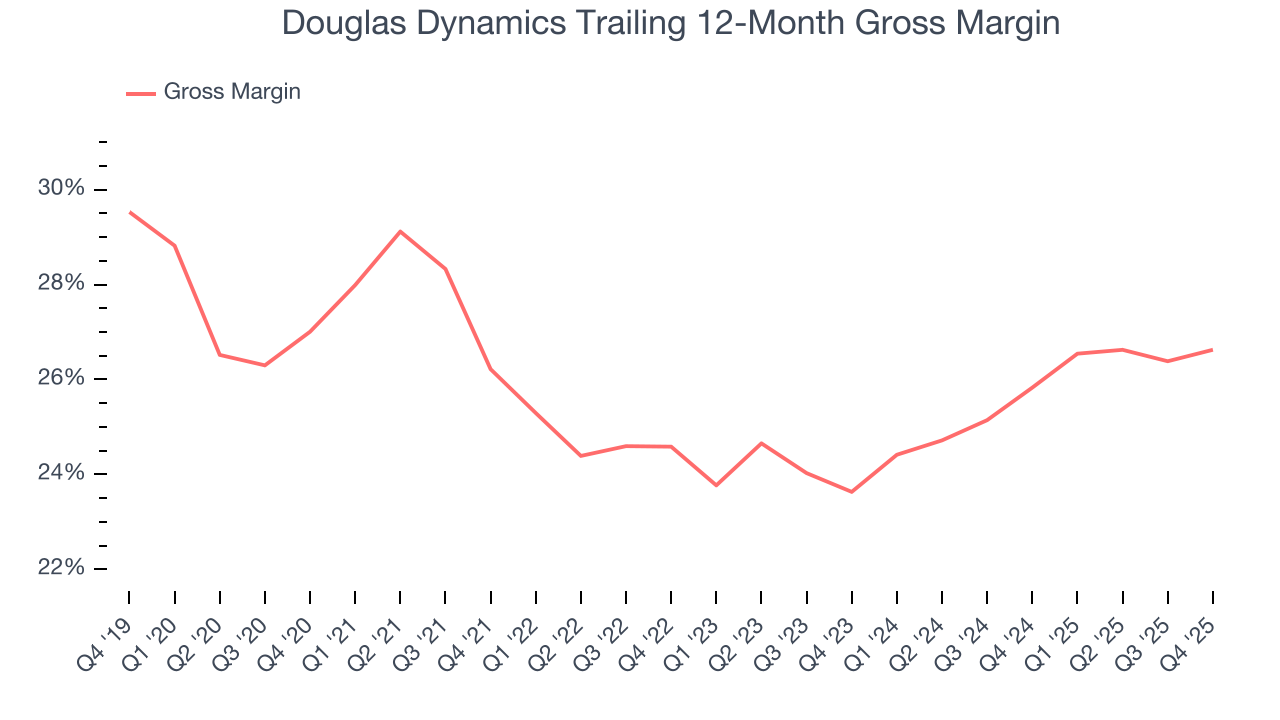
Douglas Dynamics produced a 26.1% gross profit margin in Q4, up 1.2 percentage points year on year. Zooming out, the company’s full-year margin has remained steady over the past 12 months, suggesting its input costs (such as raw materials and manufacturing expenses) have been stable and it isn’t under pressure to lower prices.
7. Operating Margin
Operating margin is a key measure of profitability. Think of it as net income - the bottom line - excluding the impact of taxes and interest on debt, which are less connected to business fundamentals.
Douglas Dynamics has done a decent job managing its cost base over the last five years. The company has produced an average operating margin of 9.4%, higher than the broader industrials sector.
Analyzing the trend in its profitability, Douglas Dynamics’s operating margin rose by 1.5 percentage points over the last five years, as its sales growth gave it operating leverage.
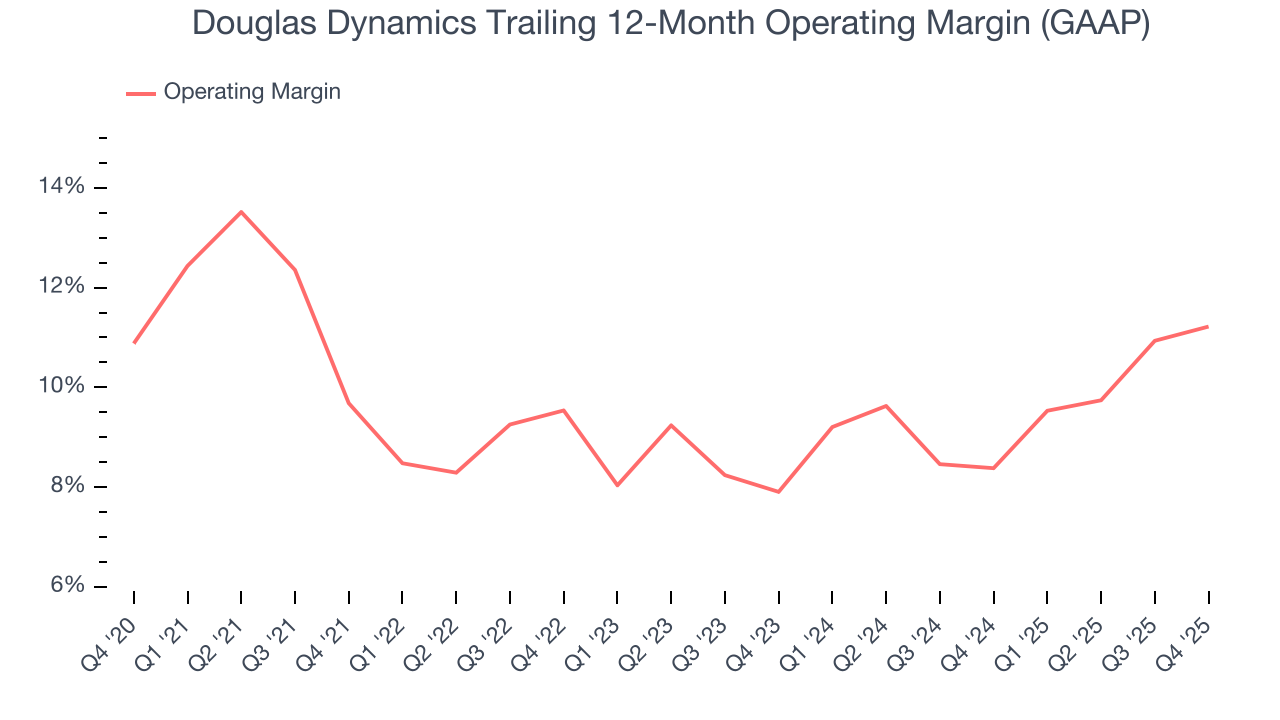
This quarter, Douglas Dynamics generated an operating margin profit margin of 10.5%, up 1.4 percentage points year on year. The increase was encouraging, and because its operating margin rose more than its gross margin, we can infer it was more efficient with expenses such as marketing, R&D, and administrative overhead.
8. Earnings Per Share
We track the long-term change in earnings per share (EPS) for the same reason as long-term revenue growth. Compared to revenue, however, EPS highlights whether a company’s growth is profitable.
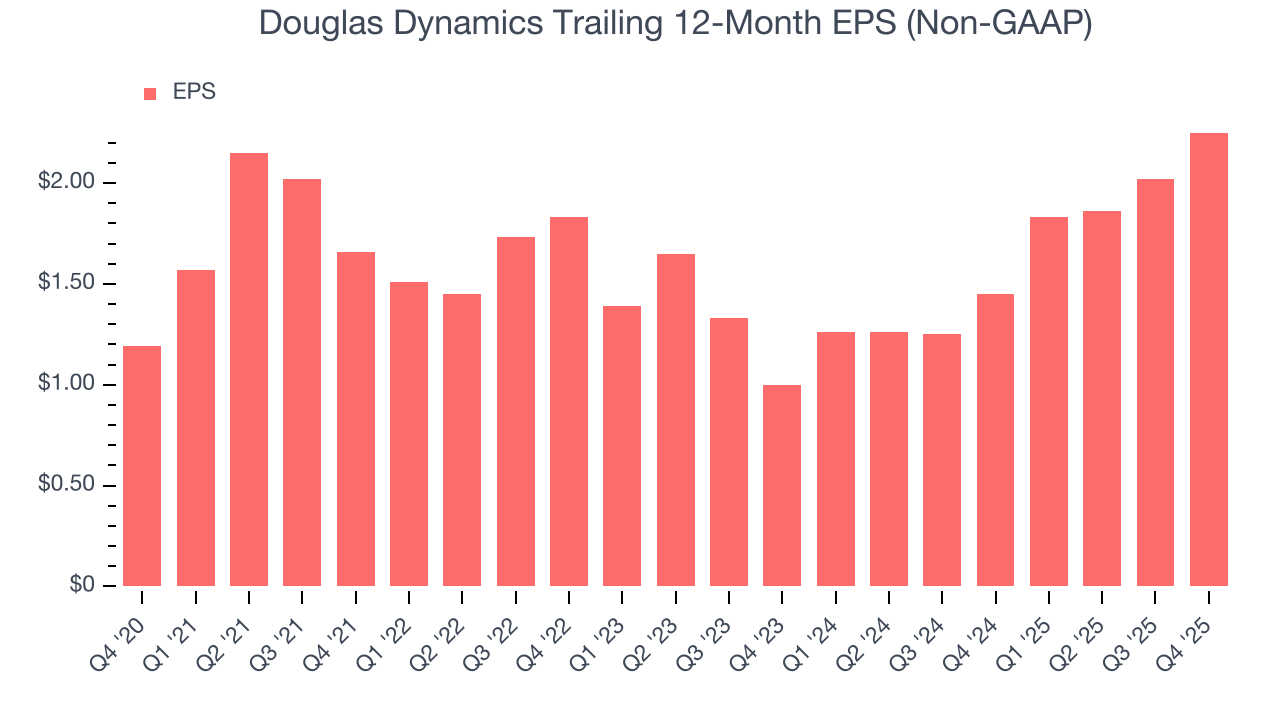
Douglas Dynamics’s EPS grew at a remarkable 13.6% compounded annual growth rate over the last five years, higher than its 6.4% annualized revenue growth. This tells us the company became more profitable on a per-share basis as it expanded.
We can take a deeper look into Douglas Dynamics’s earnings quality to better understand the drivers of its performance. As we mentioned earlier, Douglas Dynamics’s operating margin expanded by 1.5 percentage points over the last five years. This was the most relevant factor (aside from the revenue impact) behind its higher earnings; interest expenses and taxes can also affect EPS but don’t tell us as much about a company’s fundamentals.
Like with revenue, we analyze EPS over a shorter period to see if we are missing a change in the business.
For Douglas Dynamics, its two-year annual EPS growth of 50% was higher than its five-year trend. We love it when earnings growth accelerates, especially when it accelerates off an already high base.
In Q4, Douglas Dynamics reported adjusted EPS of $0.62, up from $0.39 in the same quarter last year. This print easily cleared analysts’ estimates, and shareholders should be content with the results. Over the next 12 months, Wall Street expects Douglas Dynamics’s full-year EPS of $2.25 to grow 6.8%.
9. Cash Is King
If you’ve followed StockStory for a while, you know we emphasize free cash flow. Why, you ask? We believe that in the end, cash is king, and you can’t use accounting profits to pay the bills.
Douglas Dynamics has shown mediocre cash profitability over the last five years, giving the company limited opportunities to return capital to shareholders. Its free cash flow margin averaged 6%, subpar for an industrials business.
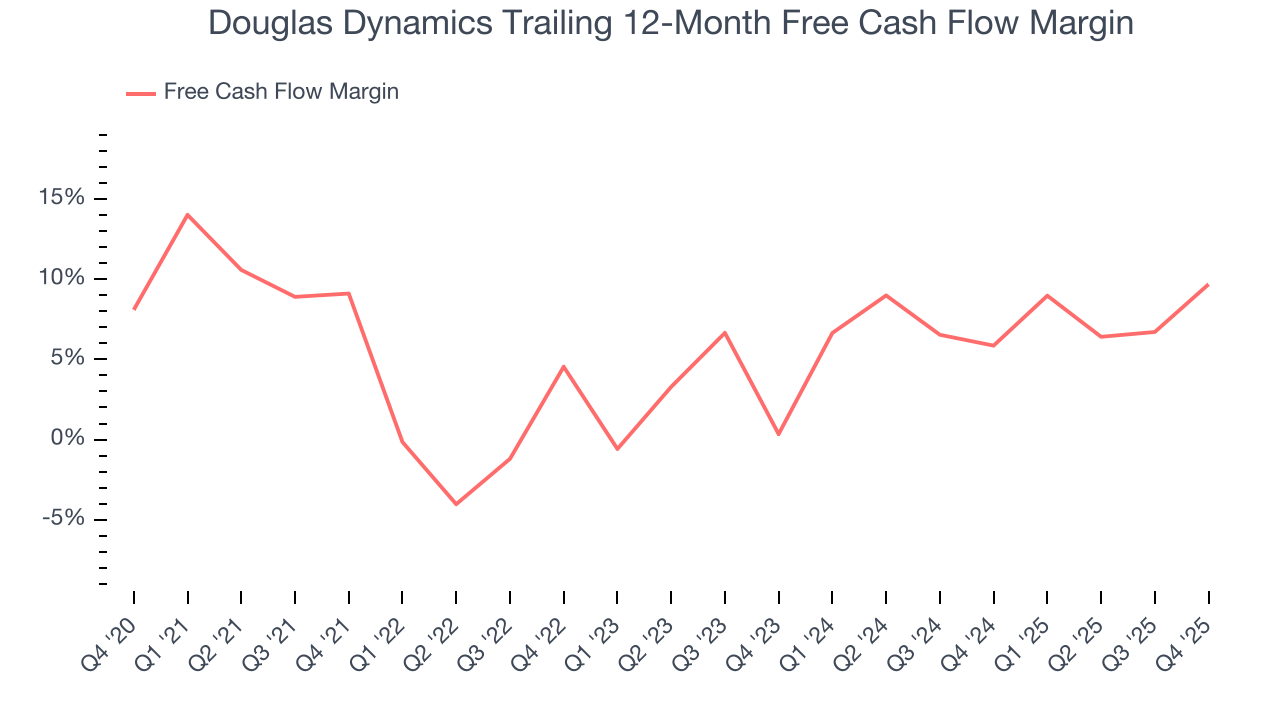
Douglas Dynamics’s free cash flow clocked in at $92.85 million in Q4, equivalent to a 50.3% margin. This result was good as its margin was 1.1 percentage points higher than in the same quarter last year, but we wouldn’t put too much weight on the short term because investment needs can be seasonal, causing temporary swings. Long-term trends carry greater meaning.
10. Return on Invested Capital (ROIC)
EPS and free cash flow tell us whether a company was profitable while growing its revenue. But was it capital-efficient? A company’s ROIC explains this by showing how much operating profit it makes compared to the money it has raised (debt and equity).
Douglas Dynamics historically did a mediocre job investing in profitable growth initiatives. Its five-year average ROIC was 9.7%, somewhat low compared to the best industrials companies that consistently pump out 20%+.
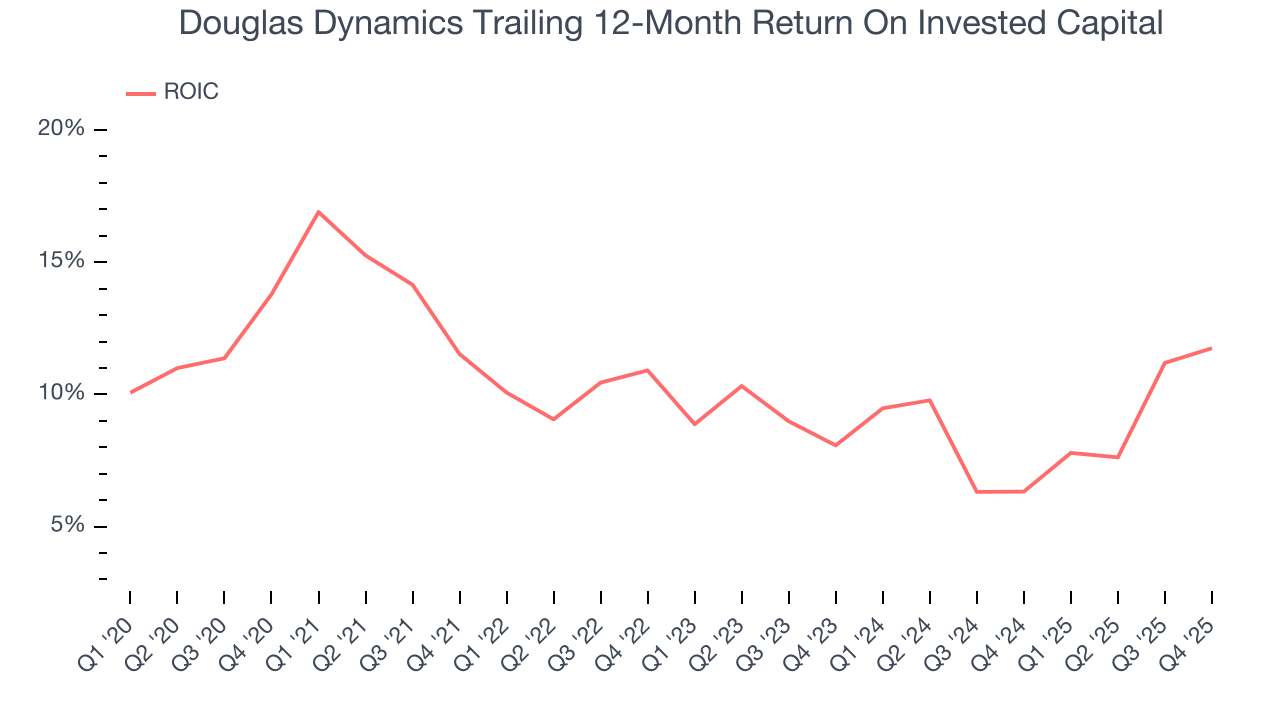
We like to invest in businesses with high returns, but the trend in a company’s ROIC is what often surprises the market and moves the stock price. Over the last few years, Douglas Dynamics’s ROIC averaged 2.2 percentage point decreases each year. Paired with its already low returns, these declines suggest its profitable growth opportunities are few and far between.
11. Balance Sheet Assessment
Douglas Dynamics reported $8.30 million of cash and $214.9 million of debt on its balance sheet in the most recent quarter. As investors in high-quality companies, we primarily focus on two things: 1) that a company’s debt level isn’t too high and 2) that its interest payments are not excessively burdening the business.
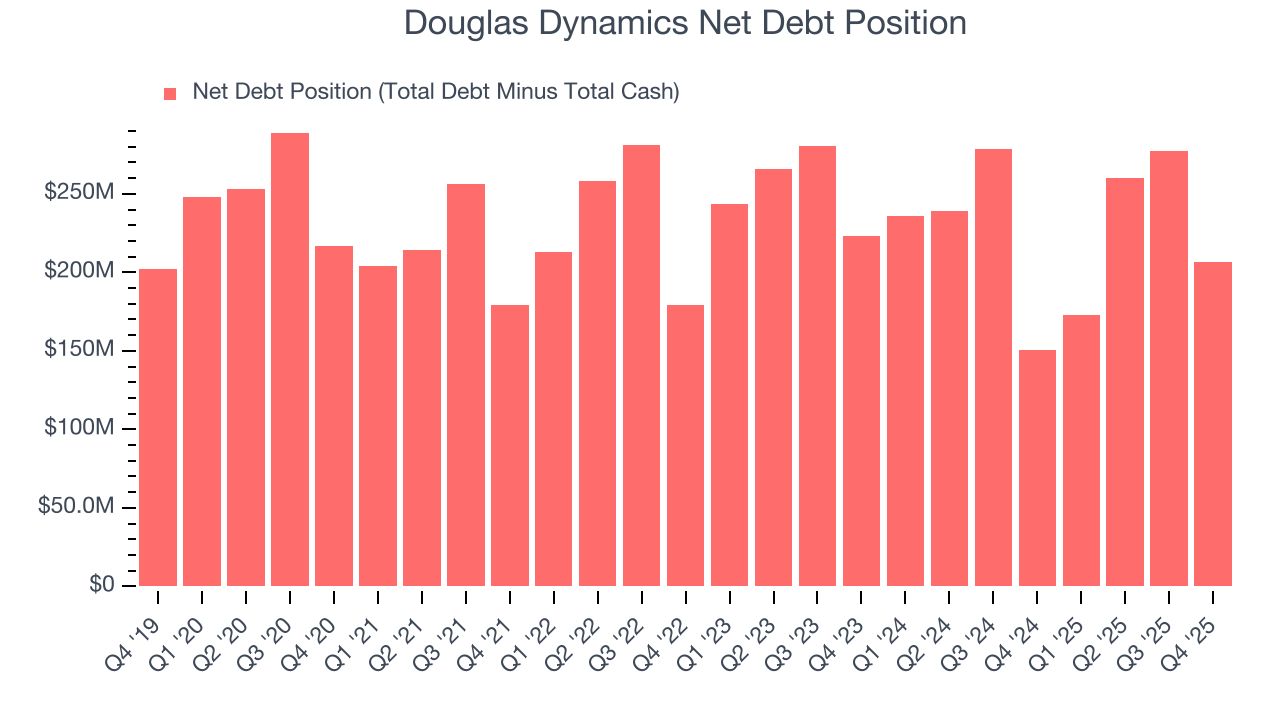
With $96.08 million of EBITDA over the last 12 months, we view Douglas Dynamics’s 2.1× net-debt-to-EBITDA ratio as safe. We also see its $12.11 million of annual interest expenses as appropriate. The company’s profits give it plenty of breathing room, allowing it to continue investing in growth initiatives.
12. Key Takeaways from Douglas Dynamics’s Q4 Results
We were impressed by how significantly Douglas Dynamics blew past analysts’ EBITDA expectations this quarter. We were also excited its revenue outperformed Wall Street’s estimates by a wide margin. Zooming out, we think this was a solid print. The stock traded up 3% to $43.93 immediately after reporting.
13. Is Now The Time To Buy Douglas Dynamics?
Updated: March 18, 2026 at 12:00 AM EDT
When considering an investment in Douglas Dynamics, investors should account for its valuation and business qualities as well as what’s happened in the latest quarter.
There are a lot of things to like about Douglas Dynamics. Although its revenue growth was mediocre over the last five years, its growth over the next 12 months is expected to be higher. And while Douglas Dynamics’s gross margins are lower than its industrials peers, its projected EPS for the next year implies the company’s fundamentals will improve. On top of that, its remarkable EPS growth over the last five years shows its profits are trickling down to shareholders.
Douglas Dynamics’s P/E ratio based on the next 12 months is 16.1x. When scanning the industrials space, Douglas Dynamics trades at a fair valuation. For those confident in the business and its management team, this is a good time to invest.
Wall Street analysts have a consensus one-year price target of $50.50 on the company (compared to the current share price of $41.25), implying they see 22.4% upside in buying Douglas Dynamics in the short term.