Philip Morris (PM)
We love companies like Philip Morris. Its high free cash flow margin and returns on capital show it can produce cash and invest it wisely.― StockStory Analyst Team
1. News


2. Summary
Why We Like Philip Morris
Founded in 1847, Philip Morris International (NYSE:PM) manufactures and sells a wide range of tobacco and nicotine-containing products, including cigarettes, heated tobacco products, and oral nicotine pouches.
- Products command premium prices and result in a best-in-class gross margin of 66%
- Healthy operating margin shows it’s a well-run company with efficient processes, and its profits increased over the last year as it scaled
- Robust free cash flow profile gives it the flexibility to invest in growth initiatives or return capital to shareholders


Philip Morris is a market leader. The valuation seems reasonable based on its quality, so this might be an opportune time to invest in some shares.
Why Is Now The Time To Buy Philip Morris?


At $164.68 per share, Philip Morris trades at 19.3x forward P/E. Most companies in the consumer staples sector may feature a cheaper multiple, but we think Philip Morris is priced fairly given its fundamentals.
Entry price may seem important in the moment, but our work shows that time and again, long-term market outperformance is determined by business quality rather than getting an absolute bargain on a stock.
3. Philip Morris (PM) Research Report: Q4 CY2025 Update
Tobacco company Philip Morris International (NYSE:PM) met Wall Streets revenue expectations in Q4 CY2025, with sales up 6.8% year on year to $10.36 billion. Its non-GAAP profit of $1.70 per share was in line with analysts’ consensus estimates.
Philip Morris (PM) Q4 CY2025 Highlights:
- Revenue: $10.36 billion vs analyst estimates of $10.31 billion (6.8% year-on-year growth, in line)
- Adjusted EPS: $1.70 vs analyst estimates of $1.70 (in line)
- Operating Margin: 32.6%, down from 33.6% in the same quarter last year
- Market Capitalization: $283.3 billion
Company Overview
Founded in 1847, Philip Morris International (NYSE:PM) manufactures and sells a wide range of tobacco and nicotine-containing products, including cigarettes, heated tobacco products, and oral nicotine pouches.
The company's flagship product portfolio includes iconic cigarette brands such as Marlboro, as well as its reduced-risk products like IQOS, a heated tobacco system.
4. Beverages, Alcohol, and Tobacco
These companies' performance is influenced by brand strength, marketing strategies, and shifts in consumer preferences. Changing consumption patterns are particularly relevant and can be seen in the rise of cannabis, craft beer, and vaping or the steady decline of soda and cigarettes. Companies that spend on innovation to meet consumers where they are with regards to trends can reap huge demand benefits while those who ignore trends can see stagnant volumes. Finally, with the advent of the social media, the cost of starting a brand from scratch is much lower, meaning that new entrants can chip away at the market shares of established players.
Competitors in the tobacco and nicotine product sector include Altria Group (NYSE:MO), British American Tobacco (LSE:BATS, NYSE:BTI), and Imperial Brands (LSE:IMB).
5. Revenue Growth
Examining a company’s long-term performance can provide clues about its quality. Any business can have short-term success, but a top-tier one grows for years.
With $40.65 billion in revenue over the past 12 months, Philip Morris is one of the most widely recognized consumer staples companies. Its influence over consumers gives it negotiating leverage with distributors, enabling it to pick and choose where it sells its products (a luxury many don’t have).
As you can see below, Philip Morris grew its sales at a decent 8.6% compounded annual growth rate over the last three years as consumers bought more of its products.
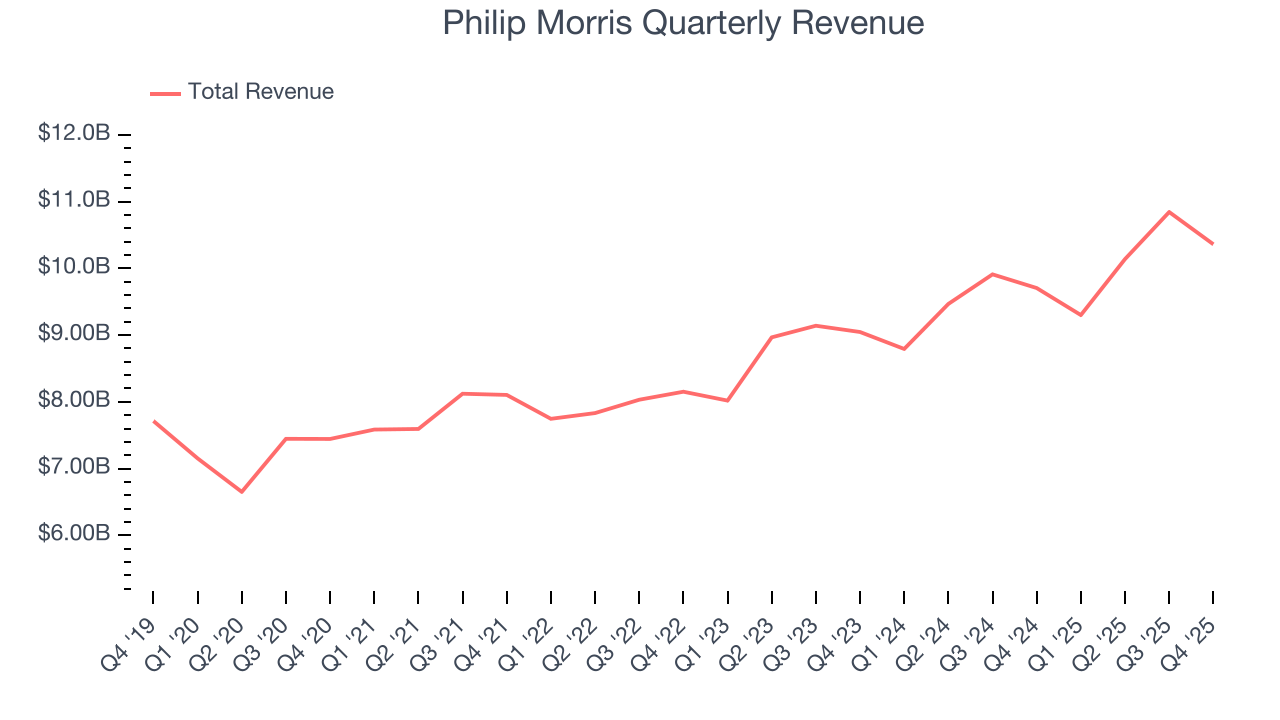
This quarter, Philip Morris grew its revenue by 6.8% year on year, and its $10.36 billion of revenue was in line with Wall Street’s estimates.
Looking ahead, sell-side analysts expect revenue to grow 7.7% over the next 12 months, similar to its three-year rate. This projection is above average for the sector and implies its newer products will help sustain its historical top-line performance.
6. Gross Margin & Pricing Power
All else equal, we prefer higher gross margins because they make it easier to generate more operating profits and indicate that a company commands pricing power by offering more differentiated products.
Philip Morris has best-in-class unit economics for a consumer staples company, enabling it to invest in areas such as marketing and talent. As you can see below, it averaged an elite 66% gross margin over the last two years. That means for every $100 in revenue, only $34.00 went towards paying for raw materials, production of goods, transportation, and distribution. 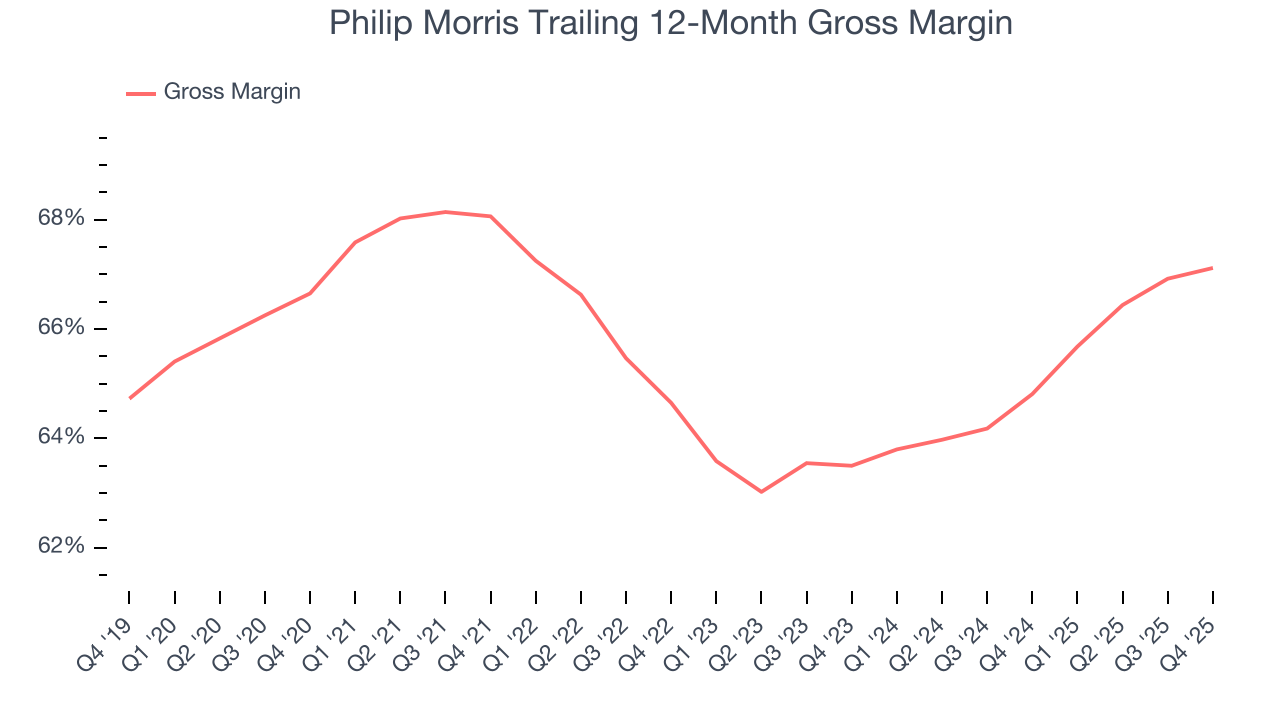
Philip Morris produced a 65.6% gross profit margin in Q4, in line with the same quarter last year. Zooming out, Philip Morris’s full-year margin has been trending up over the past 12 months, increasing by 2.3 percentage points. If this move continues, it could suggest better unit economics due to more leverage from its growing sales on the fixed portion of its cost of goods sold (such as manufacturing expenses).
7. Operating Margin
Philip Morris has been a well-oiled machine over the last two years. It demonstrated elite profitability for a consumer staples business, boasting an average operating margin of 36%. This result isn’t surprising as its high gross margin gives it a favorable starting point.
Looking at the trend in its profitability, Philip Morris’s operating margin rose by 1.3 percentage points over the last year, as its sales growth gave it operating leverage.
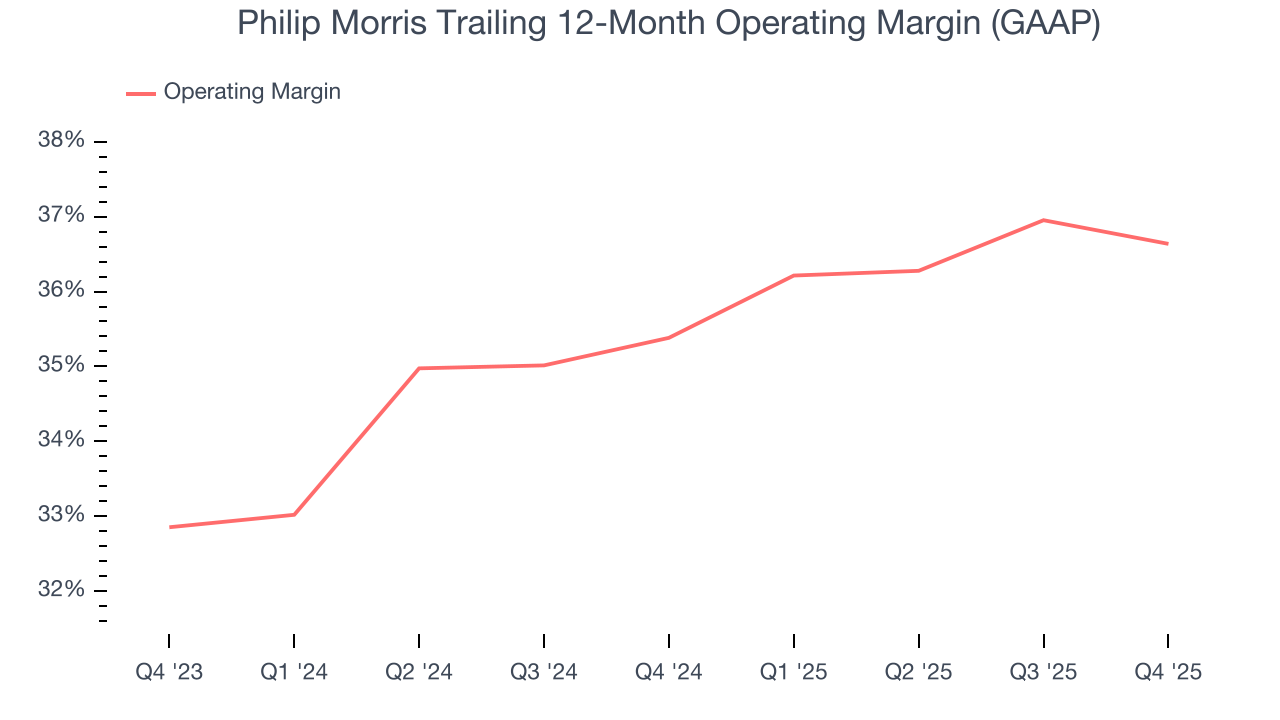
This quarter, Philip Morris generated an operating margin profit margin of 32.6%, down 1 percentage points year on year. Since Philip Morris’s operating margin decreased more than its gross margin, we can assume it was less efficient because expenses such as marketing, and administrative overhead increased.
8. Earnings Per Share
We track the long-term change in earnings per share (EPS) for the same reason as long-term revenue growth. Compared to revenue, however, EPS highlights whether a company’s growth is profitable.
Philip Morris’s decent 8.2% annual EPS growth over the last three years aligns with its revenue performance. This tells us it maintained its per-share profitability as it expanded.
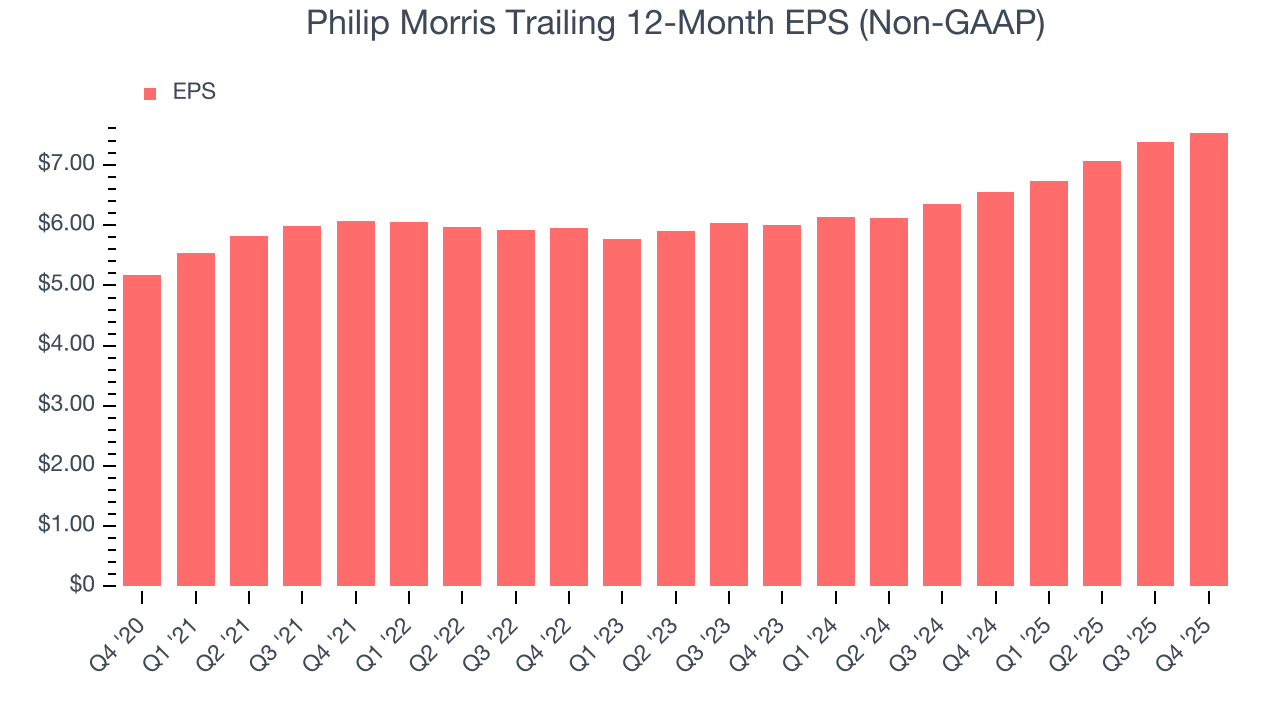
In Q4, Philip Morris reported adjusted EPS of $1.70, up from $1.55 in the same quarter last year. This print was close to analysts’ estimates. Over the next 12 months, Wall Street expects Philip Morris’s full-year EPS of $7.54 to grow 10.2%.
9. Cash Is King
Free cash flow isn't a prominently featured metric in company financials and earnings releases, but we think it's telling because it accounts for all operating and capital expenses, making it tough to manipulate. Cash is king.
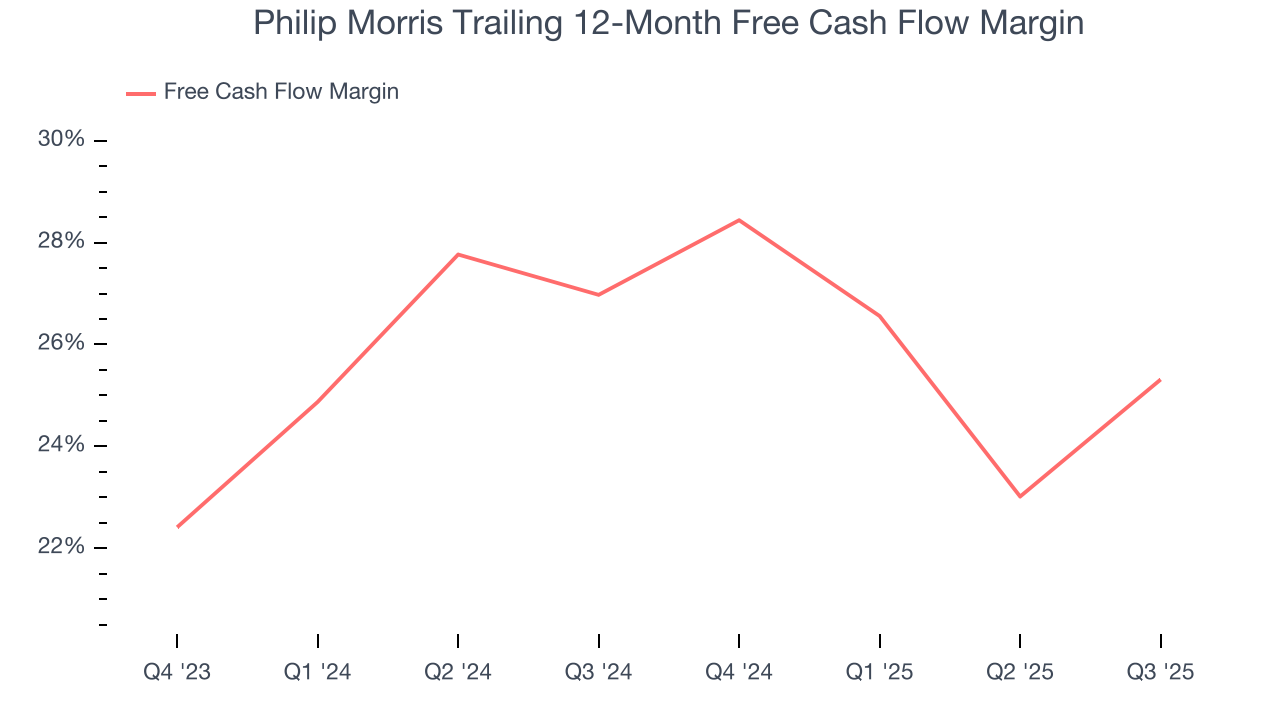
Philip Morris has shown terrific cash profitability, driven by its lucrative business model that enables it to reinvest, return capital to investors, and stay ahead of the competition. The company’s free cash flow margin was among the best in the consumer staples sector, averaging 25.2% over the last two years.
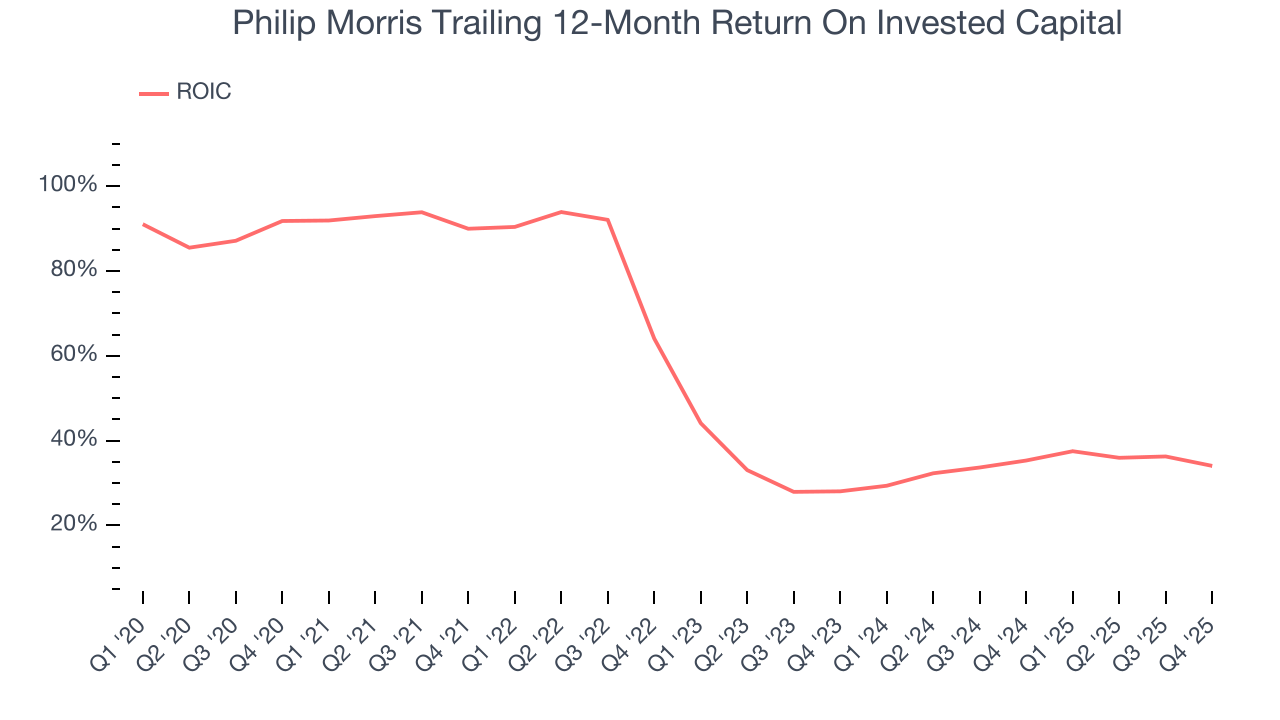
10. Return on Invested Capital (ROIC)
EPS and free cash flow tell us whether a company was profitable while growing its revenue. But was it capital-efficient? A company’s ROIC explains this by showing how much operating profit it makes compared to the money it has raised (debt and equity).
Philip Morris’s five-year average ROIC was 50.3%, placing it among the best consumer staples companies. This illustrates its management team’s ability to invest in highly profitable ventures and produce tangible results for shareholders.
11. Balance Sheet Assessment
Philip Morris reported $4.87 billion of cash and $48.84 billion of debt on its balance sheet in the most recent quarter. As investors in high-quality companies, we primarily focus on two things: 1) that a company’s debt level isn’t too high and 2) that its interest payments are not excessively burdening the business.
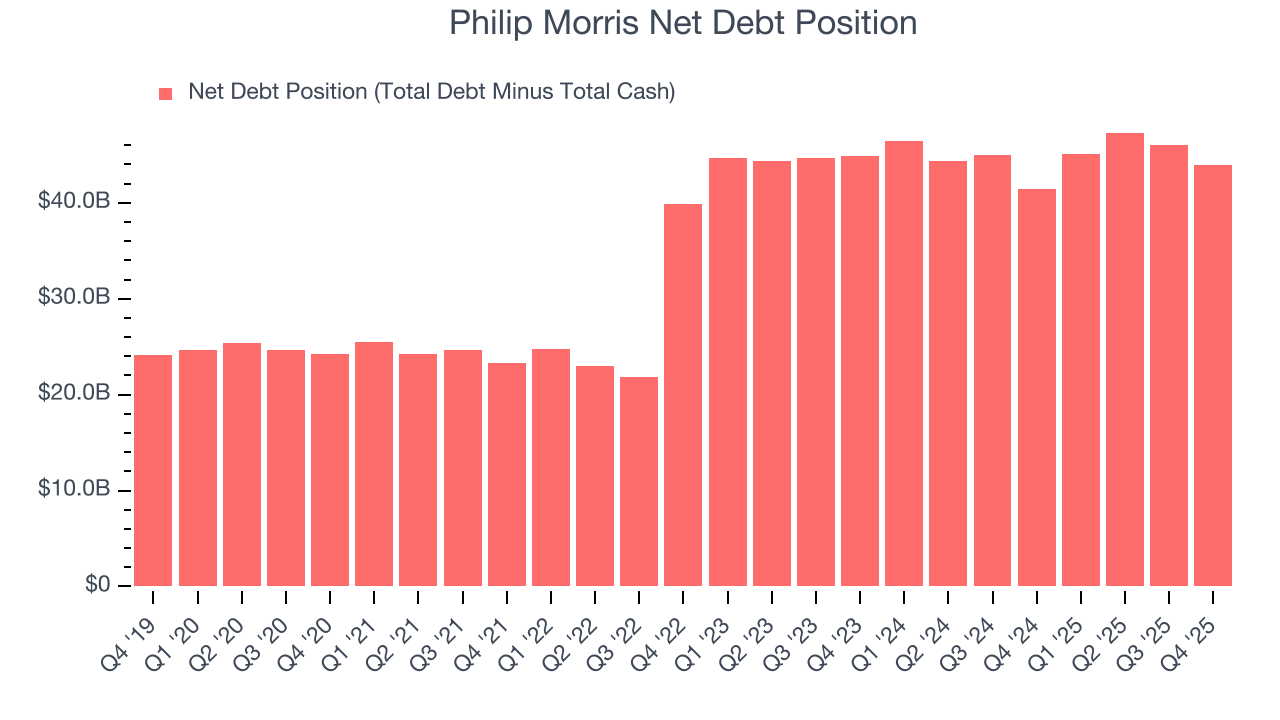
With $17.47 billion of EBITDA over the last 12 months, we view Philip Morris’s 2.5× net-debt-to-EBITDA ratio as safe. We also see its $966 million of annual interest expenses as appropriate. The company’s profits give it plenty of breathing room, allowing it to continue investing in growth initiatives.
12. Key Takeaways from Philip Morris’s Q4 Results
We struggled to find many resounding positives or negatives in these results, as revenue and EPS were both just in line with expectations. Investors were likely hoping for more, and shares traded down 1.4% to $179.50 immediately following the results.
13. Is Now The Time To Buy Philip Morris?
Updated: March 25, 2026 at 11:10 PM EDT
The latest quarterly earnings matters, sure, but we actually think longer-term fundamentals and valuation matter more. Investors should consider all these pieces before deciding whether or not to invest in Philip Morris.
There is a lot to like about Philip Morris. First, the company’s revenue growth was decent over the last three years, and analysts believe this will continue. On top of that, its admirable gross margins are a wonderful starting point for the overall profitability of the business, and its impressive operating margins show it has a highly efficient business model.
Philip Morris’s P/E ratio based on the next 12 months is 19.4x. Scanning the consumer staples space today, Philip Morris’s fundamentals really stand out, and we like it at this price.
Wall Street analysts have a consensus one-year price target of $194.84 on the company (compared to the current share price of $165.13), implying they see 18% upside in buying Philip Morris in the short term.