Ryder (R)
We wouldn’t recommend Ryder. Its underwhelming returns on capital show it struggled to generate meaningful profits for shareholders.― StockStory Analyst Team
1. News


2. Summary
Why We Think Ryder Will Underperform
As one of the first companies to introduce the idea of leasing trucks, Ryder (NYSE:R) provides rental vehicles to businesses and delivers packages directly to homes or businesses.
- Earnings per share have contracted by 4% annually over the last two years, a headwind for returns as stock prices often echo long-term EPS performance
- Cash burn makes us question whether it can achieve sustainable long-term growth
- Estimated sales growth of 1.6% for the next 12 months implies demand will slow from its two-year trend


Ryder is in the penalty box. We’re redirecting our focus to better businesses.
Why There Are Better Opportunities Than Ryder


Ryder is trading at $212.48 per share, or 15.4x forward P/E. Ryder’s multiple may seem like a great deal among industrials peers, but we think there are valid reasons why it’s this cheap.
Cheap stocks can look like great bargains at first glance, but you often get what you pay for. These mediocre businesses often have less earnings power, meaning there is more reliance on a re-rating to generate good returns - an unlikely scenario for low-quality companies.
3. Ryder (R) Research Report: Q4 CY2025 Update
Commercial rental vehicle and delivery company Ryder (NYSE:R) missed Wall Street’s revenue expectations in Q4 CY2025, with sales flat year on year at $3.18 billion. Its non-GAAP profit of $3.59 per share was in line with analysts’ consensus estimates.
Ryder (R) Q4 CY2025 Highlights:
- Revenue: $3.18 billion vs analyst estimates of $3.20 billion (flat year on year, 0.7% miss)
- Adjusted EPS: $3.59 vs analyst expectations of $3.57 (in line)
- Adjusted EBITDA: $726 million vs analyst estimates of $731 million (22.9% margin, 0.7% miss)
- Adjusted EPS guidance for the upcoming financial year 2026 is $13.95 at the midpoint, missing analyst estimates by 4.6%
- Operating Margin: 8.8%, in line with the same quarter last year
- Free Cash Flow was $450 million, up from -$203 million in the same quarter last year
- Market Capitalization: $8.57 billion
Company Overview
As one of the first companies to introduce the idea of leasing trucks, Ryder (NYSE:R) provides rental vehicles to businesses and delivers packages directly to homes or businesses.
Ryder was founded in 1933 as a business hauling concrete. What started off with a single truck was able to expand its fleet of vehicles by acquiring various businesses. As its fleet grew, the company began to offer its trucks for other companies to lease in addition to making last-mile deliveries, the last step in the fulfillment process. Specifically, the $120 million acquisition of MXD in 2018 was pivotal for expanding its e-commerce fulfillment and last-mile delivery services.
Ryder’s last-mile delivery service includes everything from loading trucks with packages to delivering items directly to homes or businesses. The company differentiates itself by delivering big and bulky products, and it engages in contracts spanning from a couple of months to multiple years.
In addition to its last-mile delivery service, Ryders’ ChoiceLease program provides vehicles and maintenance services. Clients can either commit to a full-maintenance plan or pay for maintenance service when needed. The business also offers commercial rental service catering for customers needing additional vehicles for up to a year. This helps businesses manage seasonal spikes, special projects, or temporary replacements.
4. Ground Transportation
The growth of e-commerce and global trade continues to drive demand for shipping services, especially last-mile delivery, presenting opportunities for ground transportation companies. The industry continues to invest in data, analytics, and autonomous fleets to optimize efficiency and find the most cost-effective routes. Despite the essential services this industry provides, ground transportation companies are still at the whim of economic cycles. Consumer spending, for example, can greatly impact the demand for these companies’ offerings while fuel costs can influence profit margins.
Competitors offering similar products include U-Haul (NYSE:UHAL), Penske (NYSE:PAG), and Enterprise (private)
5. Revenue Growth
A company’s long-term sales performance can indicate its overall quality. Any business can experience short-term success, but top-performing ones enjoy sustained growth for years. Over the last five years, Ryder grew its sales at a decent 8.5% compounded annual growth rate. Its growth was slightly above the average industrials company and shows its offerings resonate with customers.
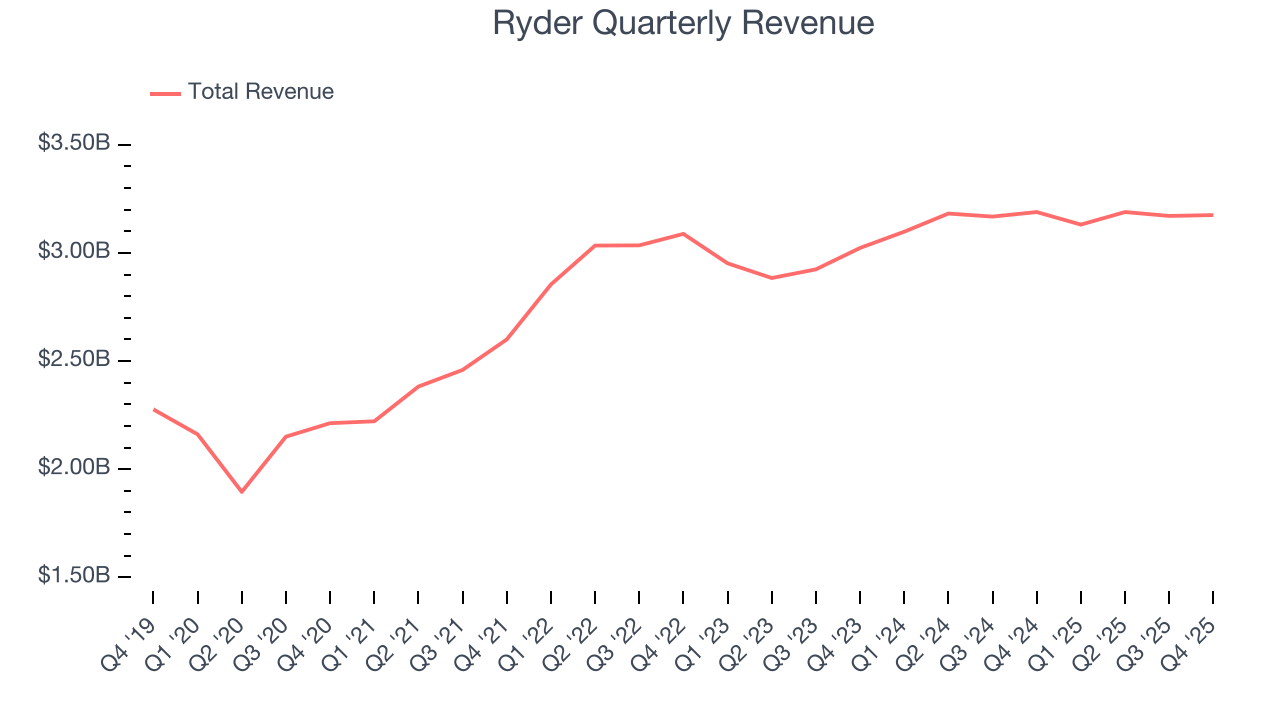
We at StockStory place the most emphasis on long-term growth, but within industrials, a half-decade historical view may miss cycles, industry trends, or a company capitalizing on catalysts such as a new contract win or a successful product line. Ryder’s recent performance shows its demand has slowed as its annualized revenue growth of 3.7% over the last two years was below its five-year trend. 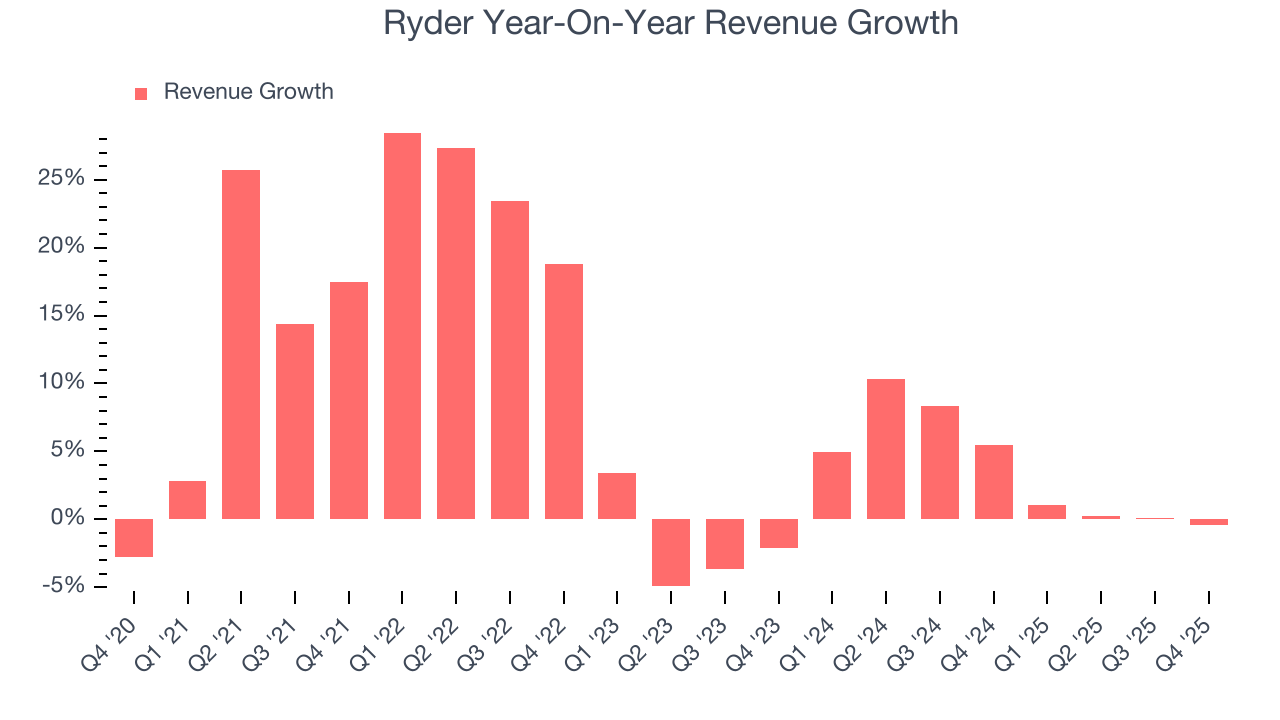
We can better understand the company’s revenue dynamics by analyzing its most important segments, Fleet Management Solutions and Supply Chain Solutions, which are 46.2% and 43.5% of revenue. Over the last two years, Ryder’s Fleet Management Solutions revenue (leasing and rental) was flat while its Supply Chain Solutions revenue ( designing and managing customers' distribution) averaged 5.9% year-on-year growth. 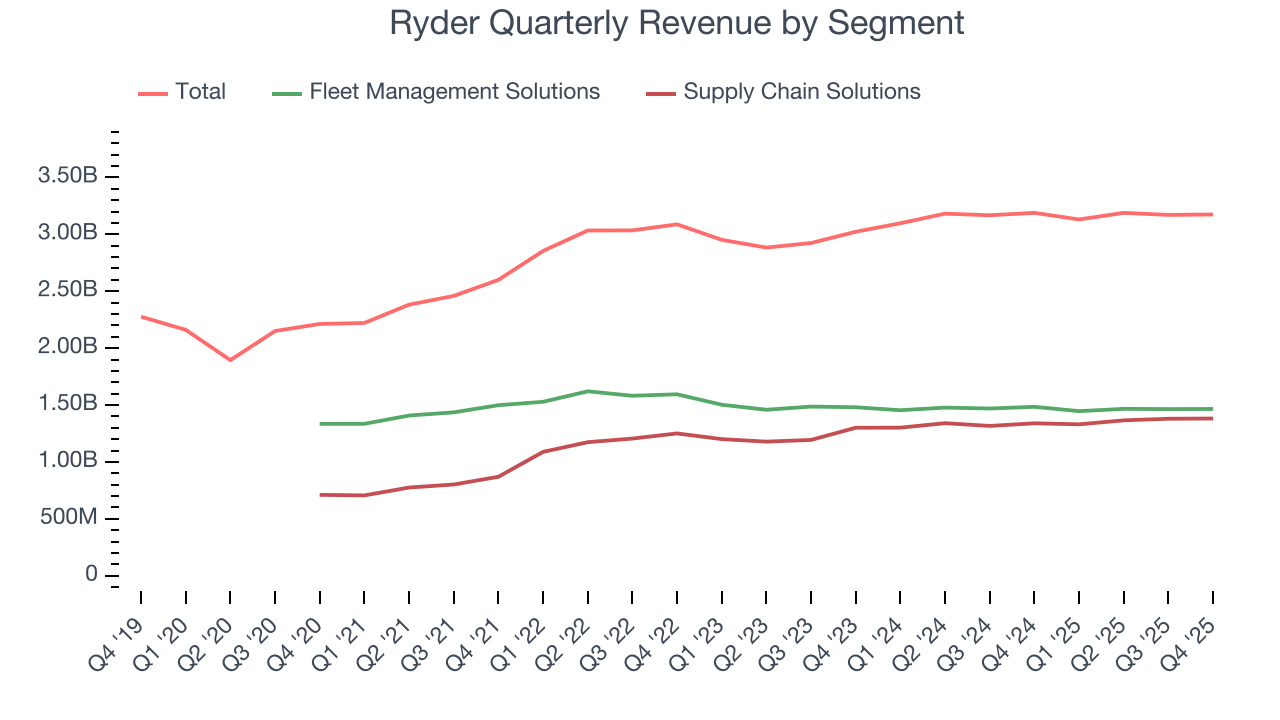
This quarter, Ryder missed Wall Street’s estimates and reported a rather uninspiring 0.4% year-on-year revenue decline, generating $3.18 billion of revenue.
Looking ahead, sell-side analysts expect revenue to grow 3.1% over the next 12 months, similar to its two-year rate. This projection is underwhelming and indicates its newer products and services will not accelerate its top-line performance yet.
6. Gross Margin & Pricing Power
All else equal, we prefer higher gross margins because they make it easier to generate more operating profits and indicate that a company commands pricing power by offering more differentiated products.
Ryder has bad unit economics for an industrials business, signaling it operates in a competitive market. As you can see below, it averaged a 19.7% gross margin over the last five years. That means Ryder paid its suppliers a lot of money ($80.33 for every $100 in revenue) to run its business. 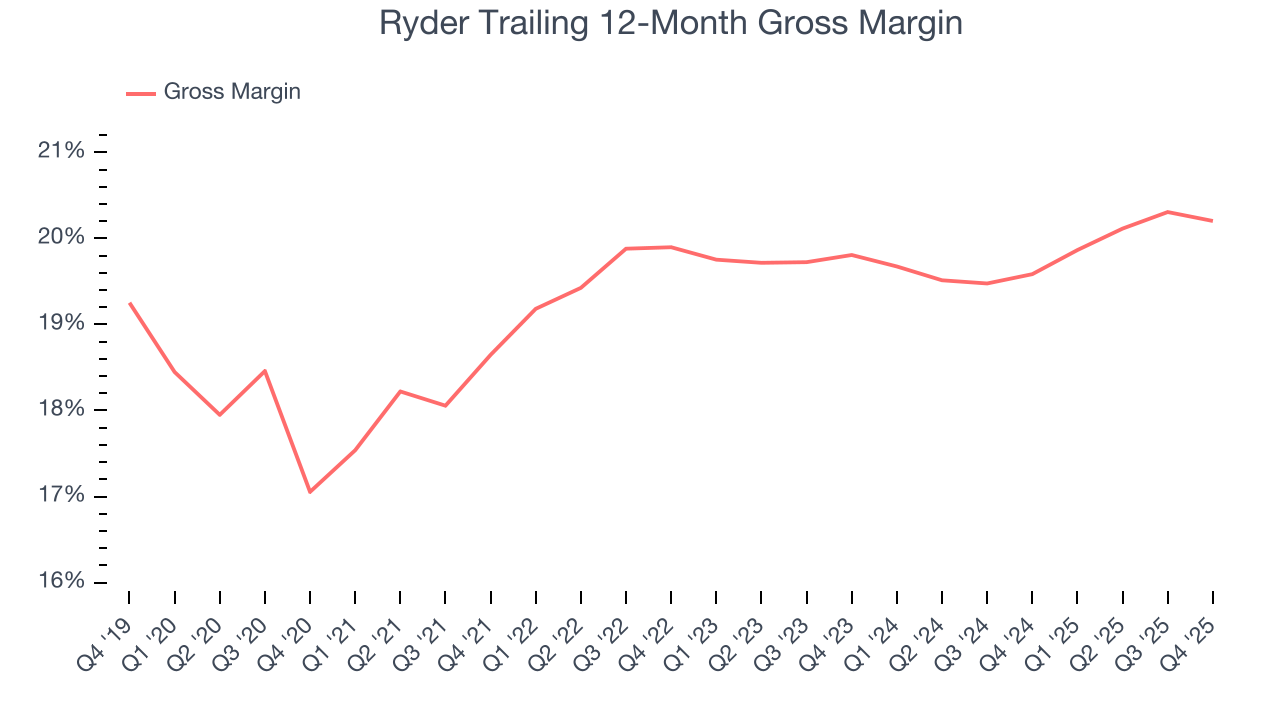
Ryder’s gross profit margin came in at 19.7% this quarter, in line with the same quarter last year. On a wider time horizon, the company’s full-year margin has remained steady over the past four quarters, suggesting its input costs (such as raw materials and manufacturing expenses) have been stable and it isn’t under pressure to lower prices.
7. Operating Margin
Ryder has done a decent job managing its cost base over the last five years. The company has produced an average operating margin of 8.2%, higher than the broader industrials sector.
Looking at the trend in its profitability, Ryder’s operating margin rose by 1.8 percentage points over the last five years, as its sales growth gave it operating leverage. Its expansion was impressive, especially when considering most Ground Transportation peers saw their margins plummet.
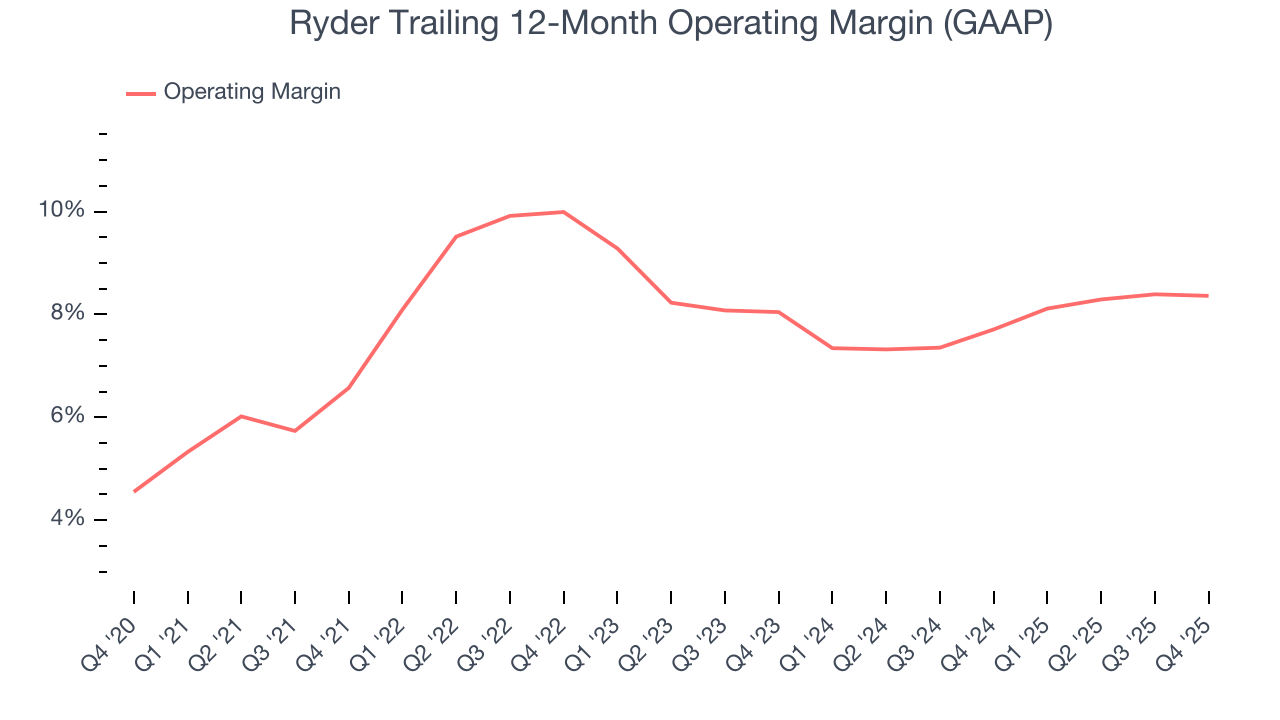
This quarter, Ryder generated an operating margin profit margin of 8.8%, in line with the same quarter last year. This indicates the company’s cost structure has recently been stable.
8. Earnings Per Share
We track the long-term change in earnings per share (EPS) for the same reason as long-term revenue growth. Compared to revenue, however, EPS highlights whether a company’s growth is profitable.
Ryder’s full-year EPS flipped from negative to positive over the last five years. This is encouraging and shows it’s at a critical moment in its life.
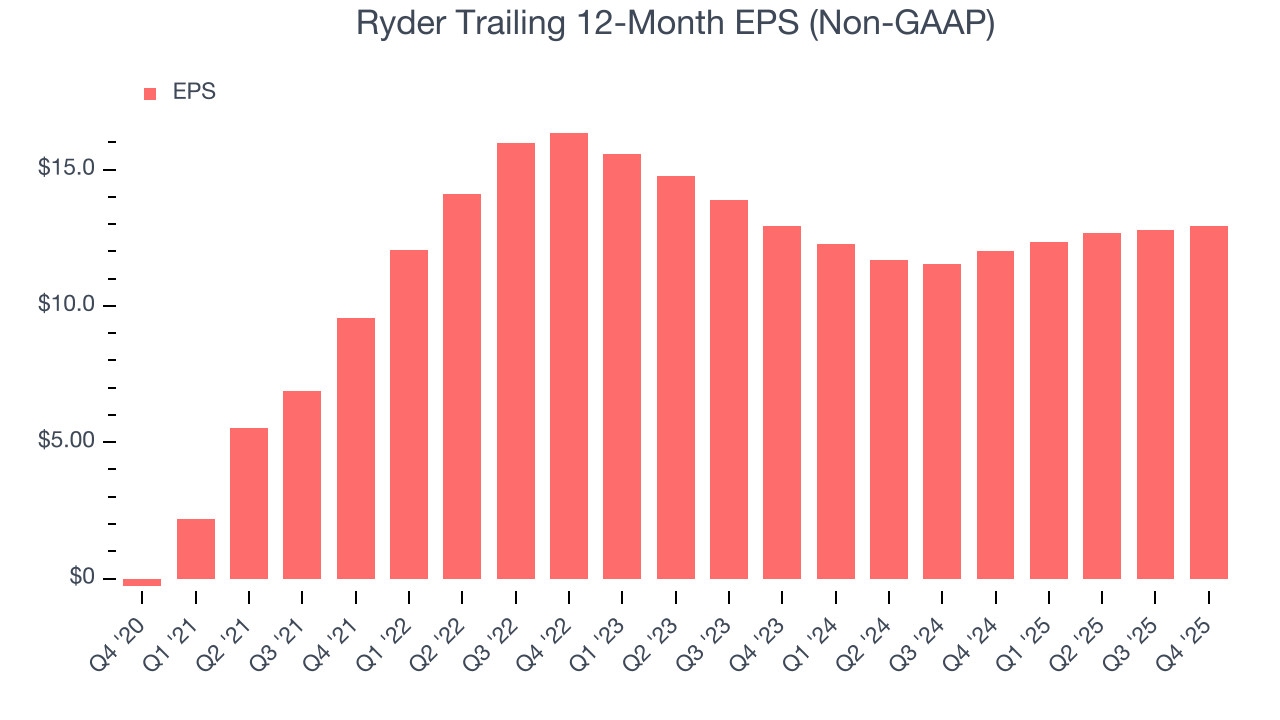
Like with revenue, we analyze EPS over a more recent period because it can provide insight into an emerging theme or development for the business.
Ryder’s flat EPS over the last two years was worse than its 3.7% annualized revenue growth. This tells us the company became less profitable on a per-share basis as it expanded.
In Q4, Ryder reported adjusted EPS of $3.59, up from $3.45 in the same quarter last year. This print was close to analysts’ estimates. Over the next 12 months, Wall Street expects Ryder’s full-year EPS of $12.94 to grow 12.9%.
9. Cash Is King
Although earnings are undoubtedly valuable for assessing company performance, we believe cash is king because you can’t use accounting profits to pay the bills.
While Ryder posted positive free cash flow this quarter, the broader story hasn’t been so clean. Ryder’s demanding reinvestments have drained its resources over the last five years, putting it in a pinch and limiting its ability to return capital to investors. Its free cash flow margin averaged negative 1.4%, meaning it lit $1.40 of cash on fire for every $100 in revenue.
Taking a step back, an encouraging sign is that Ryder’s margin expanded by 2 percentage points during that time. Despite its improvement and recent free cash flow generation, we’d like to see more quarters of positive cash flow before recommending the stock.
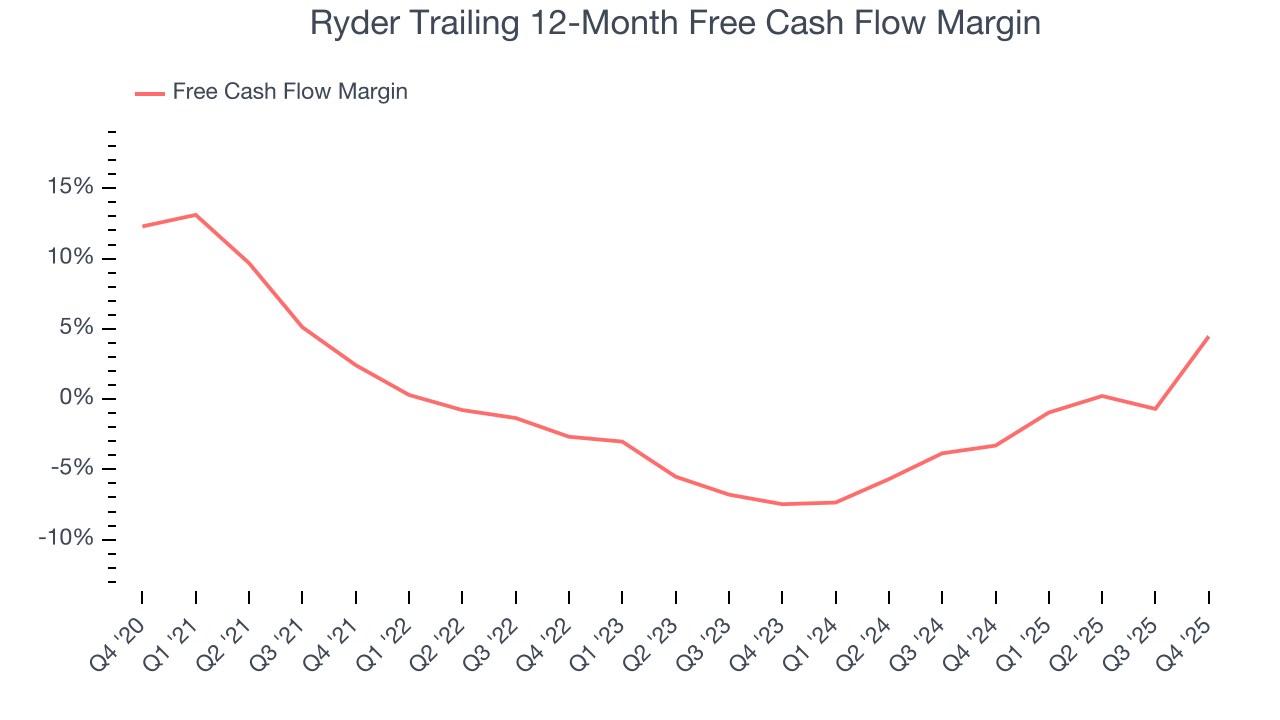
Ryder’s free cash flow clocked in at $450 million in Q4, equivalent to a 14.2% margin. Its cash flow turned positive after being negative in the same quarter last year, marking a potential inflection point.
10. Return on Invested Capital (ROIC)
EPS and free cash flow tell us whether a company was profitable while growing its revenue. But was it capital-efficient? A company’s ROIC explains this by showing how much operating profit it makes compared to the money it has raised (debt and equity).
Ryder historically did a mediocre job investing in profitable growth initiatives. Its five-year average ROIC was 7.6%, somewhat low compared to the best industrials companies that consistently pump out 20%+.
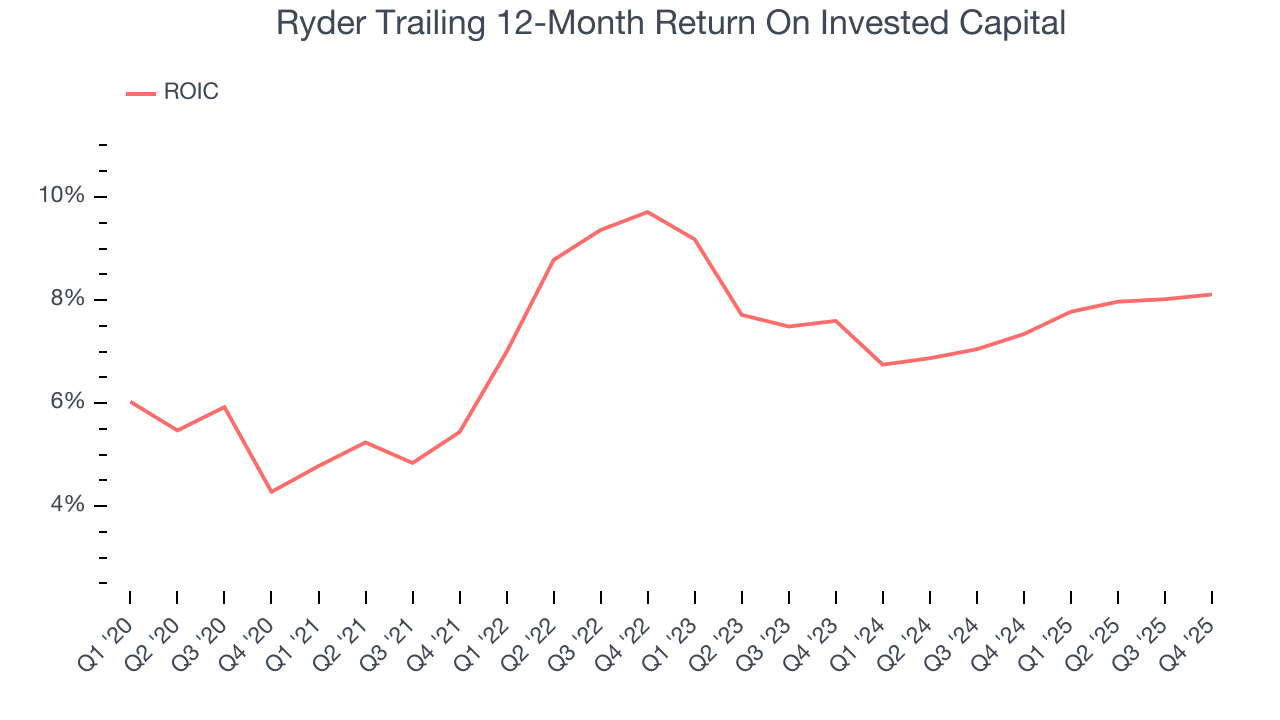
We like to invest in businesses with high returns, but the trend in a company’s ROIC is what often surprises the market and moves the stock price. Unfortunately, Ryder’s ROIC has stayed the same over the last few years. If the company wants to become an investable business, it must improve its returns by generating more profitable growth.
11. Balance Sheet Assessment
Ryder reported $198 million of cash and $7.65 billion of debt on its balance sheet in the most recent quarter. As investors in high-quality companies, we primarily focus on two things: 1) that a company’s debt level isn’t too high and 2) that its interest payments are not excessively burdening the business.
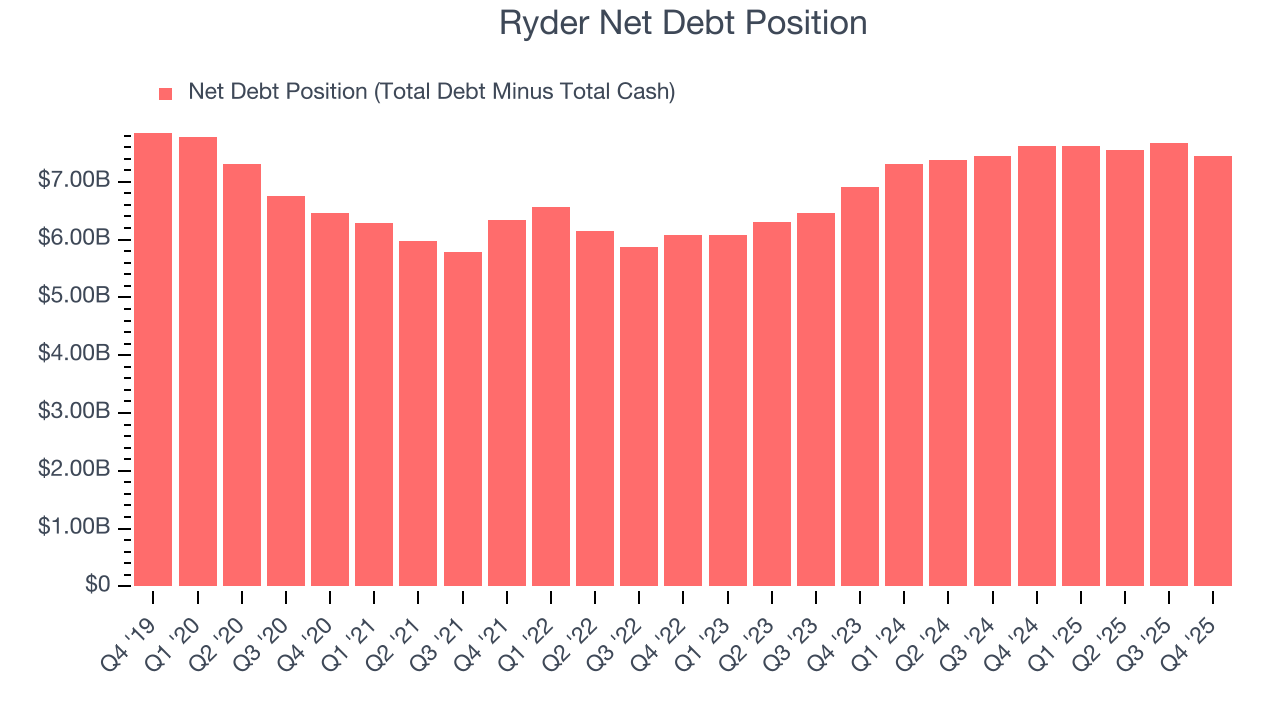
With $2.86 billion of EBITDA over the last 12 months, we view Ryder’s 2.6× net-debt-to-EBITDA ratio as safe. We also see its $203 million of annual interest expenses as appropriate. The company’s profits give it plenty of breathing room, allowing it to continue investing in growth initiatives.
12. Key Takeaways from Ryder’s Q4 Results
We struggled to find many positives in these results. Its full-year EPS guidance missed and its EPS guidance for next quarter fell short of Wall Street’s estimates. Overall, this quarter could have been better. The stock traded down 3.6% to $204.50 immediately following the results.
13. Is Now The Time To Buy Ryder?
Updated: February 11, 2026 at 7:09 AM EST
The latest quarterly earnings matters, sure, but we actually think longer-term fundamentals and valuation matter more. Investors should consider all these pieces before deciding whether or not to invest in Ryder.
Ryder isn’t a terrible business, but it doesn’t pass our bar. Although its revenue growth was good over the last five years, it’s expected to deteriorate over the next 12 months and its cash burn raises the question of whether it can sustainably maintain growth. And while the company’s astounding EPS growth over the last five years shows its profits are trickling down to shareholders, the downside is its low gross margins indicate some combination of competitive pressures and high production costs.
Ryder’s P/E ratio based on the next 12 months is 14.5x. This valuation is reasonable, but the company’s shakier fundamentals present too much downside risk. We're fairly confident there are better stocks to buy right now.
Wall Street analysts have a consensus one-year price target of $215.44 on the company (compared to the current share price of $204.50).