
RE/MAX (RMAX)
RE/MAX faces an uphill battle. Its sales have underperformed and its low returns on capital show it has few growth opportunities.― StockStory Analyst Team
1. News


2. Summary
Why We Think RE/MAX Will Underperform
Short for Real Estate Maximums, RE/MAX (NYSE:RMAX) operates a real estate franchise network spanning over 100 countries and territories.
- Annual revenue growth of 1.9% over the last five years was below our standards for the consumer discretionary sector
- Incremental sales over the last five years were much less profitable as its earnings per share fell by 7.1% annually while its revenue grew
- Estimated sales for the next 12 months are flat and imply a softer demand environment


RE/MAX falls short of our quality standards. There are more profitable opportunities elsewhere.
Why There Are Better Opportunities Than RE/MAX


At $5.73 per share, RE/MAX trades at 4.3x forward P/E. This sure is a cheap multiple, but you get what you pay for.
Our advice is to pay up for elite businesses whose advantages are tailwinds to earnings growth. Don’t get sucked into lower-quality businesses just because they seem like bargains. These mediocre businesses often never achieve a higher multiple as hoped, a phenomenon known as a “value trap”.
3. RE/MAX (RMAX) Research Report: Q4 CY2025 Update
Real estate franchise company RE/MAX (NYSE:RMAX) met Wall Street’s revenue expectations in Q4 CY2025, but sales fell by 1.8% year on year to $71.14 million. On the other hand, next quarter’s revenue guidance of $71.5 million was less impressive, coming in 3% below analysts’ estimates. Its non-GAAP profit of $0.30 per share was 5.4% above analysts’ consensus estimates.
RE/MAX (RMAX) Q4 CY2025 Highlights:
- Revenue: $71.14 million vs analyst estimates of $71.42 million (1.8% year-on-year decline, in line)
- Adjusted EPS: $0.30 vs analyst estimates of $0.28 (5.4% beat)
- Adjusted EBITDA: $22.4 million vs analyst estimates of $21.22 million (31.5% margin, 5.6% beat)
- Revenue Guidance for Q1 CY2026 is $71.5 million at the midpoint, below analyst estimates of $73.71 million
- EBITDA guidance for the upcoming financial year 2026 is $95 million at the midpoint, above analyst estimates of $93.61 million
- Operating Margin: 13.1%, up from 5.9% in the same quarter last year
- Free Cash Flow Margin: 14.3%, down from 22.1% in the same quarter last year
- Agents: 148,660, up 2,033 year on year
- Market Capitalization: $137 million
Company Overview
Short for Real Estate Maximums, RE/MAX (NYSE:RMAX) operates a real estate franchise network spanning over 100 countries and territories.
RE/MAX’s business model centers around its franchise system with independent agents who work under the RE/MAX brand. This model has allowed for rapid global expansion of RE/MAX and its offerings, which include residential and commercial real estate services (buying, selling, and leasing properties).
A strength of RE/MAX is its brand recognition and reputation for having experienced, productive agents. RE/MAX agents have access to continuous training, analytical resources, and a vast network of global listings, which enhances their ability to serve buyers and sellers effectively.
To maintain its relevance, RE/MAX invests in digital tools and platforms to streamline the real estate transaction process and improve the customer experience. These include proprietary software for lead management, transaction management, and marketing, as well as a global listing website.
4. Consumer Discretionary - Real Estate Services
The Consumer Discretionary sector, by definition, is made up of companies selling non-essential goods and services. When economic conditions deteriorate or tastes shift, consumers can easily cut back or eliminate these purchases. For long-term investors with five-year holding periods, this creates a structural challenge: the sector is inherently hit-driven, with low switching costs and fickle customers. As a result, only a handful of companies can reliably grow demand and compound earnings over long periods, which is why our bar is high and High Quality ratings are rare.
Real estate services companies provide brokerage, property management, appraisal, and advisory services, earning transaction-based commissions and recurring management fees. Tailwinds include long-term housing demand driven by demographic growth, technology platforms that expand market access, and commercial real estate complexity that sustains advisory needs. Headwinds are pronounced: rising interest rates directly suppress transaction volumes by reducing housing affordability and commercial deal activity. Commission-rate compression, driven by discount brokerages and regulatory changes, erodes per-transaction revenue. The industry is highly cyclical, with revenue swings amplified by leverage. PropTech (property technology) disruptors threaten traditional intermediary models.
RE/MAX’s primary competitors are Realogy Holdings (NYSE:RLGY), Zillow (NASDAQ:ZG), Redfin (NASDAQ:RDFN), eXp World (NASDAQ:EXPI), and private companies Keller Williams Realty and Century 21 Real Estate.
5. Revenue Growth
A company’s long-term sales performance can indicate its overall quality. Any business can put up a good quarter or two, but the best consistently grow over the long haul. Regrettably, RE/MAX’s sales grew at a weak 1.9% compounded annual growth rate over the last five years. This fell short of our benchmarks and is a poor baseline for our analysis.
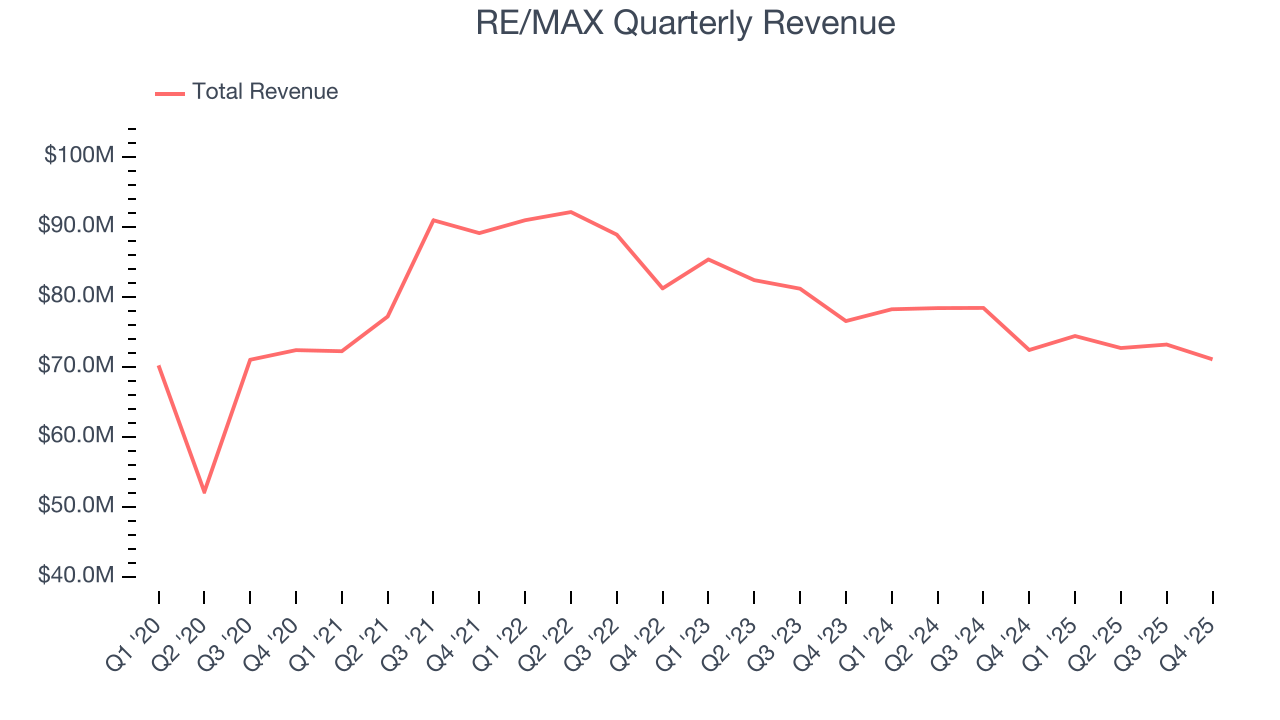
We at StockStory place the most emphasis on long-term growth, but within consumer discretionary, a stretched historical view may miss a company riding a successful new product or trend. RE/MAX’s performance shows it grew in the past but relinquished its gains over the last two years, as its revenue fell by 5.4% annually. 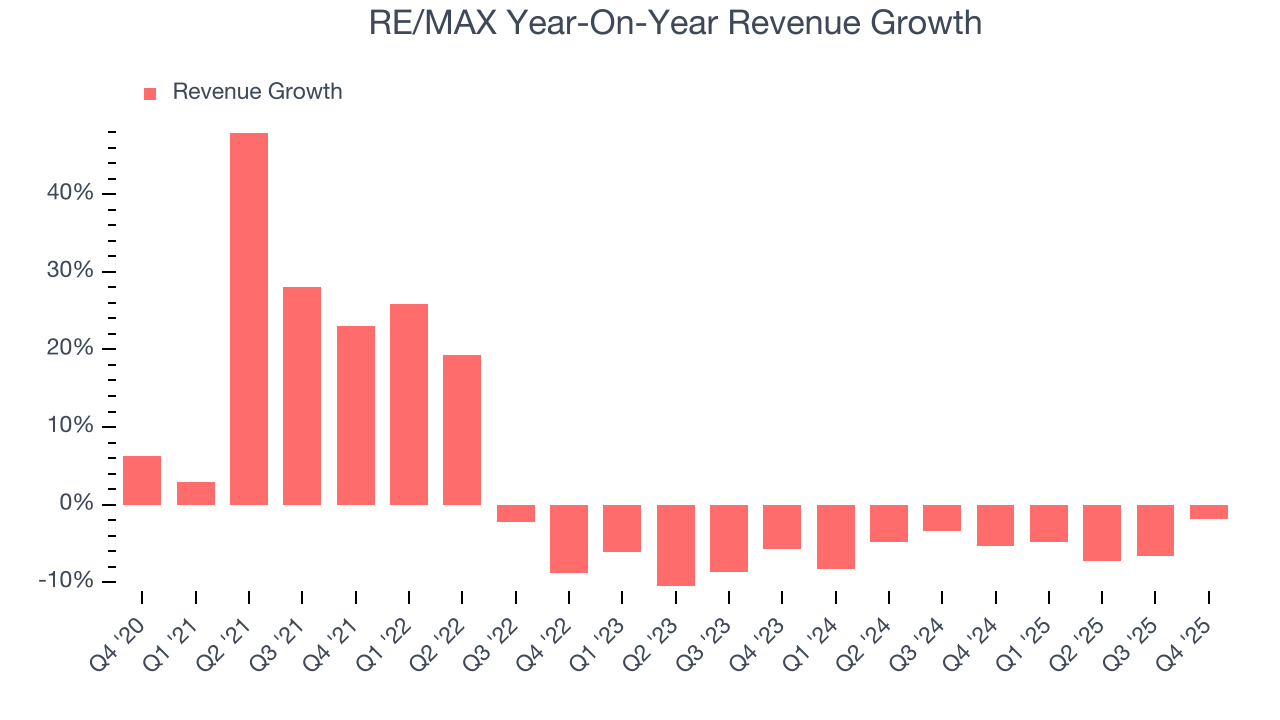
We can dig further into the company’s revenue dynamics by analyzing its number of agents, which reached 148,660 in the latest quarter. Over the last two years, RE/MAX’s agents averaged 1.4% year-on-year growth. Because this number is higher than its revenue growth during the same period, we can see the company’s monetization has fallen. 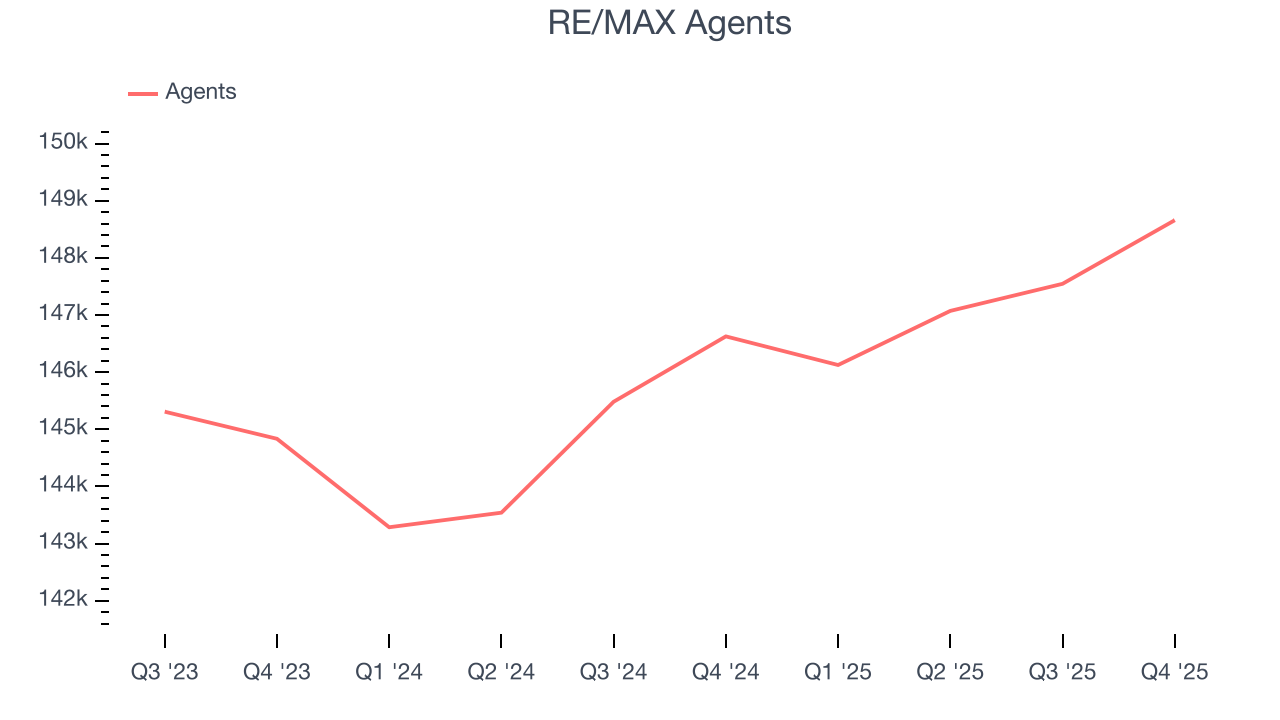
This quarter, RE/MAX reported a rather uninspiring 1.8% year-on-year revenue decline to $71.14 million of revenue, in line with Wall Street’s estimates. Company management is currently guiding for a 4% year-on-year decline in sales next quarter.
Looking further ahead, sell-side analysts expect revenue to grow 1.2% over the next 12 months. While this projection indicates its newer products and services will spur better top-line performance, it is still below the sector average.
6. Operating Margin
Operating margin is an important measure of profitability as it shows the portion of revenue left after accounting for all core expenses – everything from the cost of goods sold to advertising and wages. It’s also useful for comparing profitability across companies with different levels of debt and tax rates because it excludes interest and taxes.
RE/MAX’s operating margin has risen over the last 12 months and averaged 14.6% over the last two years. The company’s higher efficiency is a breath of fresh air, but its suboptimal cost structure means it still sports inadequate profitability for a consumer discretionary business.
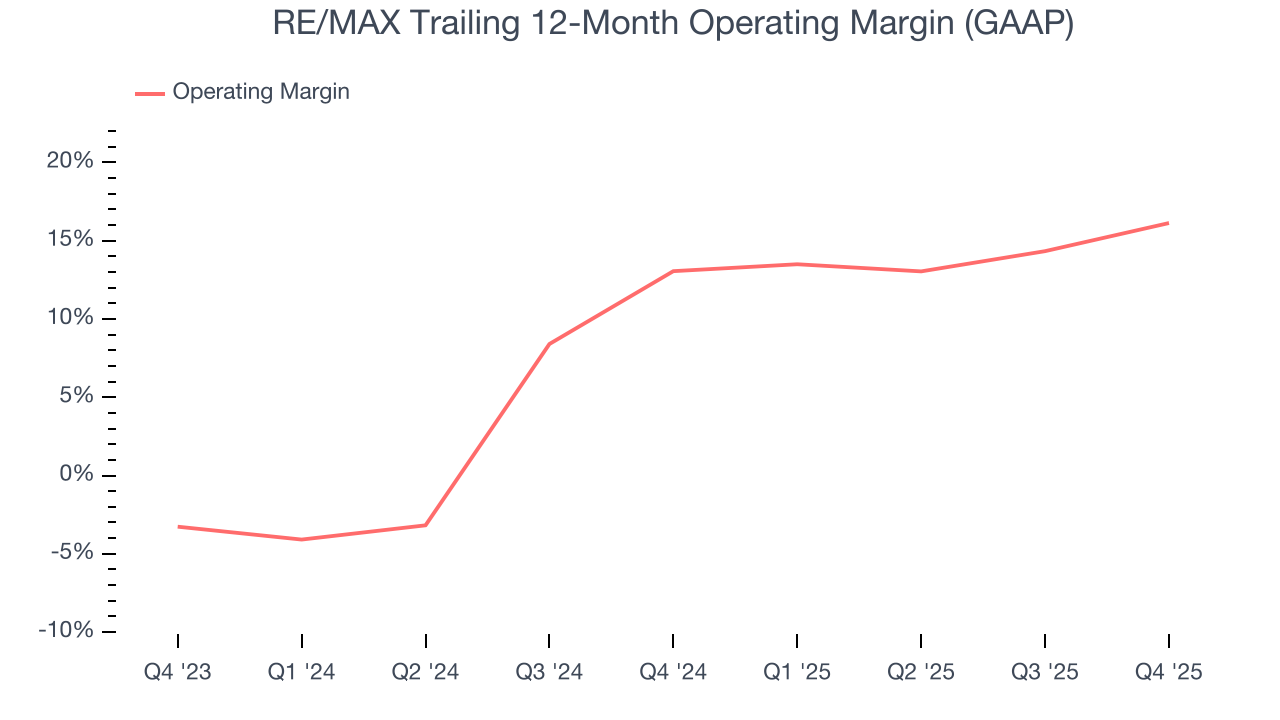
In Q4, RE/MAX generated an operating margin profit margin of 13.1%, up 7.2 percentage points year on year. This increase was a welcome development, especially since its revenue fell, showing it was more efficient because it scaled down its expenses.
7. Earnings Per Share
Revenue trends explain a company’s historical growth, but the long-term change in earnings per share (EPS) points to the profitability of that growth – for example, a company could inflate its sales through excessive spending on advertising and promotions.
Sadly for RE/MAX, its EPS declined by 7.1% annually over the last five years while its revenue grew by 1.9%. However, its operating margin actually improved during this time, telling us that non-fundamental factors such as interest expenses and taxes affected its ultimate earnings.
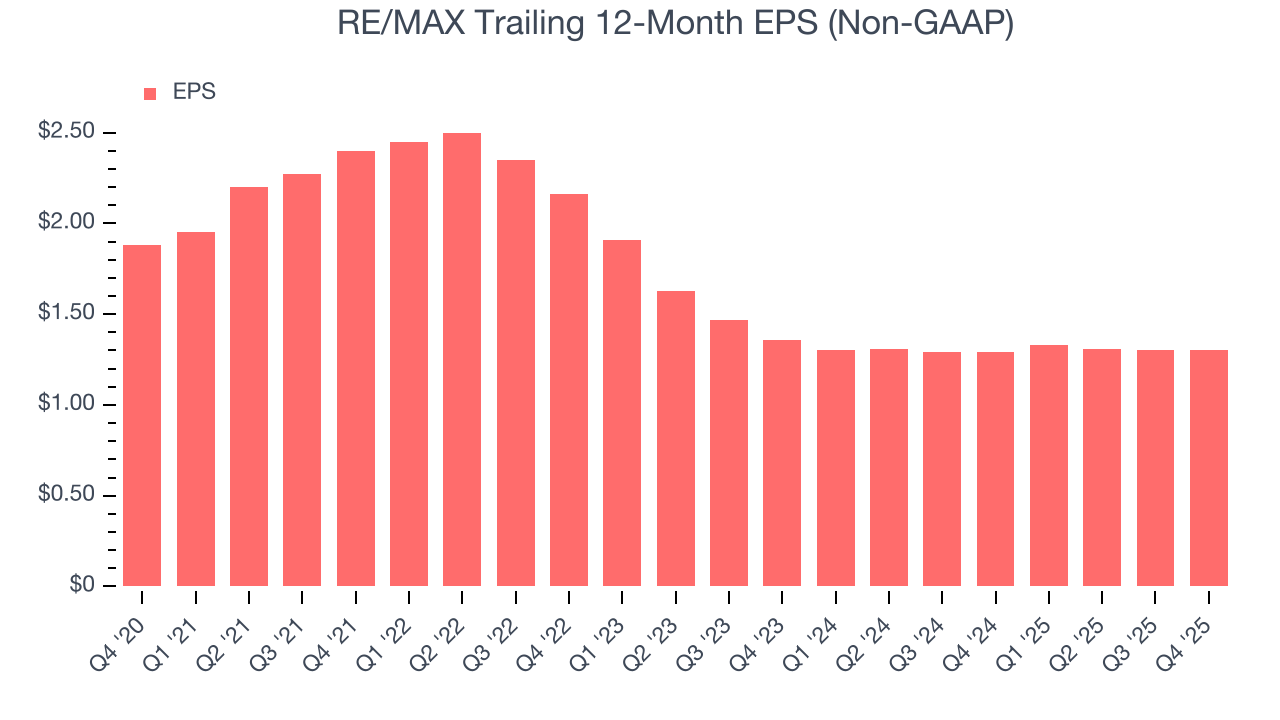
In Q4, RE/MAX reported adjusted EPS of $0.30, in line with the same quarter last year. This print beat analysts’ estimates by 5.4%. Over the next 12 months, Wall Street expects RE/MAX’s full-year EPS of $1.30 to stay about the same.
8. Cash Is King
If you’ve followed StockStory for a while, you know we emphasize free cash flow. Why, you ask? We believe that in the end, cash is king, and you can’t use accounting profits to pay the bills.
RE/MAX has shown poor cash profitability over the last two years, giving the company limited opportunities to return capital to shareholders. Its free cash flow margin averaged 13.2%, lousy for a consumer discretionary business.
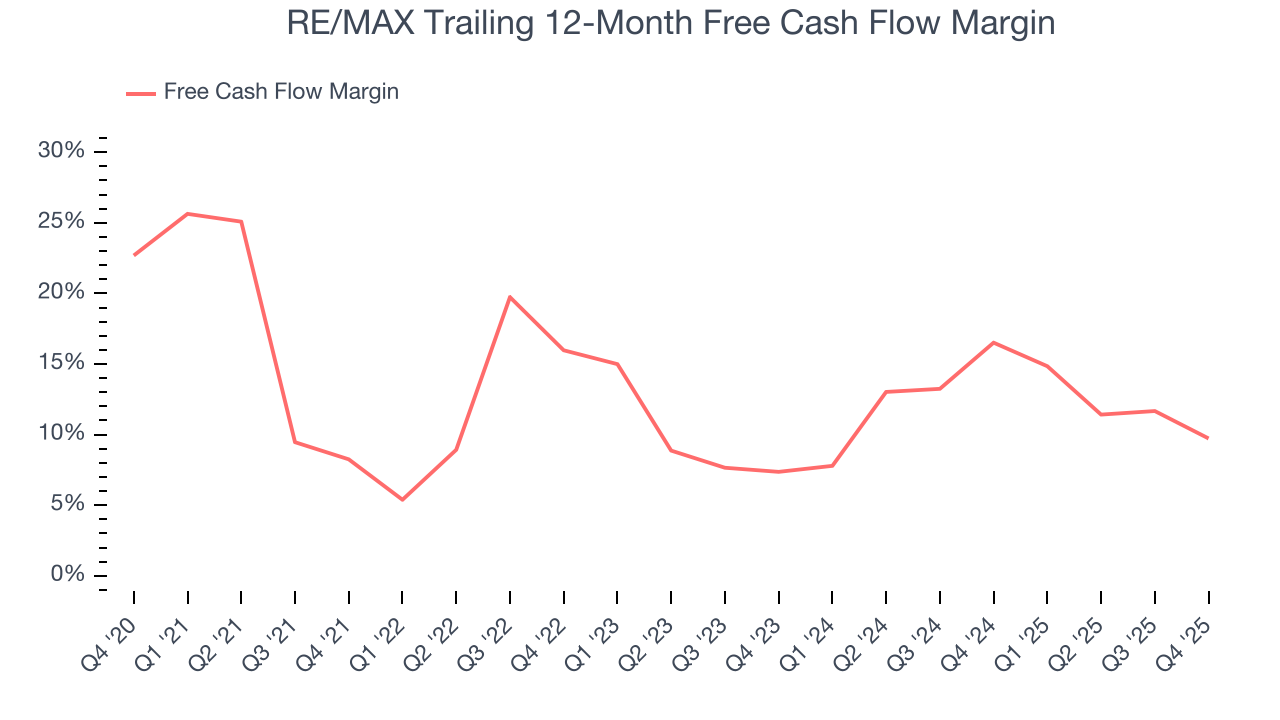
RE/MAX’s free cash flow clocked in at $10.17 million in Q4, equivalent to a 14.3% margin. The company’s cash profitability regressed as it was 7.8 percentage points lower than in the same quarter last year, but it’s still above its two-year average. We wouldn’t read too much into this quarter’s decline because investment needs can be seasonal, causing short-term swings. Long-term trends are more important.
Over the next year, analysts predict RE/MAX’s cash conversion will fall. Their consensus estimates imply its free cash flow margin of 9.7% for the last 12 months will decrease to 4.2%.
9. Return on Invested Capital (ROIC)
EPS and free cash flow tell us whether a company was profitable while growing its revenue. But was it capital-efficient? A company’s ROIC explains this by showing how much operating profit it makes compared to the money it has raised (debt and equity).
RE/MAX historically did a mediocre job investing in profitable growth initiatives. Its five-year average ROIC was 0.5%, lower than the typical cost of capital (how much it costs to raise money) for consumer discretionary companies.
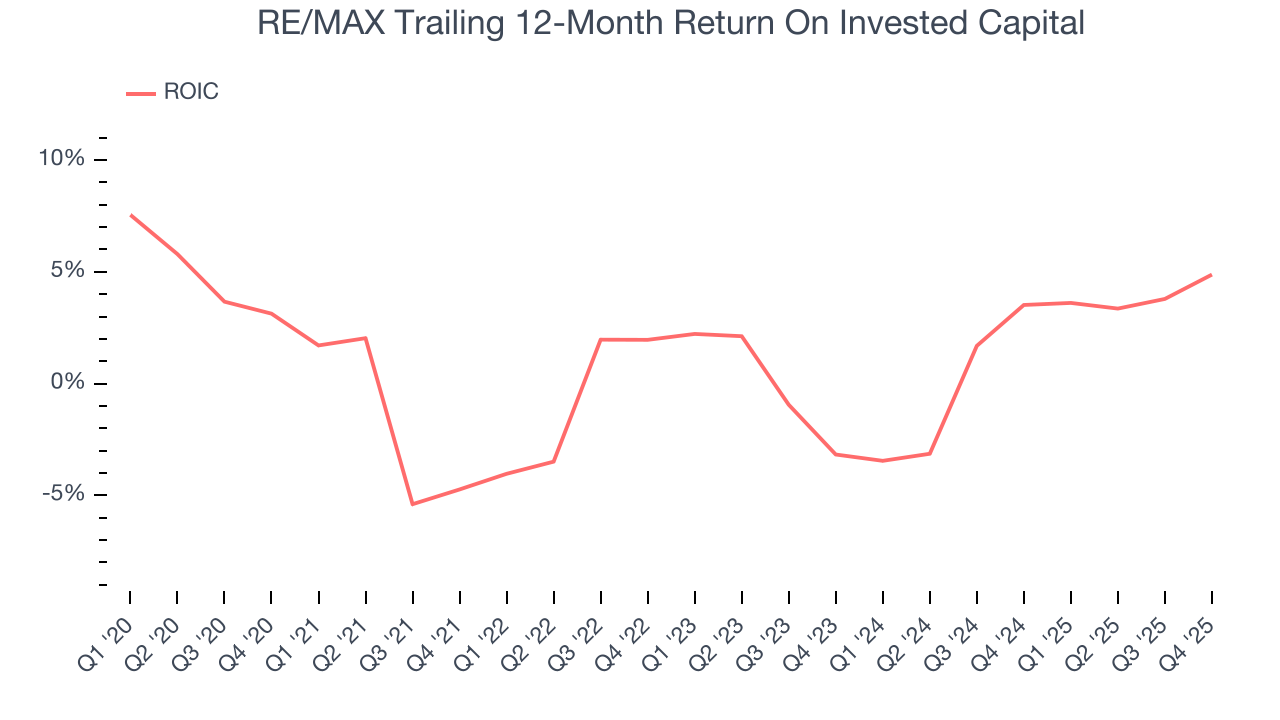
We like to invest in businesses with high returns, but the trend in a company’s ROIC is what often surprises the market and moves the stock price. Fortunately, RE/MAX’s has increased over the last few years. This is a good sign, and we hope the company can continue improving.
10. Balance Sheet Assessment
RE/MAX reported $193.1 million of cash and $459.5 million of debt on its balance sheet in the most recent quarter. As investors in high-quality companies, we primarily focus on two things: 1) that a company’s debt level isn’t too high and 2) that its interest payments are not excessively burdening the business.
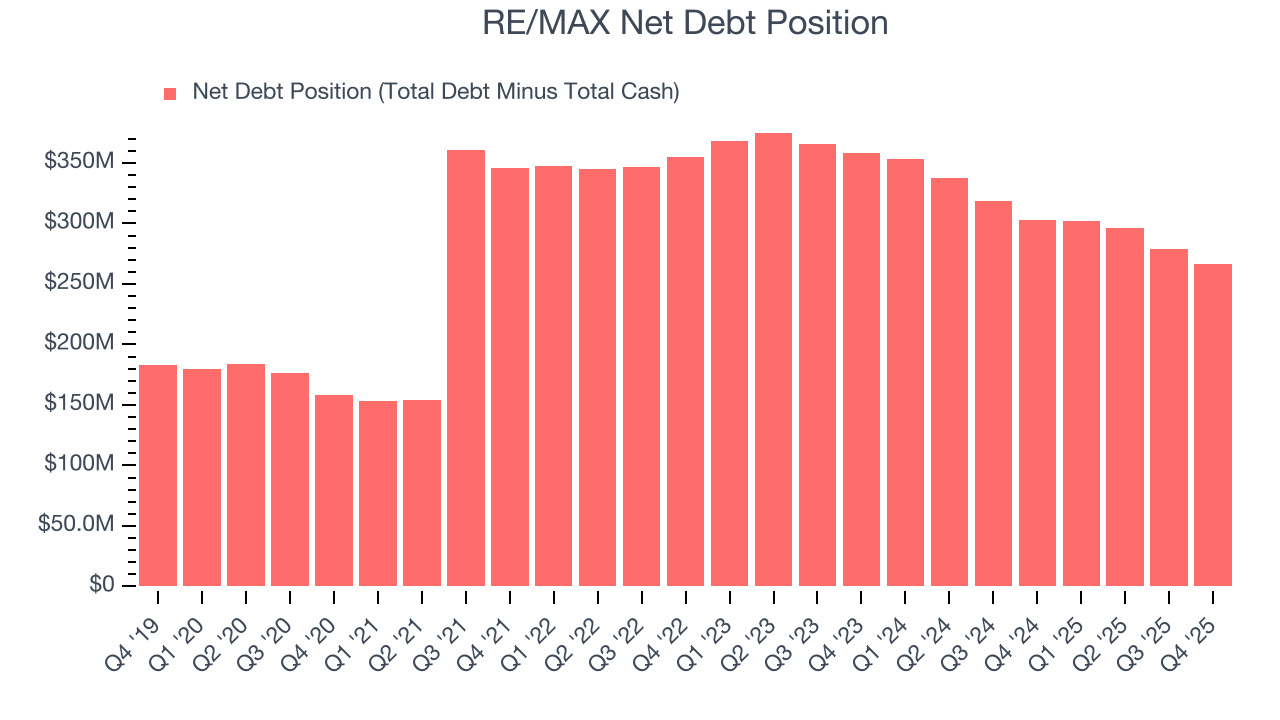
With $93.72 million of EBITDA over the last 12 months, we view RE/MAX’s 2.8× net-debt-to-EBITDA ratio as safe. We also see its $14.51 million of annual interest expenses as appropriate. The company’s profits give it plenty of breathing room, allowing it to continue investing in growth initiatives.
11. Key Takeaways from RE/MAX’s Q4 Results
It was encouraging to see RE/MAX beat analysts’ EBITDA expectations this quarter. We were also glad its EPS outperformed Wall Street’s estimates. On the other hand, its EBITDA guidance for next quarter missed and its revenue guidance for next quarter fell short of Wall Street’s estimates. Overall, this was a softer quarter. The stock traded down 2.6% to $6.76 immediately after reporting.
12. Is Now The Time To Buy RE/MAX?
Updated: March 17, 2026 at 10:57 PM EDT
Before deciding whether to buy RE/MAX or pass, we urge investors to consider business quality, valuation, and the latest quarterly results.
RE/MAX falls short of our quality standards. On top of that, RE/MAX’s number of agents has disappointed, and its Forecasted free cash flow margin suggests the company will ramp up its investments next year.
RE/MAX’s P/E ratio based on the next 12 months is 4.3x. While this valuation is optically cheap, the potential downside is huge given its shaky fundamentals. There are superior stocks to buy right now.
Wall Street analysts have a consensus one-year price target of $9 on the company (compared to the current share price of $6.05).
Although the price target is bullish, readers should exercise caution because analysts tend to be overly optimistic. The firms they work for, often big banks, have relationships with companies that extend into fundraising, M&A advisory, and other rewarding business lines. As a result, they typically hesitate to say bad things for fear they will lose out. We at StockStory do not suffer from such conflicts of interest, so we’ll always tell it like it is.