
Snap-on (SNA)
We’re wary of Snap-on. Its weak sales growth and declining returns on capital show its demand and profits are shrinking.― StockStory Analyst Team
1. News


2. Summary
Why We Think Snap-on Will Underperform
Founded in 1920, Snap-on (NYSE:SNA) is a global provider of tools, equipment, and diagnostics for various industries such as vehicle repair, aerospace, and the military.
- Core business is underperforming as its organic revenue has disappointed over the past two years, suggesting it might need acquisitions to stimulate growth
- Projected sales growth of 2.7% for the next 12 months suggests sluggish demand
- A silver lining is that its offerings are difficult to replicate at scale and lead to a best-in-class gross margin of 51.5%


Snap-on’s quality doesn’t meet our hurdle. There are better opportunities in the market.
Why There Are Better Opportunities Than Snap-on


Snap-on’s stock price of $367.52 implies a valuation ratio of 18.3x forward P/E. This multiple is lower than most industrials companies, but for good reason.
Our advice is to pay up for elite businesses whose advantages are tailwinds to earnings growth. Don’t get sucked into lower-quality businesses just because they seem like bargains. These mediocre businesses often never achieve a higher multiple as hoped, a phenomenon known as a “value trap”.
3. Snap-on (SNA) Research Report: Q4 CY2025 Update
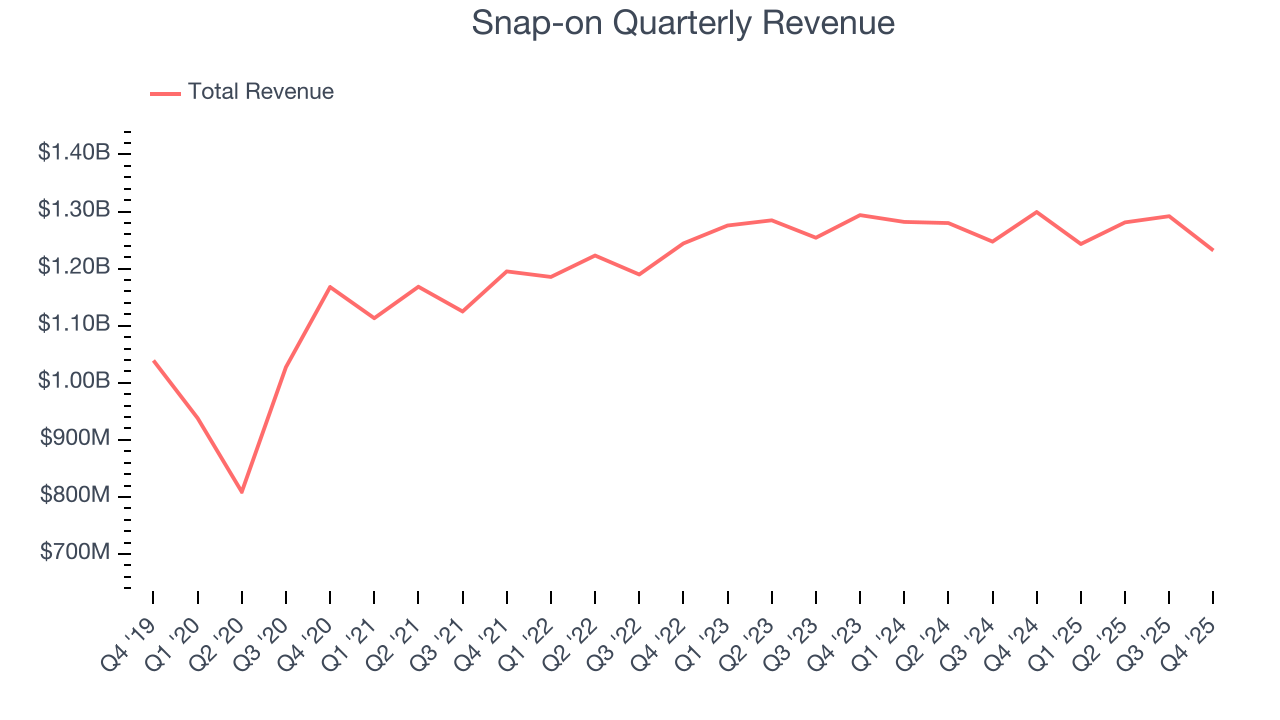
Professional tools and equipment manufacturer Snap-on (NYSE:SNA) missed Wall Street’s revenue expectations in Q4 CY2025, with sales falling 5.2% year on year to $1.23 billion. Its GAAP profit of $4.94 per share was in line with analysts’ consensus estimates.
Snap-on (SNA) Q4 CY2025 Highlights:
- Revenue: $1.23 billion vs analyst estimates of $1.33 billion (5.2% year-on-year decline, 7.1% miss)
- EPS (GAAP): $4.94 vs analyst expectations of $4.92 (in line)
- Operating Margin: 27.6%, up from 25.5% in the same quarter last year
- Free Cash Flow Margin: 20.7%, up from 19.2% in the same quarter last year
- Organic Revenue rose 1.4% year on year (beat)
- Market Capitalization: $19.91 billion
Company Overview
Founded in 1920, Snap-on (NYSE:SNA) is a global provider of tools, equipment, and diagnostics for various industries such as vehicle repair, aerospace, and the military.
Snap-on originally produced 10 sockets that conveniently "snapped on" to five interchangeable handles in transportation vehicles, embodying the company's slogan, "5 do the work of 50". Since then, it has broadened its customer base to include industrial manufacturers, the military, professional vehicle repair shops, and independent and OEM dealership service shops.
Snap-on's products range from automotive test equipment such as voltmeters and alternator testers to torque wrenches, which apply and measure the amount of torque needed to tighten fasteners for the automotive industry, and aviation snips, which are used for cutting and trimming sheet metal in the aerospace industry. Some of its popular brands include Blackhawk and Challenger.
The company utilizes a direct sales approach for a significant proportion of its shop equipment sales and diagnostic products. This strategy focuses on using its in-house sales team to establish accounts with OEMs, franchised dealers, and industrial customers.
Snap-on generates revenue through the sale and financing of its diverse range of tools, equipment, and diagnostics. Additionally, Snap-on enjoys recurring revenue from its aftermarket support services, consumable products, and replacement parts.
Lastly, a substantial amount of revenue is brought in via its mobile franchise van channel. These franchisees primarily serve vehicle repair technicians and service shop owners, providing weekly on-site visits with products on hand. Franchisees purchase products at a discounted rate from Snap-on and resell them at prices they establish, following a route of calls provided by the company.
4. Professional Tools and Equipment
Automation that increases efficiency and connected equipment that collects analyzable data have been trending, creating new demand. Some professional tools and equipment companies also provide software to accompany measurement or automated machinery, adding a stream of recurring revenues to their businesses. On the other hand, professional tools and equipment companies are at the whim of economic cycles. Consumer spending and interest rates, for example, can greatly impact the industrial production that drives demand for these companies’ offerings.
Competitors of Snap-on (NYSE:SNA) include Stanley Black & Decker (NYSE:SWK), Illinois Tool Works (NYSE:ITW), and private company Bosch.
5. Revenue Growth
Examining a company’s long-term performance can provide clues about its quality. Any business can have short-term success, but a top-tier one grows for years. Regrettably, Snap-on’s sales grew at a tepid 5.1% compounded annual growth rate over the last five years. This was below our standard for the industrials sector and is a rough starting point for our analysis.
Long-term growth is the most important, but within industrials, a half-decade historical view may miss new industry trends or demand cycles. Snap-on’s recent performance shows its demand has slowed as its revenue was flat over the last two years. 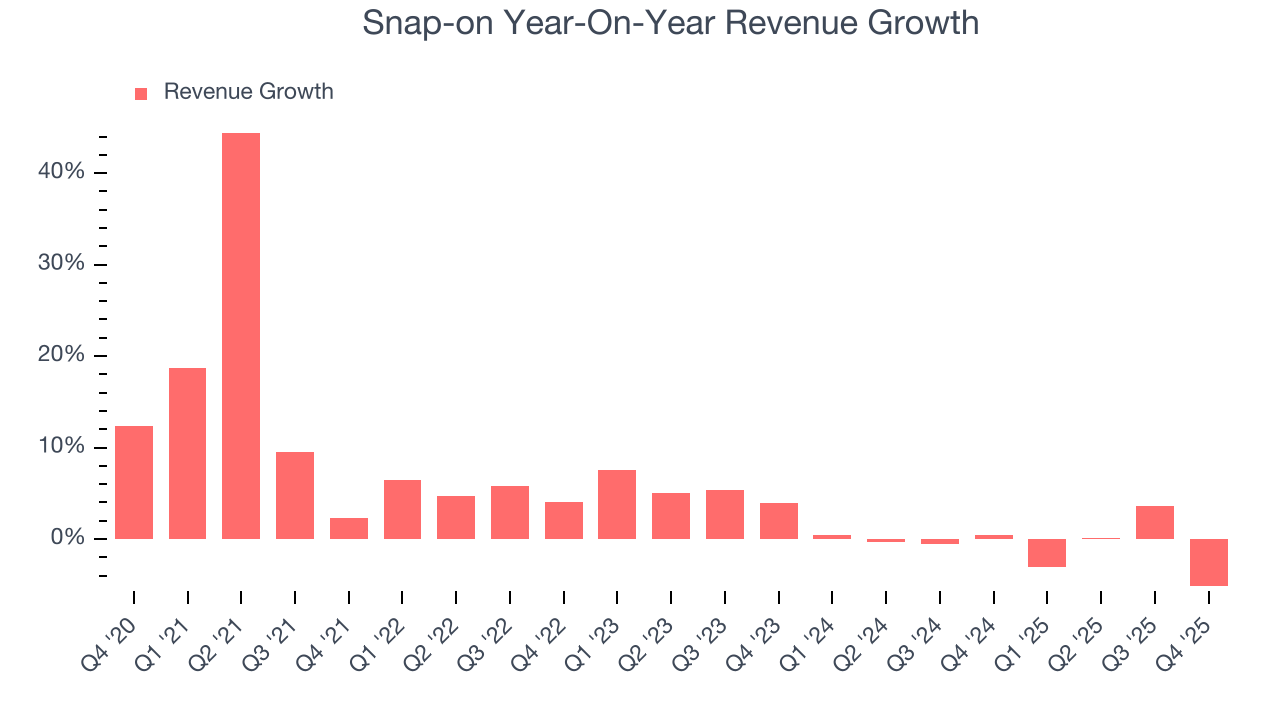
We can better understand the company’s sales dynamics by analyzing its organic revenue, which strips out one-time events like acquisitions and currency fluctuations that don’t accurately reflect its fundamentals. Over the last two years, Snap-on’s organic revenue averaged 2.8% year-on-year declines. Because this number is lower than its two-year revenue growth, we can see that some mixture of acquisitions and foreign exchange rates boosted its headline results. 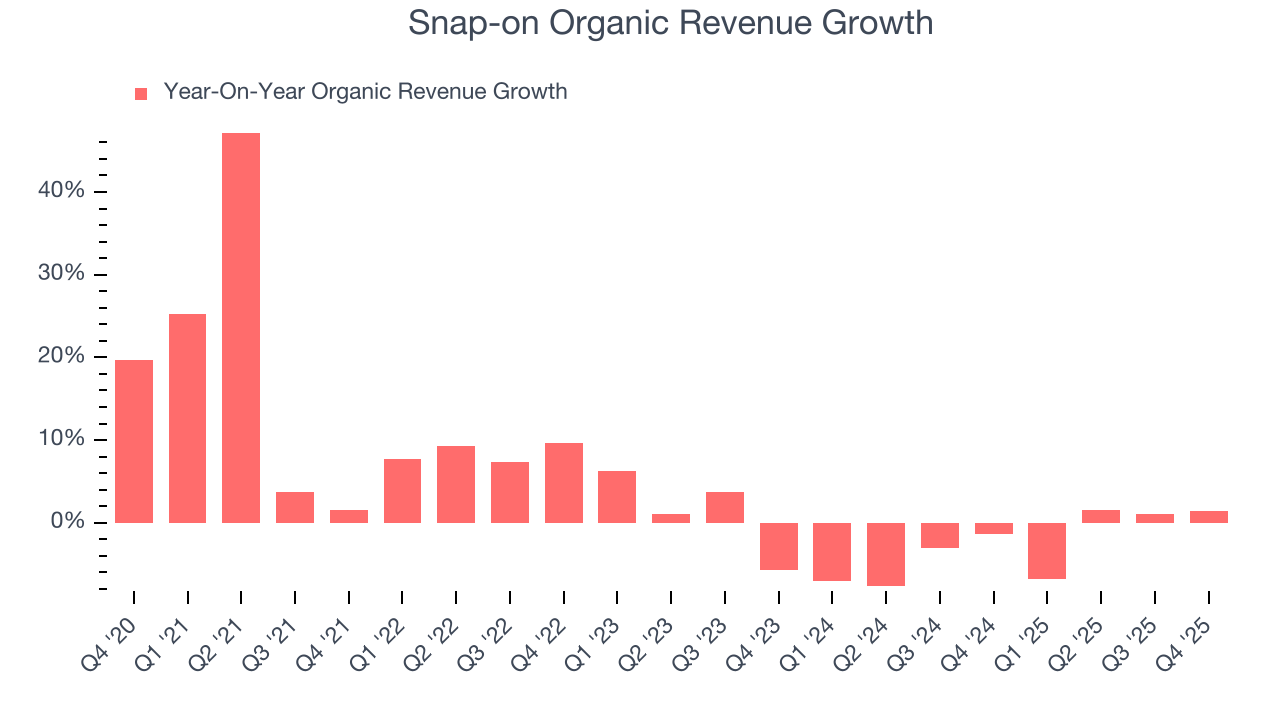
This quarter, Snap-on missed Wall Street’s estimates and reported a rather uninspiring 5.2% year-on-year revenue decline, generating $1.23 billion of revenue.
Looking ahead, sell-side analysts expect revenue to grow 5% over the next 12 months. While this projection indicates its newer products and services will spur better top-line performance, it is still below the sector average.
6. Gross Margin & Pricing Power
At StockStory, we prefer high gross margin businesses because they indicate the company has pricing power or differentiated products, giving it a chance to generate higher operating profits.
Snap-on has best-in-class unit economics for an industrials company, enabling it to invest in areas such as research and development. Its margin also signals it sells differentiated products, not commodities. As you can see below, it averaged an elite 51.4% gross margin over the last five years. That means Snap-on only paid its suppliers $48.61 for every $100 in revenue. 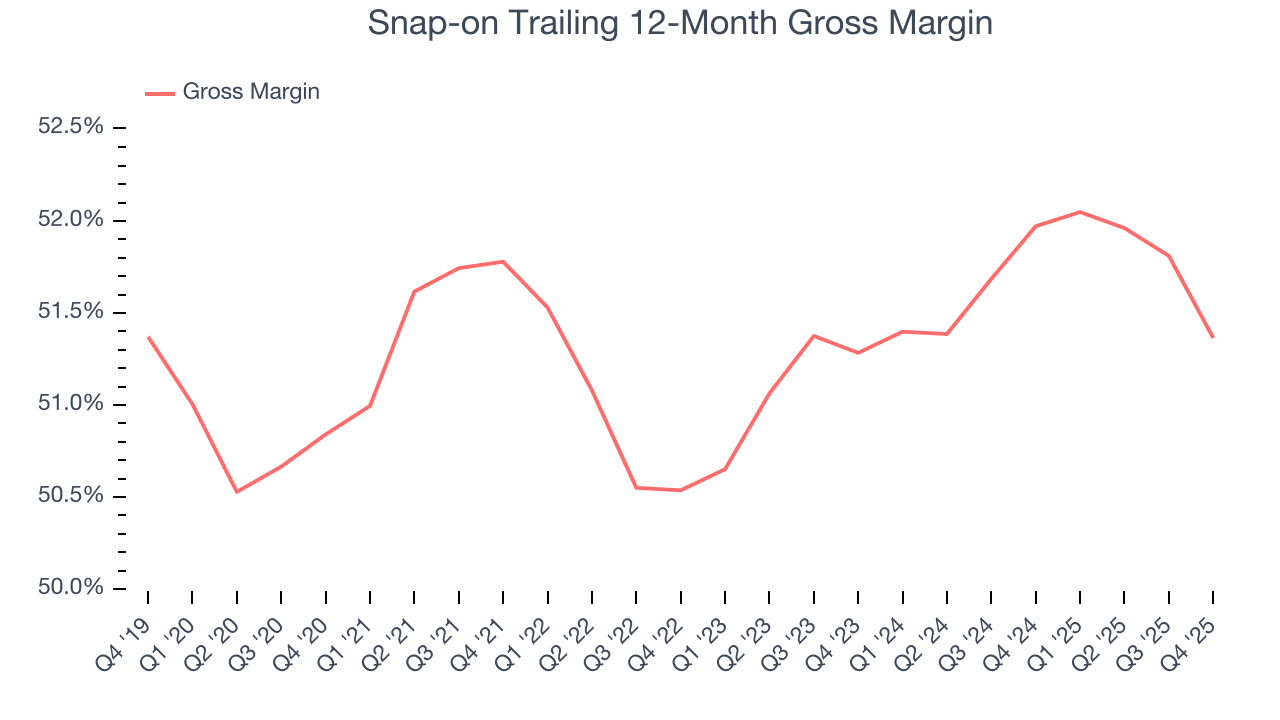
Snap-on’s gross profit margin came in at 49.2% this quarter, down 1.9 percentage points year on year. On a wider time horizon, the company’s full-year margin has remained steady over the past four quarters, suggesting its input costs (such as raw materials and manufacturing expenses) have been stable and it isn’t under pressure to lower prices.
7. Operating Margin
Operating margin is an important measure of profitability as it shows the portion of revenue left after accounting for all core expenses – everything from the cost of goods sold to advertising and wages. It’s also useful for comparing profitability across companies with different levels of debt and tax rates because it excludes interest and taxes.
Snap-on has been a well-oiled machine over the last five years. It demonstrated elite profitability for an industrials business, boasting an average operating margin of 25.6%. This result isn’t surprising as its high gross margin gives it a favorable starting point.
Looking at the trend in its profitability, Snap-on’s operating margin rose by 1.9 percentage points over the last five years, as its sales growth gave it operating leverage.
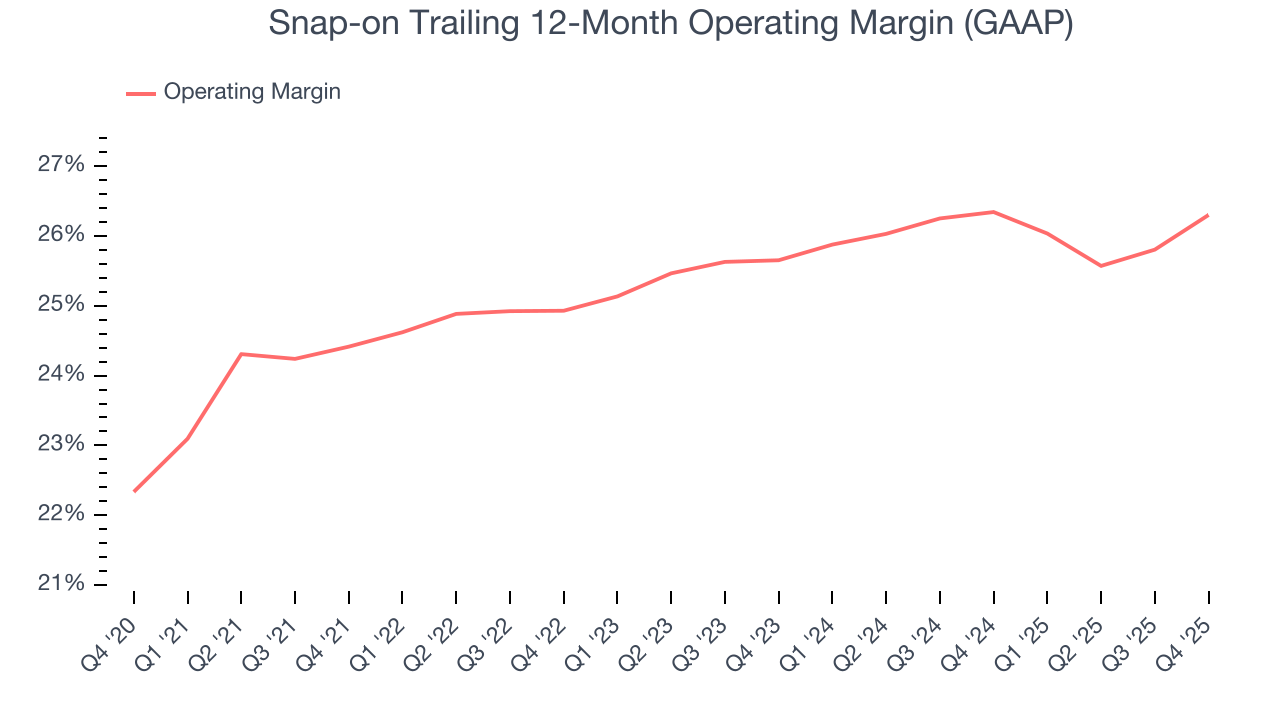
This quarter, Snap-on generated an operating margin profit margin of 27.6%, up 2 percentage points year on year. The increase was encouraging, and because its revenue and gross margin actually decreased, we can assume it was more efficient because it trimmed its operating expenses like marketing, R&D, and administrative overhead.
8. Earnings Per Share
We track the long-term change in earnings per share (EPS) for the same reason as long-term revenue growth. Compared to revenue, however, EPS highlights whether a company’s growth is profitable.
Snap-on’s EPS grew at a solid 10.9% compounded annual growth rate over the last five years, higher than its 5.1% annualized revenue growth. This tells us the company became more profitable on a per-share basis as it expanded.
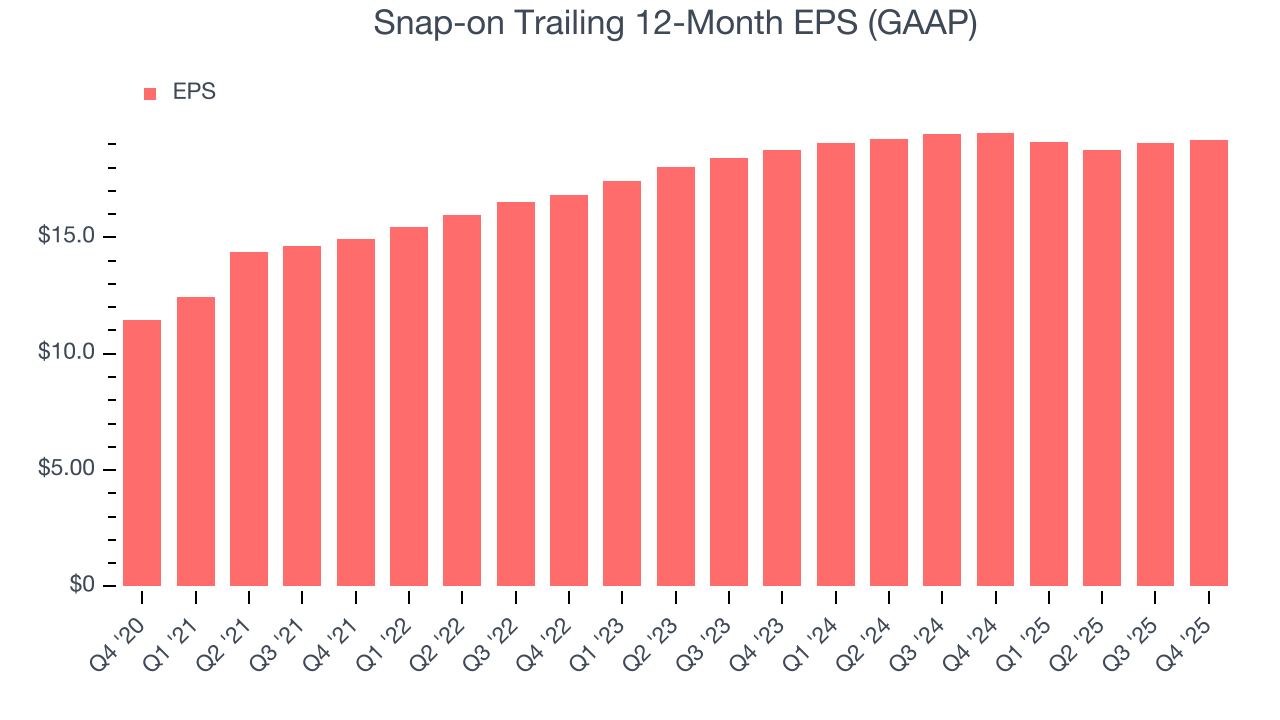
We can take a deeper look into Snap-on’s earnings to better understand the drivers of its performance. As we mentioned earlier, Snap-on’s operating margin expanded by 1.9 percentage points over the last five years. On top of that, its share count shrank by 3.5%. These are positive signs for shareholders because improving profitability and share buybacks turbocharge EPS growth relative to revenue growth. 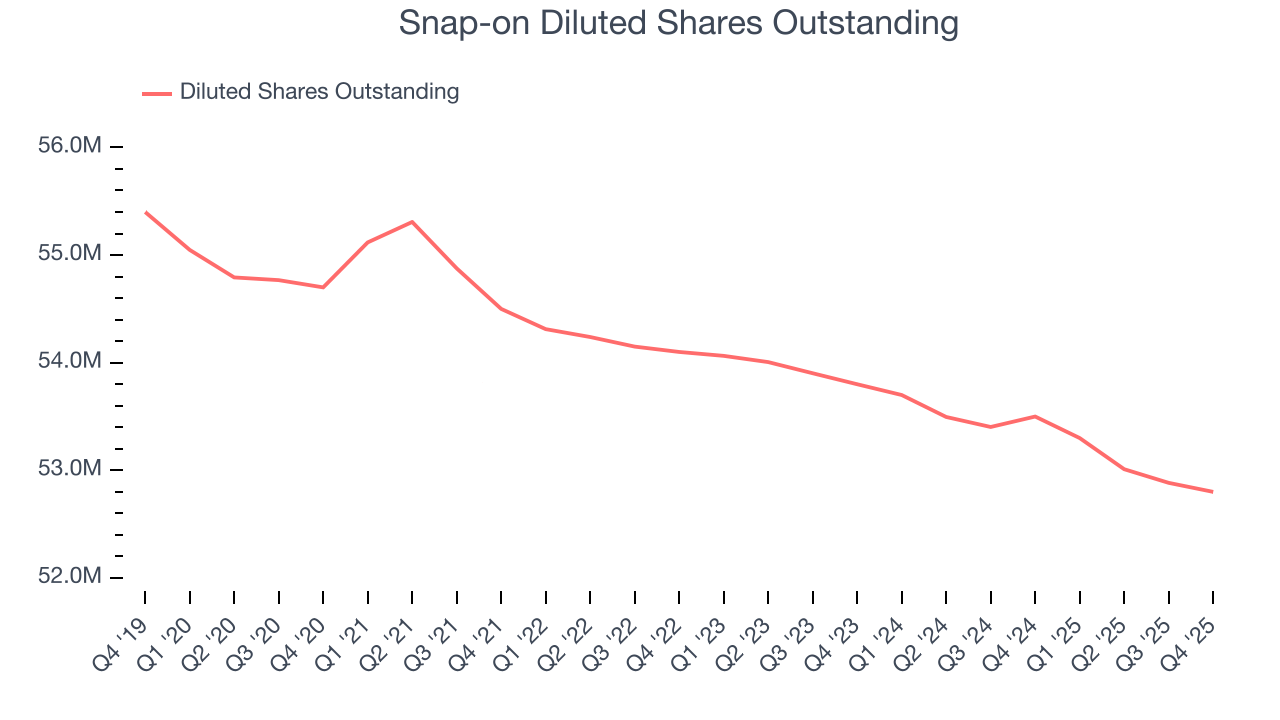
Like with revenue, we analyze EPS over a more recent period because it can provide insight into an emerging theme or development for the business.
For Snap-on, its two-year annual EPS growth of 1.2% was lower than its five-year trend. We hope its growth can accelerate in the future.
In Q4, Snap-on reported EPS of $4.94, up from $4.82 in the same quarter last year. This print was close to analysts’ estimates. Over the next 12 months, Wall Street expects Snap-on’s full-year EPS of $19.19 to grow 6.3%.
9. Cash Is King
Free cash flow isn't a prominently featured metric in company financials and earnings releases, but we think it's telling because it accounts for all operating and capital expenses, making it tough to manipulate. Cash is king.
Snap-on has shown terrific cash profitability, putting it in an advantageous position to invest in new products, return capital to investors, and consolidate the market during industry downturns. The company’s free cash flow margin was among the best in the industrials sector, averaging 16.9% over the last five years.
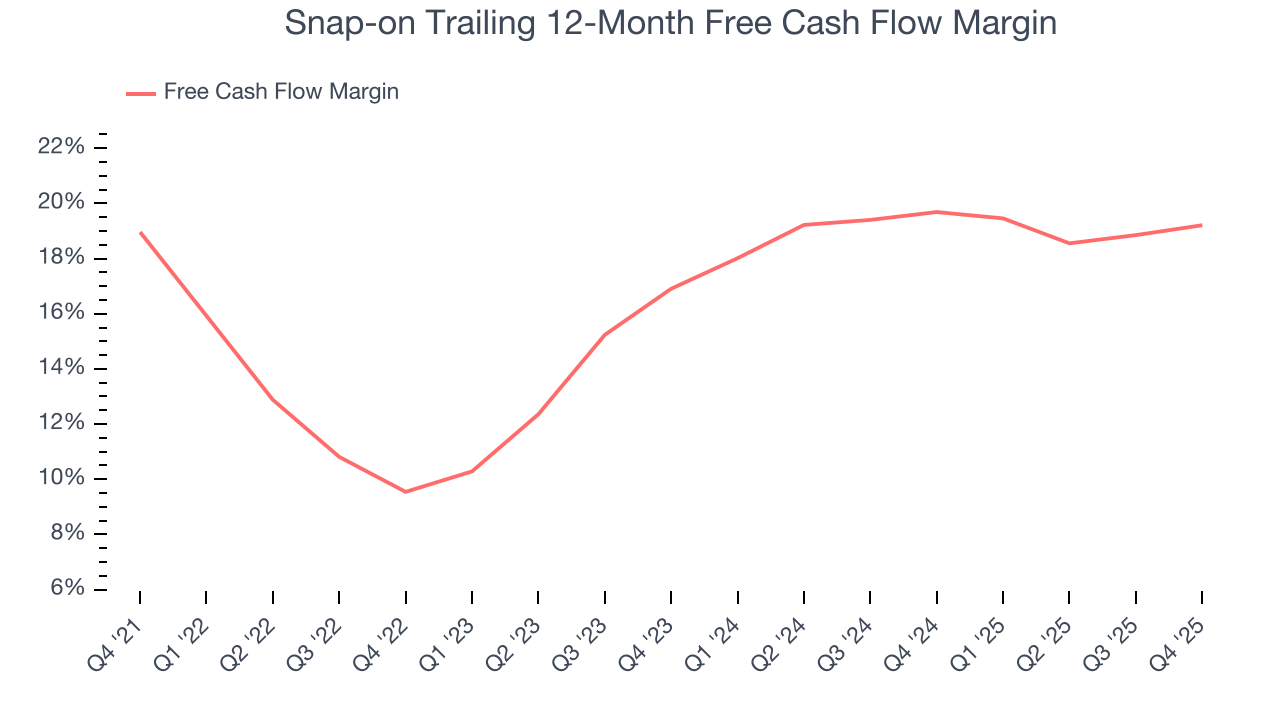
Snap-on’s free cash flow clocked in at $254.6 million in Q4, equivalent to a 20.7% margin. This result was good as its margin was 1.5 percentage points higher than in the same quarter last year, but we wouldn’t read too much into the short term because investment needs can be seasonal, causing temporary swings. Long-term trends are more important.
10. Return on Invested Capital (ROIC)
EPS and free cash flow tell us whether a company was profitable while growing its revenue. But was it capital-efficient? A company’s ROIC explains this by showing how much operating profit it makes compared to the money it has raised (debt and equity).
Although Snap-on hasn’t been the highest-quality company lately, it found a few growth initiatives in the past that worked out wonderfully. Its five-year average ROIC was 23.9%, splendid for an industrials business.
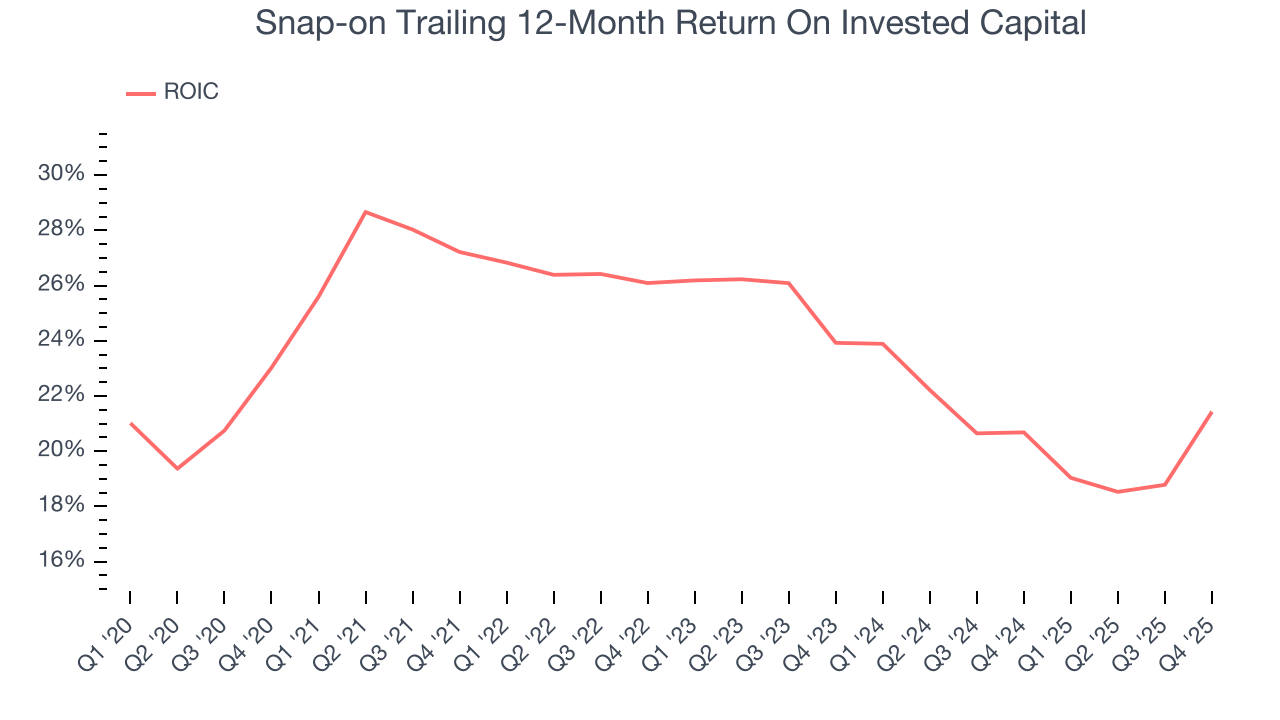
We like to invest in businesses with high returns, but the trend in a company’s ROIC is what often surprises the market and moves the stock price. Over the last few years, Snap-on’s ROIC has unfortunately decreased. We like what management has done in the past, but its declining returns are perhaps a symptom of fewer profitable growth opportunities.
11. Balance Sheet Assessment
Companies with more cash than debt have lower bankruptcy risk.
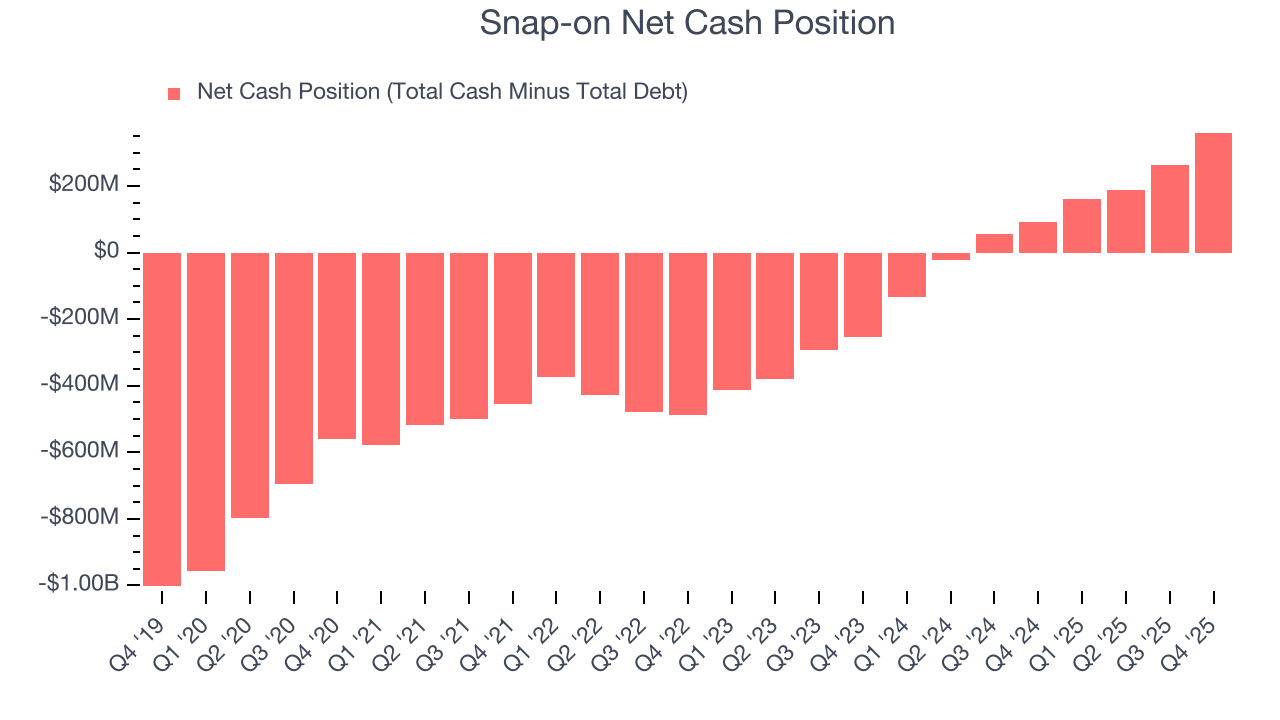
Snap-on is a profitable, well-capitalized company with $1.62 billion of cash and $1.26 billion of debt on its balance sheet. This $360.1 million net cash position gives it the freedom to borrow money, return capital to shareholders, or invest in growth initiatives. Leverage is not an issue here.
12. Key Takeaways from Snap-on’s Q4 Results
It was good to see Snap-on narrowly top analysts’ organic revenue expectations this quarter. On the other hand, its revenue missed. Overall, this was a softer quarter. The stock remained flat at $381.37 immediately after reporting.
13. Is Now The Time To Buy Snap-on?
Updated: March 13, 2026 at 11:05 PM EDT
The latest quarterly earnings matters, sure, but we actually think longer-term fundamentals and valuation matter more. Investors should consider all these pieces before deciding whether or not to invest in Snap-on.
Snap-on’s business quality ultimately falls short of our standards. To kick things off, its revenue growth was uninspiring over the last five years, and analysts expect its demand to deteriorate over the next 12 months. While its admirable gross margins indicate the mission-critical nature of its offerings, the downside is its diminishing returns show management's prior bets haven't worked out. On top of that, its organic revenue declined.
Snap-on’s P/E ratio based on the next 12 months is 18.3x. This valuation multiple is fair, but we don’t have much faith in the company. We're pretty confident there are more exciting stocks to buy at the moment.
Wall Street analysts have a consensus one-year price target of $376.44 on the company (compared to the current share price of $367.52).