Terex (TEX)
We’re skeptical of Terex. Its poor sales growth and falling returns on capital suggest its growth opportunities are shrinking.― StockStory Analyst Team
1. News


2. Summary
Why Terex Is Not Exciting
With humble beginnings as a dump truck company, Terex (NYSE:TEX) today manufactures lifting and material handling equipment designed to move and hoist heavy goods and materials.
- Gross margin of 20.5% is below its competitors, leaving less money to invest in areas like marketing and R&D
- Ability to fund investments or reward shareholders with increased buybacks or dividends is restricted by its weak free cash flow margin of 4.7% for the last five years
- On the plus side, its projected revenue growth of 45.2% for the next 12 months is above its two-year trend, pointing to accelerating demand


Terex’s quality doesn’t meet our expectations. We’re looking for better stocks elsewhere.
Why There Are Better Opportunities Than Terex


Terex is trading at $59.43 per share, or 12.4x forward P/E. Yes, this valuation multiple is lower than that of other industrials peers, but we’ll remind you that you often get what you pay for.
Cheap stocks can look like a great deal at first glance, but they can be value traps. They often have less earnings power, meaning there is more reliance on a re-rating to generate good returns - an unlikely scenario for low-quality companies.
3. Terex (TEX) Research Report: Q4 CY2025 Update
Lifting and material handling equipment company Terex (NYSE:TEX) reported revenue ahead of Wall Street’s expectations in Q4 CY2025, with sales up 6.2% year on year to $1.32 billion. The company’s full-year revenue guidance of $7.8 billion at the midpoint came in 40.1% above analysts’ estimates. Its GAAP profit of $0.95 per share was 4.6% below analysts’ consensus estimates.
Terex (TEX) Q4 CY2025 Highlights:
- Revenue: $1.32 billion vs analyst estimates of $1.31 billion (6.2% year-on-year growth, 0.8% beat)
- EPS (GAAP): $0.95 vs analyst expectations of $1.00 (4.6% miss)
- Adjusted EBITDA: $175 million vs analyst estimates of $176 million (13.3% margin, 0.6% miss)
- EPS (GAAP) guidance for the upcoming financial year 2026 is $4.75 at the midpoint, missing analyst estimates by 14.3%
- EBITDA guidance for the upcoming financial year 2026 is $965 million at the midpoint, above analyst estimates of $700 million
- Operating Margin: 10.4%, up from 4.3% in the same quarter last year
- Free Cash Flow Margin: 13%, up from 10.3% in the same quarter last year
- Market Capitalization: $6.72 billion
Company Overview
With humble beginnings as a dump truck company, Terex (NYSE:TEX) today manufactures lifting and material handling equipment designed to move and hoist heavy goods and materials.
The company designs and manufactures this equipment for the construction, warehousing, logistics, and manufacturing industries. Terex's products include a wide range of cranes. Tower cranes are used in commercial development, rough terrain cranes are used in forestry, and mobile cranes come into play when some agility at a site is needed. Additionally, the company sells aerial work platforms like scissor lifts and telehandler lifts, which are designed to help construction workers work or weld at on elevated surfaces.
Terex generates revenue through the sale of its equipment. The company counts construction companies, development, and logistics companies as major, longtime customers. It sells its products through a combination of direct sales and an international network of dealers and distributors.
Aside from product sales, Terex also generates revenue by supplying parts, services, and equipment maintenance and repair. These are smoother and more predictable sources of income for the company, as a macro downturn may dampen demand for cranes used in new construction but existing cranes will still need to be maintained.
4. Construction Machinery
Automation that increases efficiencies and connected equipment that collects analyzable data have been trending, creating new sales opportunities for construction machinery companies. On the other hand, construction machinery companies are at the whim of economic cycles. Interest rates, for example, can greatly impact the commercial and residential construction that drives demand for these companies’ offerings.
Companies competing against Terex include Caterpillar (NYSE:CAT), Komatsu (TYO:6201), and private company Liebherr Group.
5. Revenue Growth
A company’s long-term sales performance can indicate its overall quality. Any business can put up a good quarter or two, but the best consistently grow over the long haul. Thankfully, Terex’s 12% annualized revenue growth over the last five years was impressive. Its growth beat the average industrials company and shows its offerings resonate with customers.
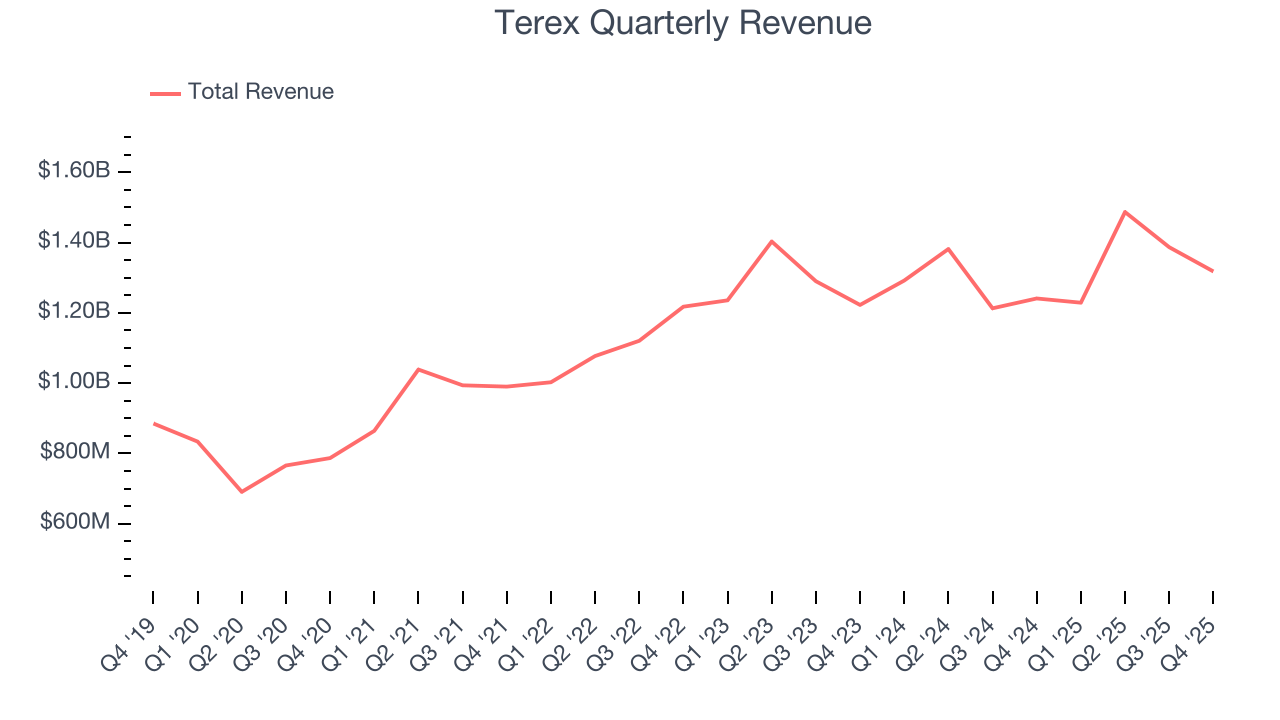
Long-term growth is the most important, but within industrials, a half-decade historical view may miss new industry trends or demand cycles. Terex’s recent performance shows its demand has slowed significantly as its annualized revenue growth of 2.6% over the last two years was well below its five-year trend. We also note many other Construction Machinery businesses have faced declining sales because of cyclical headwinds. While Terex grew slower than we’d like, it did do better than its peers. 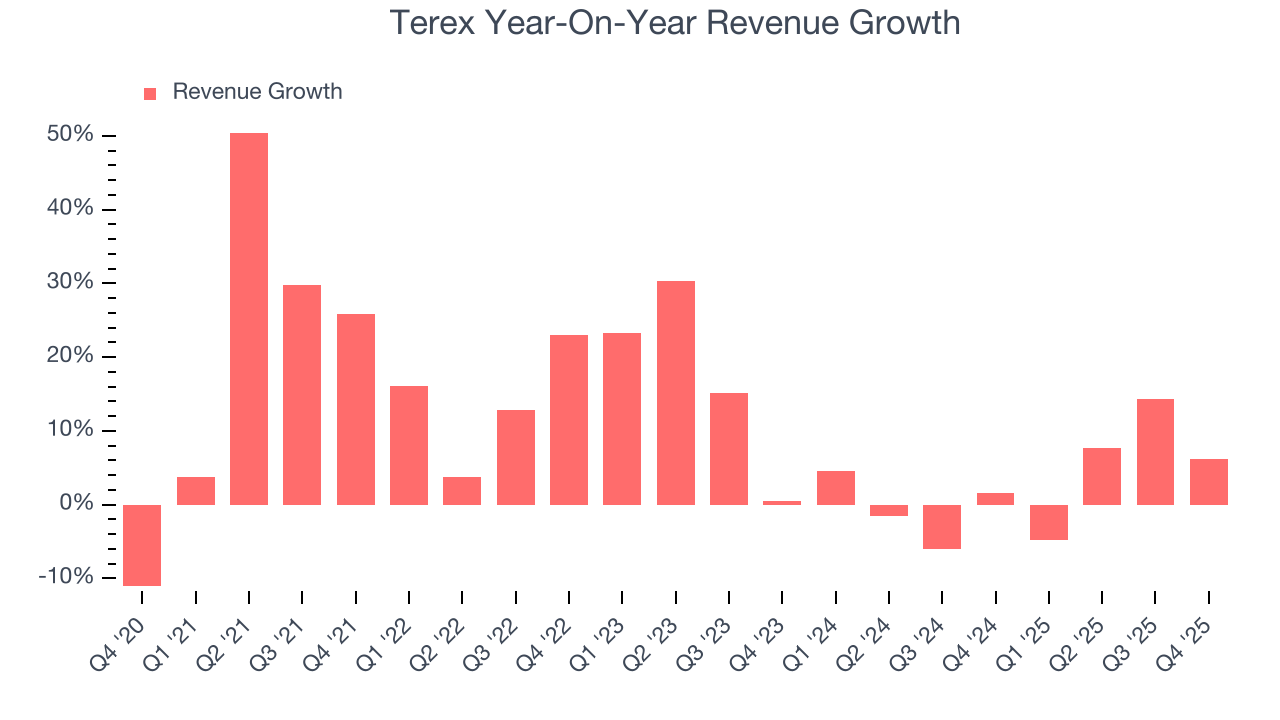
This quarter, Terex reported year-on-year revenue growth of 6.2%, and its $1.32 billion of revenue exceeded Wall Street’s estimates by 0.8%.
Looking ahead, sell-side analysts expect revenue to grow 3.1% over the next 12 months, similar to its two-year rate. This projection is underwhelming and suggests its newer products and services will not lead to better top-line performance yet.
6. Gross Margin & Pricing Power
Terex has bad unit economics for an industrials business, signaling it operates in a competitive market. As you can see below, it averaged a 20.5% gross margin over the last five years. Said differently, Terex had to pay a chunky $79.48 to its suppliers for every $100 in revenue. 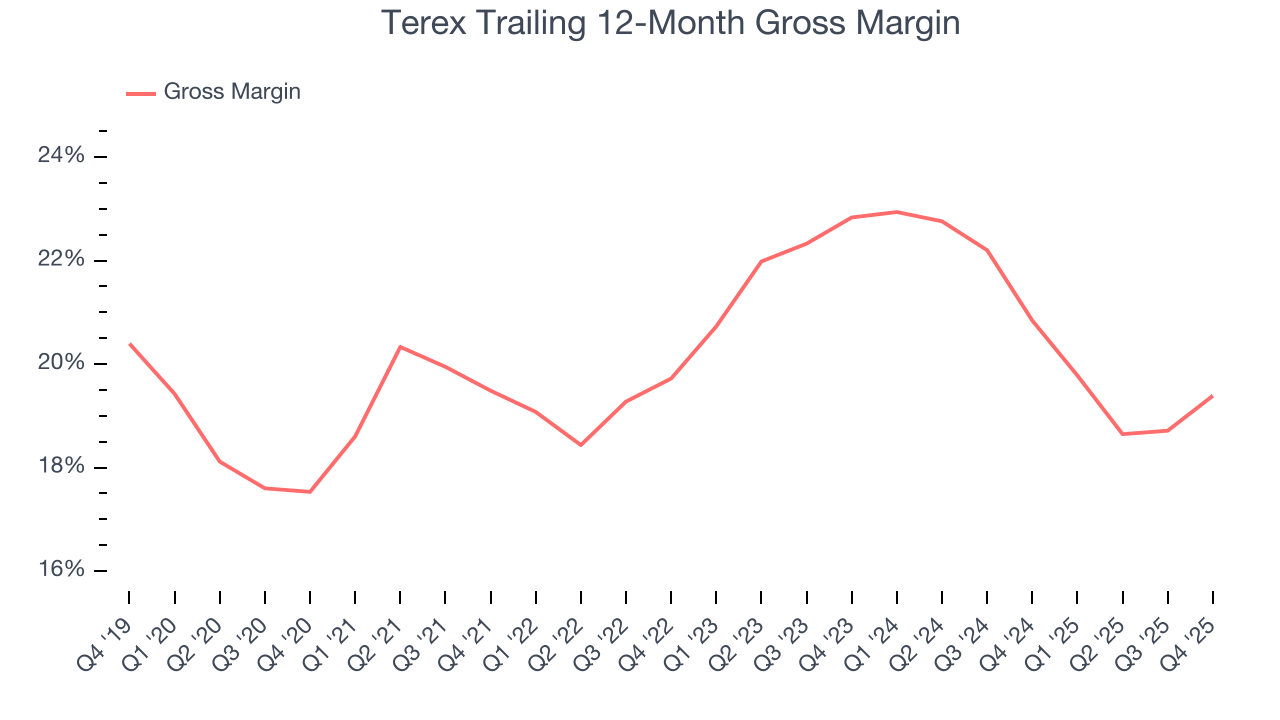
This quarter, Terex’s gross profit margin was 18.8%, up 2.9 percentage points year on year. On a wider time horizon, however, Terex’s full-year margin has been trending down over the past 12 months, decreasing by 1.5 percentage points. If this move continues, it could suggest a more competitive environment with some pressure to lower prices and higher input costs (such as raw materials and manufacturing expenses).
7. Operating Margin
Operating margin is an important measure of profitability as it shows the portion of revenue left after accounting for all core expenses – everything from the cost of goods sold to advertising and wages. It’s also useful for comparing profitability across companies with different levels of debt and tax rates because it excludes interest and taxes.
Terex’s operating margin might fluctuated slightly over the last 12 months but has remained more or less the same, averaging 9.9% over the last five years. This profitability was solid for an industrials business and shows it’s an efficient company that manages its expenses well. This result was particularly impressive because of its low gross margin, which is mostly a factor of what it sells and takes huge shifts to move meaningfully. Companies have more control over their operating margins, and it’s a show of well-managed operations if they’re high when gross margins are low.
Looking at the trend in its profitability, Terex’s operating margin might fluctuated slightly but has generally stayed the same over the last five years. This raises questions about the company’s expense base because its revenue growth should have given it leverage on its fixed costs, resulting in better economies of scale and profitability.
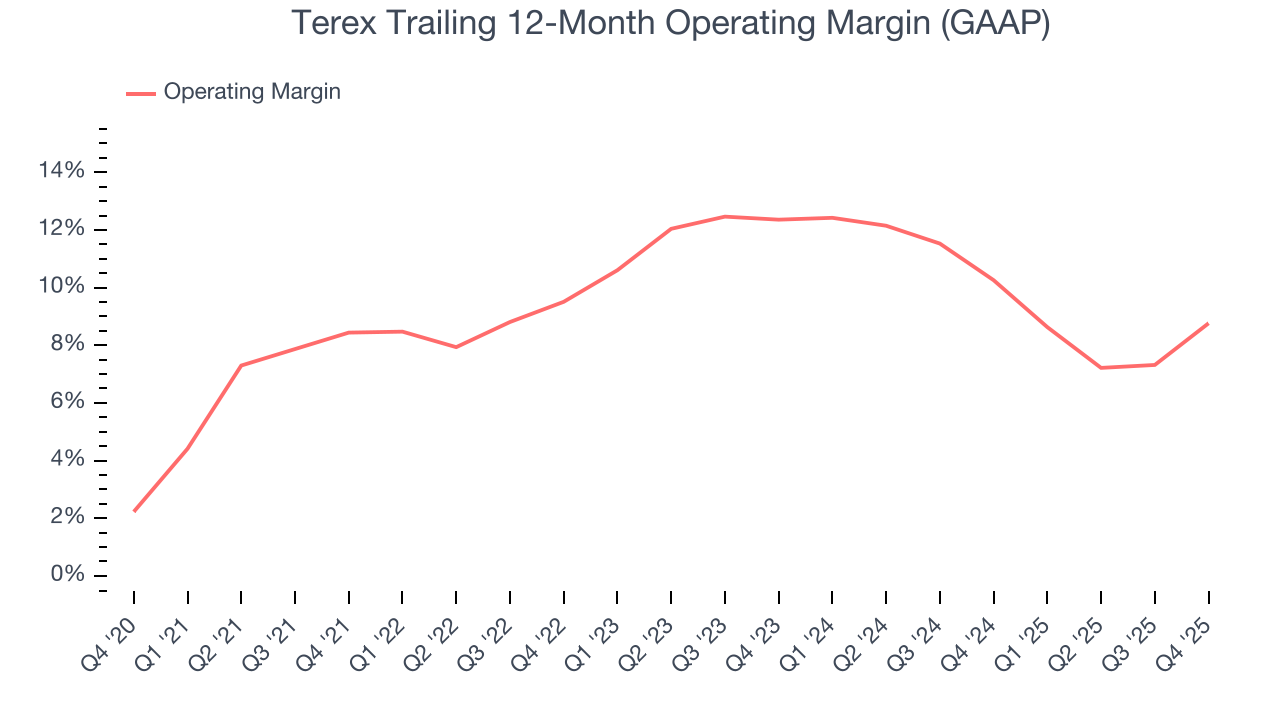
This quarter, Terex generated an operating margin profit margin of 10.4%, up 6.1 percentage points year on year. The increase was solid, and because its operating margin rose more than its gross margin, we can infer it was more efficient with expenses such as marketing, R&D, and administrative overhead.
8. Earnings Per Share
Revenue trends explain a company’s historical growth, but the long-term change in earnings per share (EPS) points to the profitability of that growth – for example, a company could inflate its sales through excessive spending on advertising and promotions.
Terex’s full-year EPS flipped from negative to positive over the last five years. This is encouraging and shows it’s at a critical moment in its life.
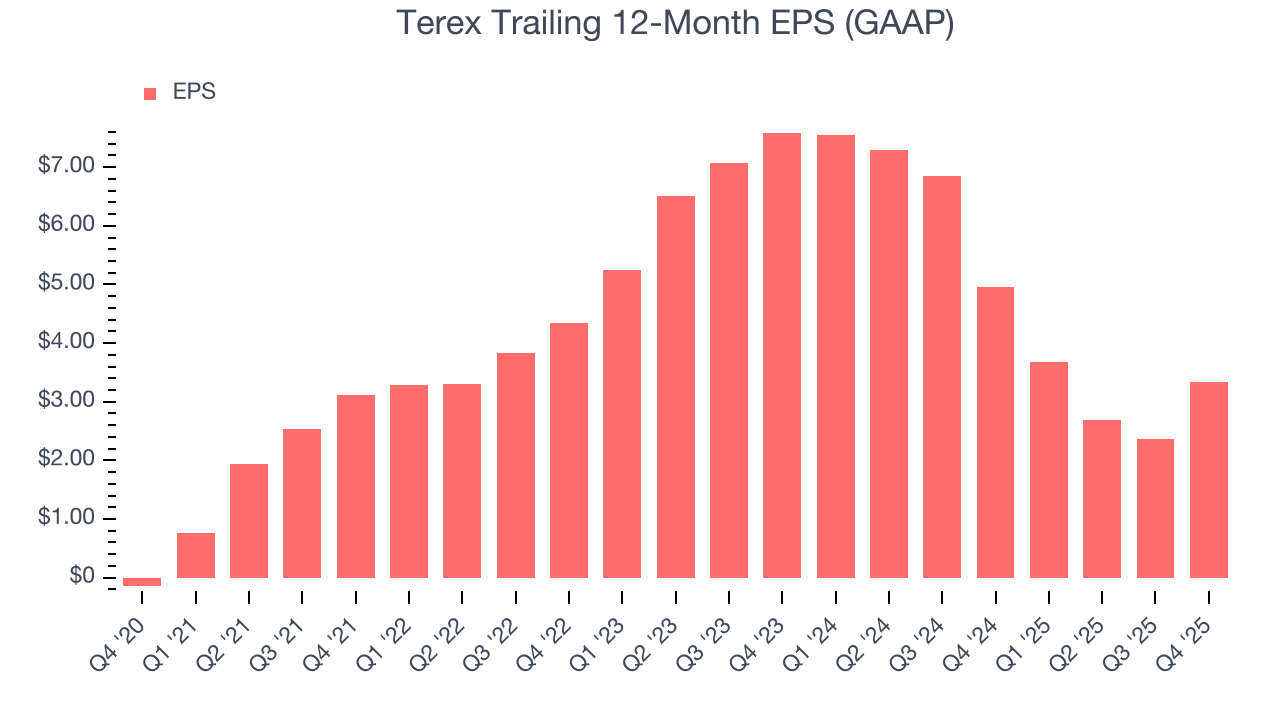
Like with revenue, we analyze EPS over a more recent period because it can provide insight into an emerging theme or development for the business.
Sadly for Terex, its EPS declined by 33.7% annually over the last two years while its revenue grew by 2.6%. This tells us the company became less profitable on a per-share basis as it expanded.
In Q4, Terex reported EPS of $0.95, up from negative $0.03 in the same quarter last year. Despite growing year on year, this print missed analysts’ estimates, but we care more about long-term EPS growth than short-term movements. Over the next 12 months, Wall Street expects Terex’s full-year EPS of $3.34 to grow 61.9%.
9. Cash Is King
Although earnings are undoubtedly valuable for assessing company performance, we believe cash is king because you can’t use accounting profits to pay the bills.
Terex has shown weak cash profitability over the last five years, giving the company limited opportunities to return capital to shareholders. Its free cash flow margin averaged 4.7%, subpar for an industrials business. The divergence from its good operating margin stems from its capital-intensive business model, which requires Terex to make large cash investments in working capital and capital expenditures.
Taking a step back, an encouraging sign is that Terex’s margin expanded by 2.3 percentage points during that time. The company’s improvement shows it’s heading in the right direction, and we can see it became a less capital-intensive business because its free cash flow profitability rose while its operating profitability was flat.
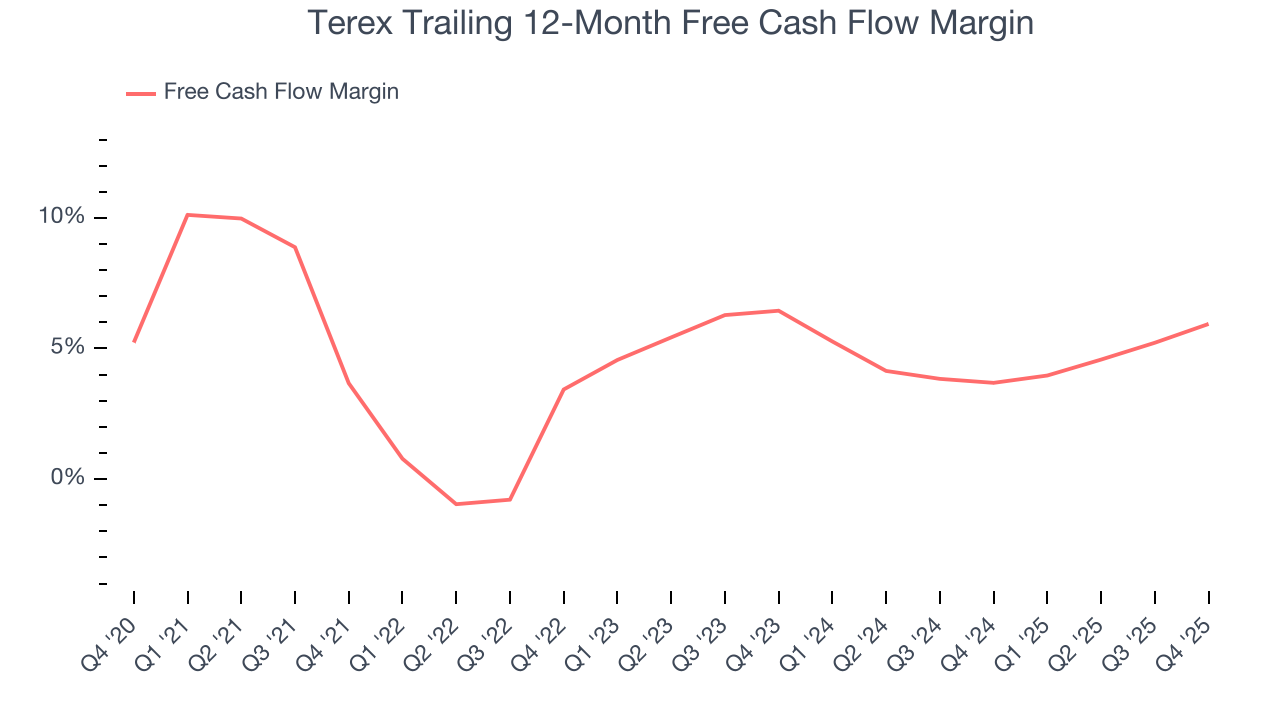
Terex’s free cash flow clocked in at $171 million in Q4, equivalent to a 13% margin. This result was good as its margin was 2.7 percentage points higher than in the same quarter last year, building on its favorable historical trend.
10. Return on Invested Capital (ROIC)
EPS and free cash flow tell us whether a company was profitable while growing its revenue. But was it capital-efficient? Enter ROIC, a metric showing how much operating profit a company generates relative to the money it has raised (debt and equity).
Although Terex hasn’t been the highest-quality company lately, it found a few growth initiatives in the past that worked out wonderfully. Its five-year average ROIC was 19.4%, splendid for an industrials business.
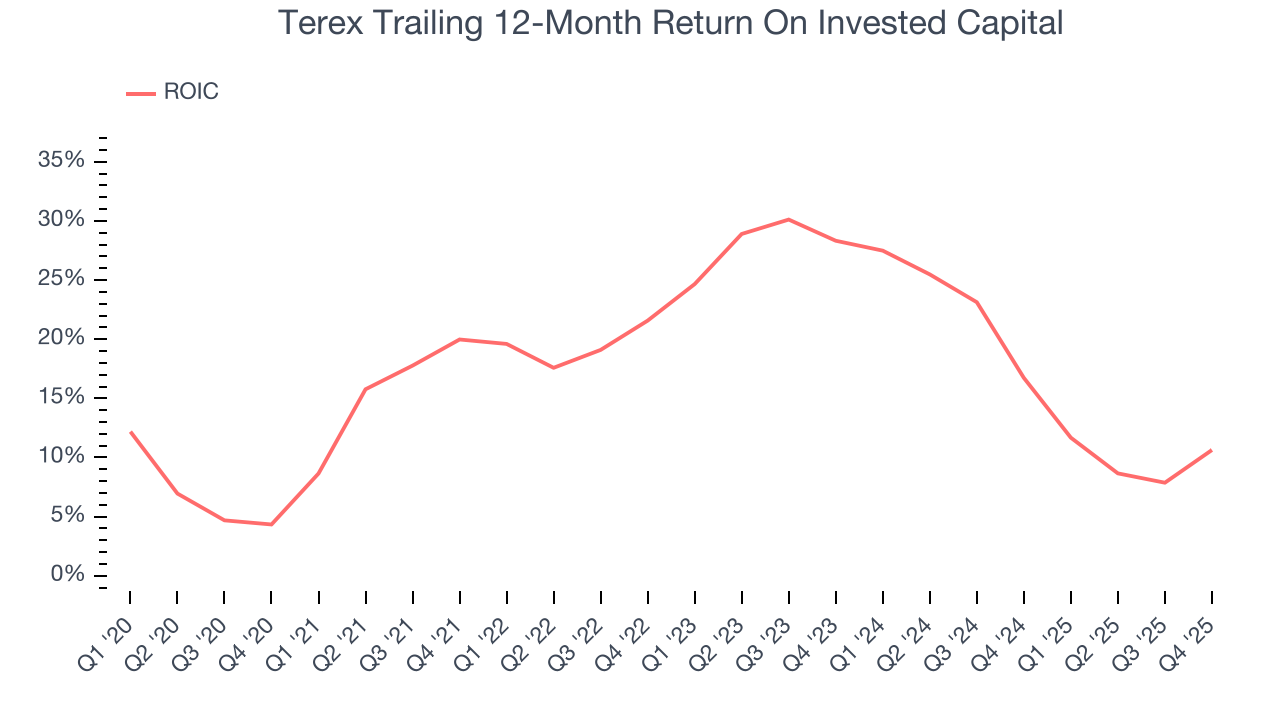
We like to invest in businesses with high returns, but the trend in a company’s ROIC is what often surprises the market and moves the stock price. Unfortunately, Terex’s ROIC has decreased over the last few years. We like what management has done in the past, but its declining returns are perhaps a symptom of fewer profitable growth opportunities.
11. Balance Sheet Assessment
Terex reported $772 million of cash and $2.58 billion of debt on its balance sheet in the most recent quarter. As investors in high-quality companies, we primarily focus on two things: 1) that a company’s debt level isn’t too high and 2) that its interest payments are not excessively burdening the business.
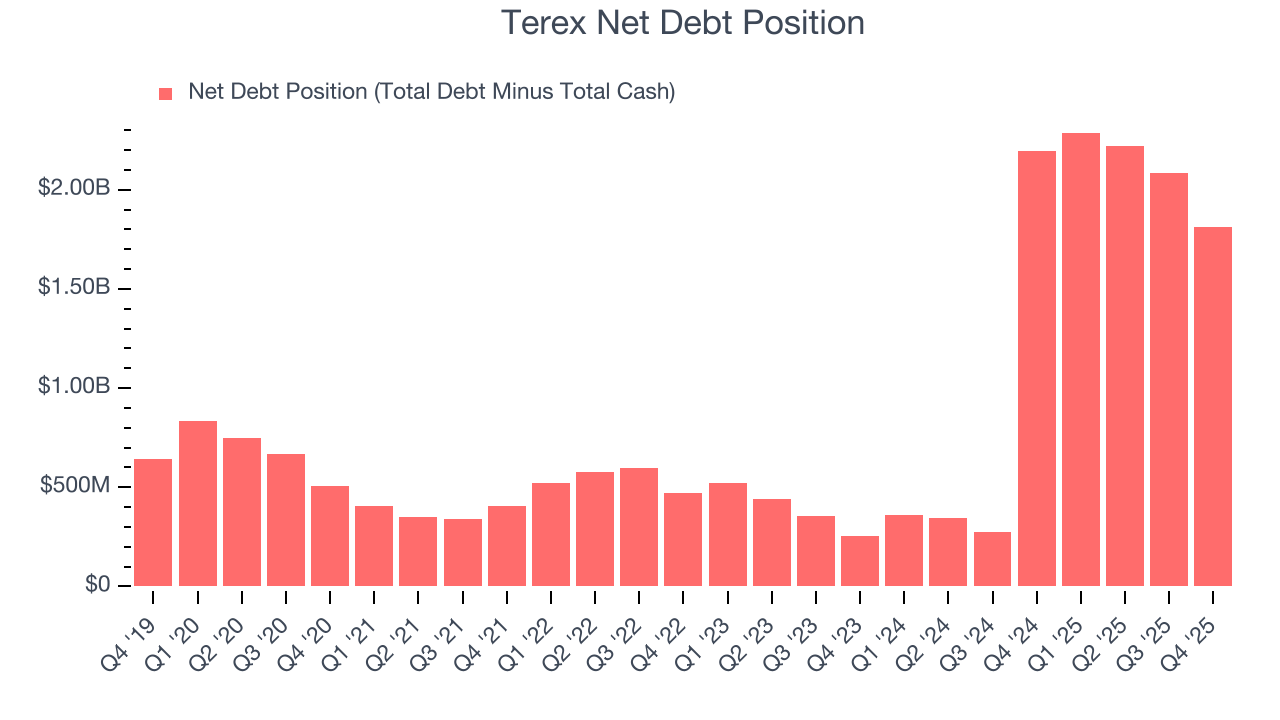
With $671 million of EBITDA over the last 12 months, we view Terex’s 2.7× net-debt-to-EBITDA ratio as safe. We also see its $85 million of annual interest expenses as appropriate. The company’s profits give it plenty of breathing room, allowing it to continue investing in growth initiatives.
12. Key Takeaways from Terex’s Q4 Results
We were impressed by Terex’s optimistic full-year EBITDA guidance, which blew past analysts’ expectations. We were also glad its full-year revenue guidance trumped Wall Street’s estimates. On the other hand, its EPS missed and its EBITDA fell slightly short of Wall Street’s estimates. Overall, we think this was a mixed quarter. The stock remained flat at $59.76 immediately after reporting.
13. Is Now The Time To Buy Terex?
Updated: March 16, 2026 at 11:16 PM EDT
When considering an investment in Terex, investors should account for its valuation and business qualities as well as what’s happened in the latest quarter.
Terex isn’t a terrible business, but it doesn’t pass our quality test. Although its revenue growth was impressive over the last five years and is expected to accelerate over the next 12 months, its diminishing returns show management's prior bets haven't worked out. And while the company’s astounding EPS growth over the last five years shows its profits are trickling down to shareholders, the downside is its low gross margins indicate some combination of competitive pressures and high production costs.
Terex’s P/E ratio based on the next 12 months is 12.3x. This valuation is reasonable, but the company’s shakier fundamentals present too much downside risk. We're pretty confident there are superior stocks to buy right now.
Wall Street analysts have a consensus one-year price target of $78.77 on the company (compared to the current share price of $59.35).
Although the price target is bullish, readers should exercise caution because analysts tend to be overly optimistic. The firms they work for, often big banks, have relationships with companies that extend into fundraising, M&A advisory, and other rewarding business lines. As a result, they typically hesitate to say bad things for fear they will lose out. We at StockStory do not suffer from such conflicts of interest, so we’ll always tell it like it is.