
Trinity (TRN)
We’re skeptical of Trinity. Its weak sales growth and declining returns on capital show its demand and profits are shrinking.― StockStory Analyst Team
1. News


2. Summary
Why We Think Trinity Will Underperform
Operating under the trade name TrinityRail, Trinity (NYSE:TRN) is a provider of railcar products and services in North America.
- Projected sales for the next 12 months are flat and suggest demand will be subdued
- Cash-burning history makes us doubt the long-term viability of its business model
- The good news is that its earnings per share have outperformed its peers over the last five years, increasing by 34% annually


Trinity doesn’t check our boxes. We believe there are better businesses elsewhere.
Why There Are Better Opportunities Than Trinity


At $31.20 per share, Trinity trades at 1.2x trailing 12-month price-to-sales. The market typically values companies like Trinity based on their anticipated profits for the next 12 months, but there aren’t enough published estimates to arrive at a reliable number. You should avoid this stock for now - better opportunities lie elsewhere.
We’d rather invest in companies with elite fundamentals than questionable ones with open questions and big downside risks. The durable earnings power of high-quality businesses helps us sleep well at night.
3. Trinity (TRN) Research Report: Q4 CY2025 Update
Railcar products and services provider Trinity (NYSE:TRN) reported Q4 CY2025 results topping the market’s revenue expectations, but sales fell by 2.9% year on year to $611.2 million. Its GAAP profit of $2.28 per share was in line with analysts’ consensus estimates.
Trinity (TRN) Q4 CY2025 Highlights:
- Revenue: $611.2 million vs analyst estimates of $570.5 million (2.9% year-on-year decline, 7.1% beat)
- EPS (GAAP): $2.28 vs analyst estimates of $2.28 (in line)
- Adjusted EBITDA: $417.1 million vs analyst estimates of $393.8 million (68.2% margin, 5.9% beat)
- EPS (GAAP) guidance for the upcoming financial year 2026 is $1.98 at the midpoint, beating analyst estimates by 23.4%
- Operating Margin: 54.9%, up from 14.7% in the same quarter last year
- Free Cash Flow was -$60.4 million compared to -$21.6 million in the same quarter last year
- Backlog: $1.7 billion at quarter end, down 19% year on year
- Market Capitalization: $2.54 billion
Company Overview
Operating under the trade name TrinityRail, Trinity (NYSE:TRN) is a provider of railcar products and services in North America.
The company's business is structured into two primary segments: the Railcar Leasing and Management Services Group and the Rail Products Group. The Railcar Leasing and Management Services Group offers operating leases for freight and tank railcars, as well as fleet maintenance and management services. Trinity's leasing business has partnerships with third-party investors through railcar investment vehicles, which generate additional fee income. The company has positioned itself at the forefront of the rail industry's digital transformation by offering digital and terminal management services aimed at improving supply chain efficiency and visibility.
Trinity's lease fleet serves various industries including refined products and chemicals, energy, agriculture, construction and metals, and consumer products. The Rail Products Group is a leading manufacturer of freight and tank railcars in North America, with facilities in both the United States and Mexico. This segment's capabilities extend beyond new railcar production to include a sustainable railcar conversion program, allowing the company to adapt existing railcars to meet changing market demands. The group also offers a full range of maintenance services, field inspections, and parts manufacturing and distribution, further enhancing Trinity's value proposition to customers.
Trinity's revenue structure has the leasing business, which provides a steady stream of rental income, while the manufacturing segment generates revenue through the sale of new railcars and related products. Additional revenue comes from maintenance services, parts sales, and fees from fleet management services.
4. Heavy Transportation Equipment
Heavy transportation equipment companies are investing in automated vehicles that increase efficiencies and connected machinery that collects actionable data. Some are also developing electric vehicles and mobility solutions to address customers’ concerns about carbon emissions, creating new sales opportunities. Additionally, they are increasingly offering automated equipment that increases efficiencies and connected machinery that collects actionable data. On the other hand, heavy transportation equipment companies are at the whim of economic cycles. Interest rates, for example, can greatly impact the construction and transport volumes that drive demand for these companies’ offerings.
Competitors of Trinity industries include Greenbrier (NYSE:GBX), FreightCar America (NASDAQ:RAIL), and private company American Railcar Industries (now part of ITE Management).
5. Revenue Growth
A company’s long-term sales performance is one signal of its overall quality. Any business can put up a good quarter or two, but many enduring ones grow for years. Unfortunately, Trinity’s 4.3% annualized revenue growth over the last five years was sluggish. This was below our standard for the industrials sector and is a poor baseline for our analysis.
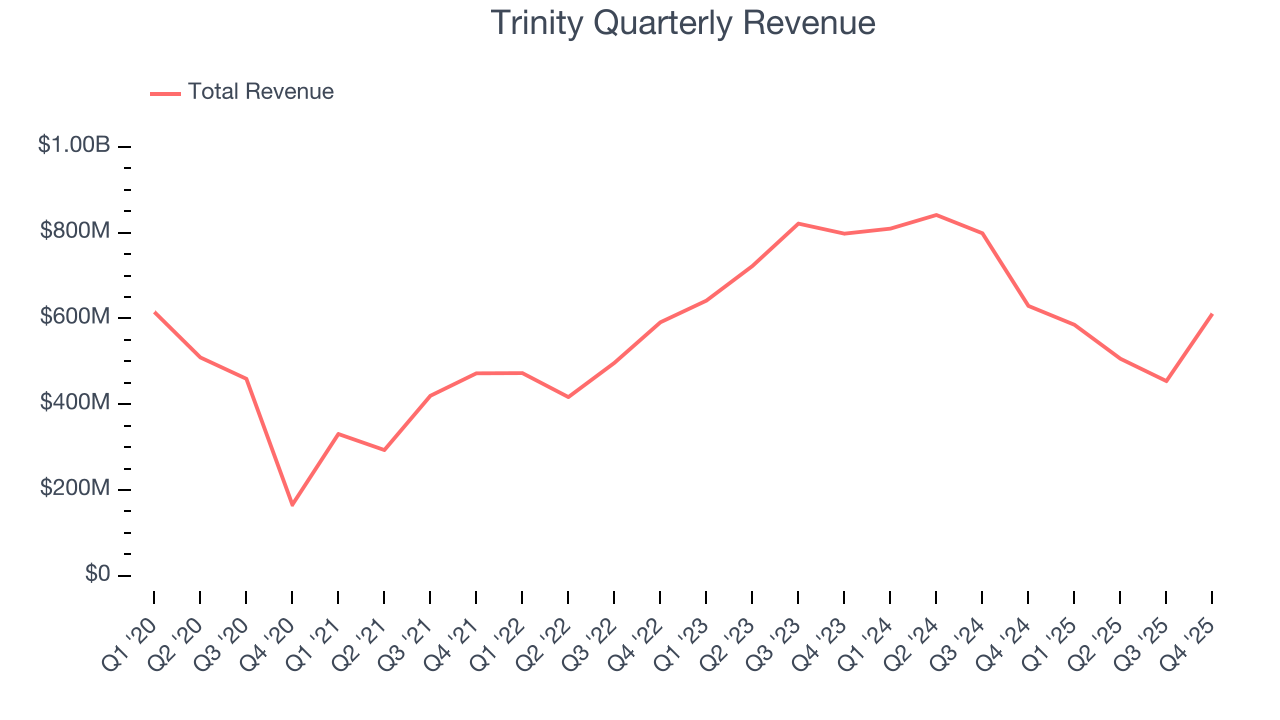
We at StockStory place the most emphasis on long-term growth, but within industrials, a half-decade historical view may miss cycles, industry trends, or a company capitalizing on catalysts such as a new contract win or a successful product line. Trinity’s performance shows it grew in the past but relinquished its gains over the last two years, as its revenue fell by 15% annually. Trinity isn’t alone in its struggles as the Heavy Transportation Equipment industry experienced a cyclical downturn, with many similar businesses observing lower sales at this time. 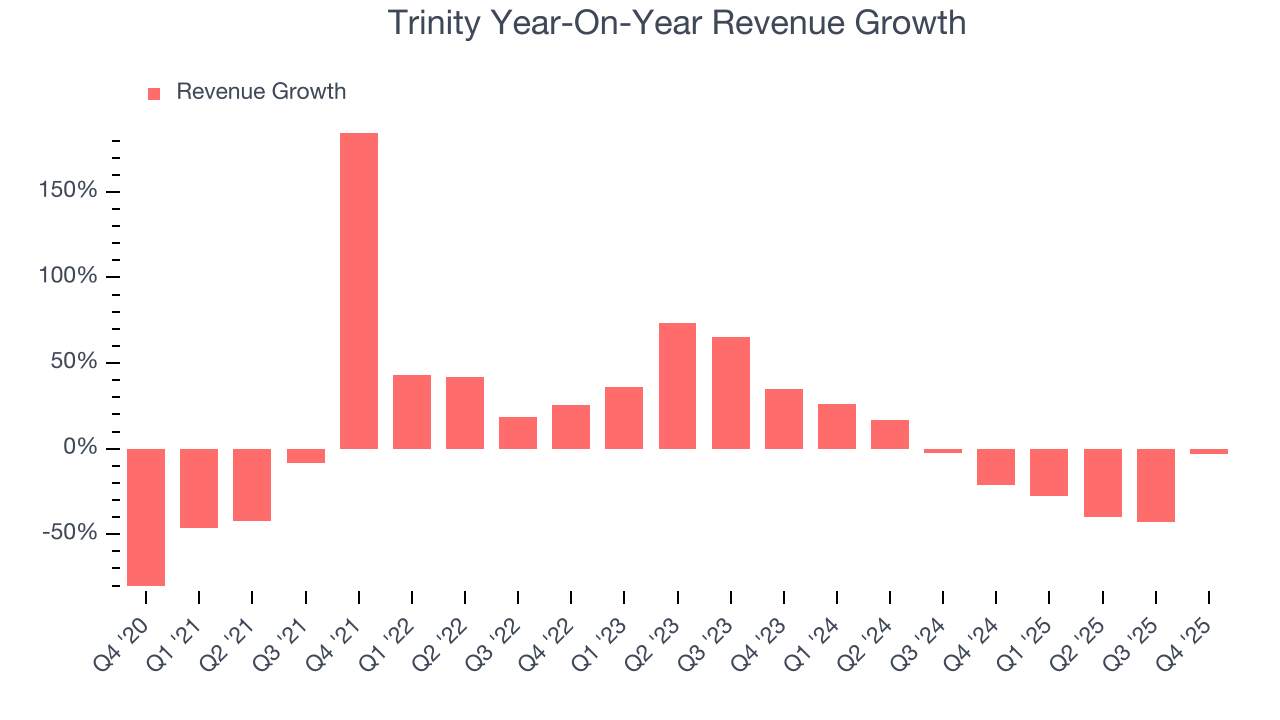
We can better understand the company’s revenue dynamics by analyzing its backlog, or the value of its outstanding orders that have not yet been executed or delivered. Trinity’s backlog reached $1.7 billion in the latest quarter and averaged 27.8% year-on-year declines over the last two years. Because this number is lower than its revenue growth, we can see the company hasn’t secured enough new orders to maintain its growth rate in the future. 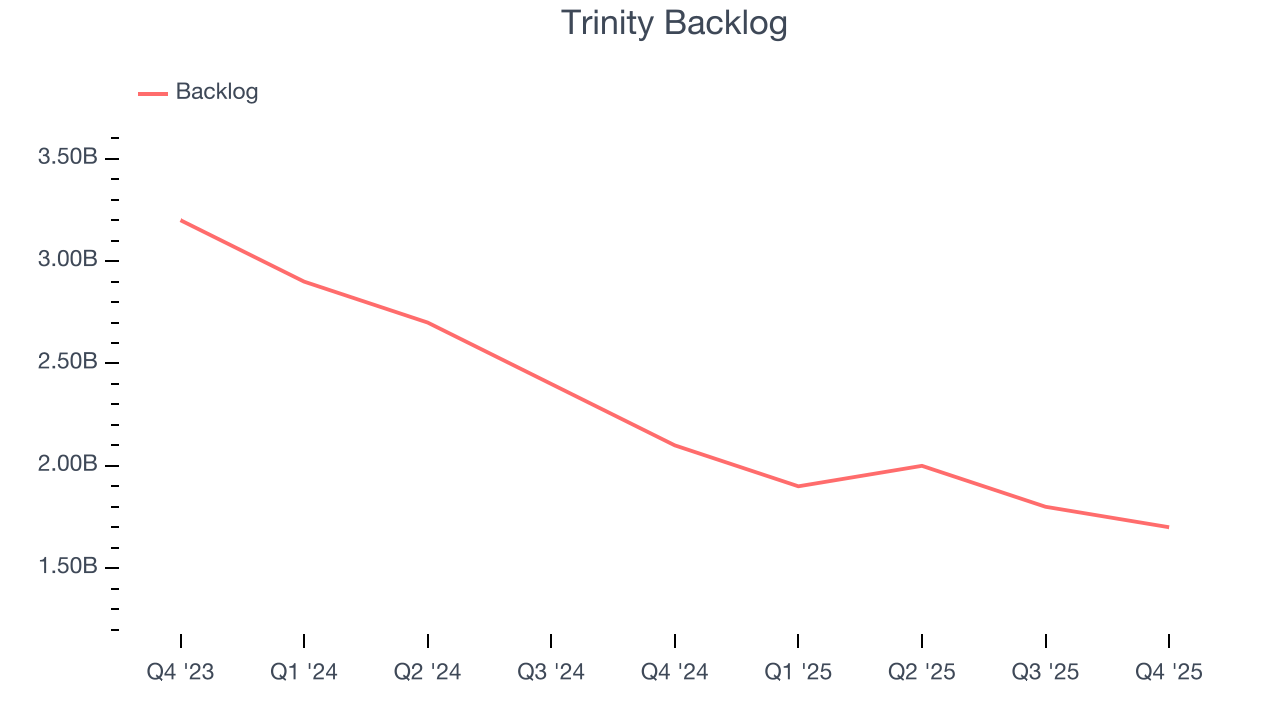
This quarter, Trinity’s revenue fell by 2.9% year on year to $611.2 million but beat Wall Street’s estimates by 7.1%.
Looking ahead, sell-side analysts expect revenue to remain flat over the next 12 months. While this projection suggests its newer products and services will fuel better top-line performance, it is still below average for the sector.
6. Gross Margin & Pricing Power
Trinity has bad unit economics for an industrials business, signaling it operates in a competitive market. As you can see below, it averaged a 21.3% gross margin over the last five years. That means Trinity paid its suppliers a lot of money ($78.74 for every $100 in revenue) to run its business. 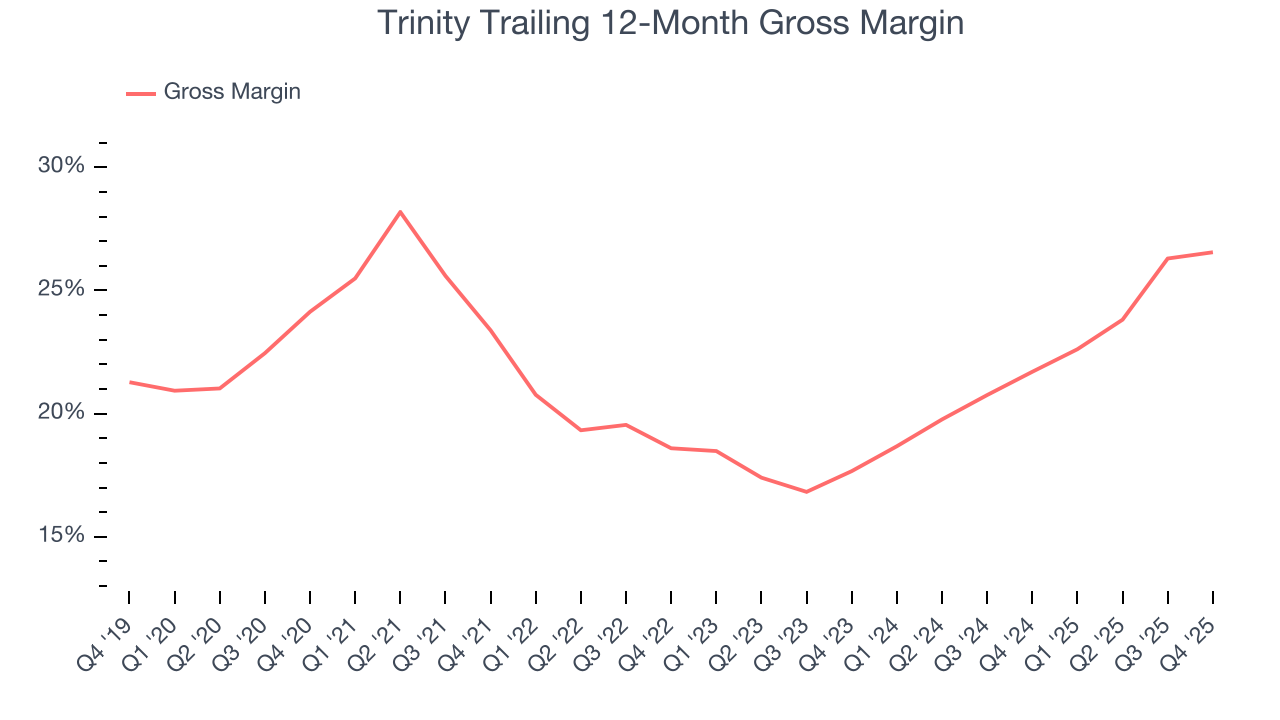
In Q4, Trinity produced a 25.5% gross profit margin, in line with the same quarter last year. Zooming out, Trinity’s full-year margin has been trending up over the past 12 months, increasing by 4.9 percentage points. If this move continues, it could suggest better unit economics due to some combination of stable to improving pricing power and input costs (such as raw materials).
7. Operating Margin
Operating margin is an important measure of profitability as it shows the portion of revenue left after accounting for all core expenses – everything from the cost of goods sold to advertising and wages. It’s also useful for comparing profitability across companies with different levels of debt and tax rates because it excludes interest and taxes.
Trinity has been an efficient company over the last five years. It was one of the more profitable businesses in the industrials sector, boasting an average operating margin of 14.7%. This result was particularly impressive because of its low gross margin, which is mostly a factor of what it sells and takes huge shifts to move meaningfully. Companies have more control over their operating margins, and it’s a show of well-managed operations if they’re high when gross margins are low.
Looking at the trend in its profitability, Trinity’s operating margin rose by 16.7 percentage points over the last five years, as its sales growth gave it operating leverage.
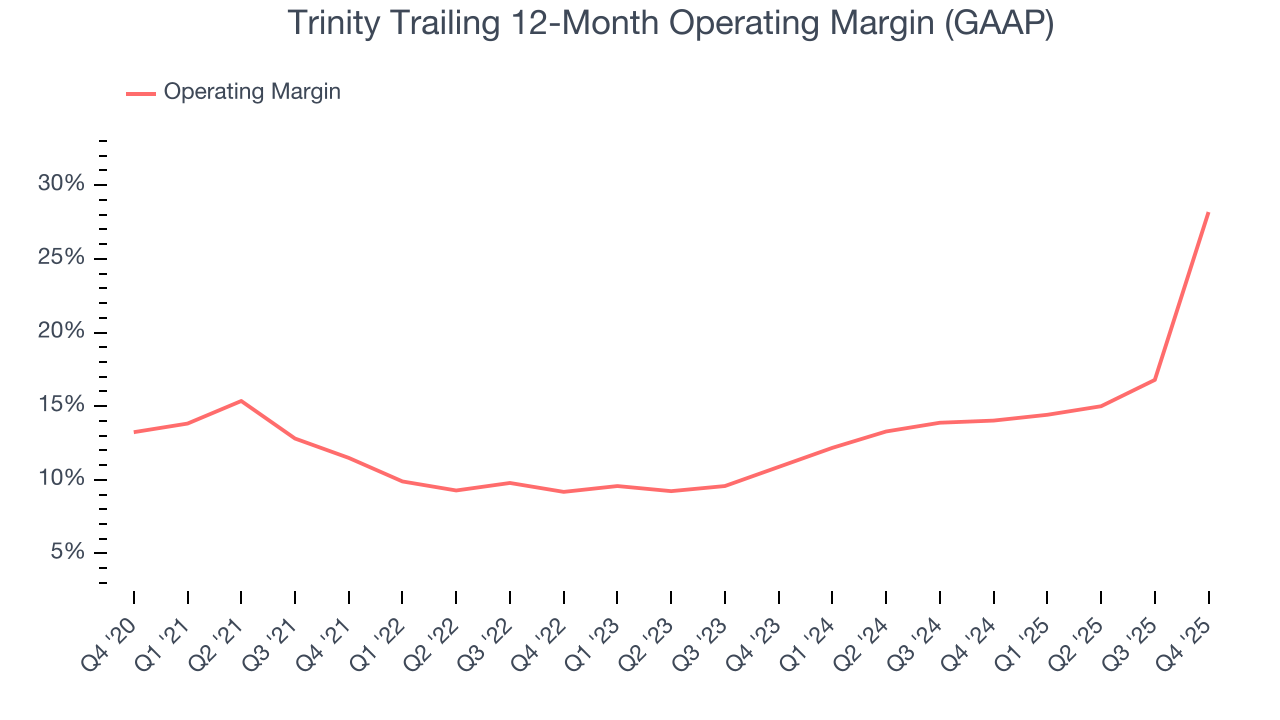
In Q4, Trinity generated an operating margin profit margin of 54.9%, up 40.1 percentage points year on year. The increase was solid, and because its operating margin rose more than its gross margin, we can infer it was more efficient with expenses such as marketing, R&D, and administrative overhead.
8. Earnings Per Share
Revenue trends explain a company’s historical growth, but the long-term change in earnings per share (EPS) points to the profitability of that growth – for example, a company could inflate its sales through excessive spending on advertising and promotions.
Trinity’s full-year EPS flipped from negative to positive over the last five years. This is encouraging and shows it’s at a critical moment in its life.
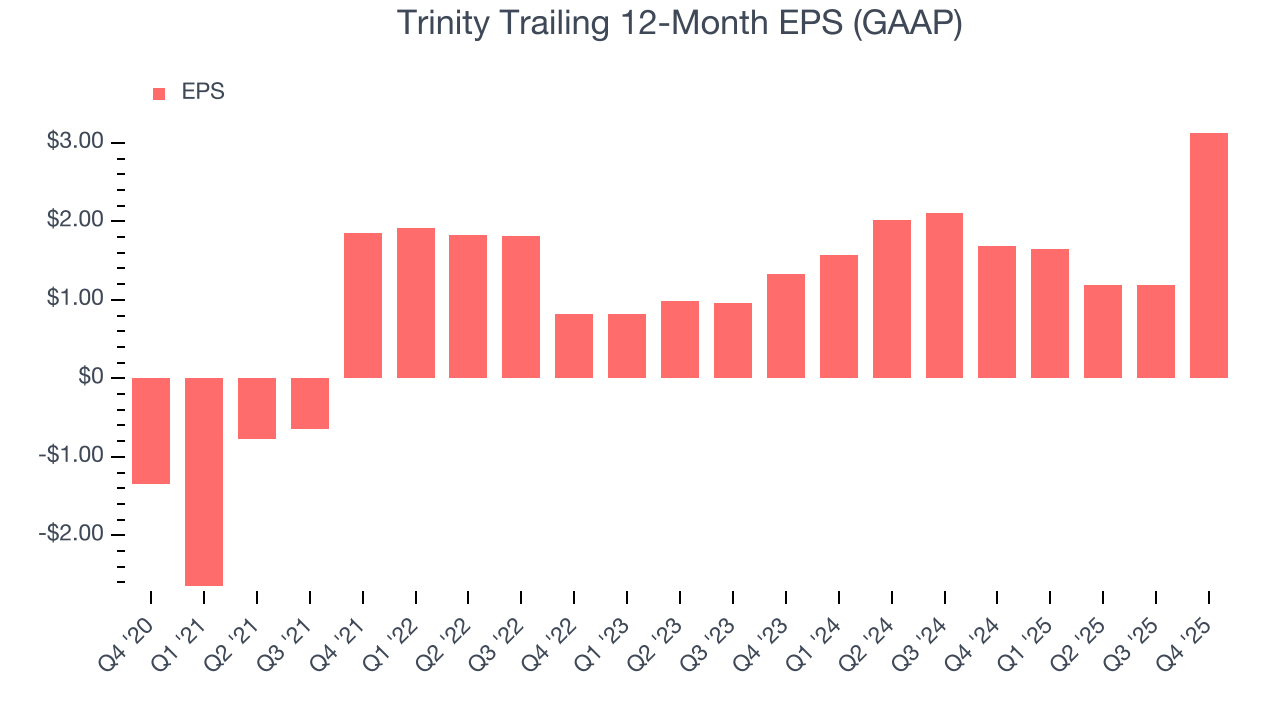
Like with revenue, we analyze EPS over a shorter period to see if we are missing a change in the business.
Trinity’s EPS grew at an astounding 53.4% compounded annual growth rate over the last two years, higher than its 15% annualized revenue declines. This tells us management adapted its cost structure in response to a challenging demand environment.
We can take a deeper look into Trinity’s earnings quality to better understand the drivers of its performance. Trinity’s operating margin has expanded over the last two yearswhile its share count has shrunk 2%. Improving profitability and share buybacks are positive signs for shareholders as they juice EPS growth relative to revenue growth. 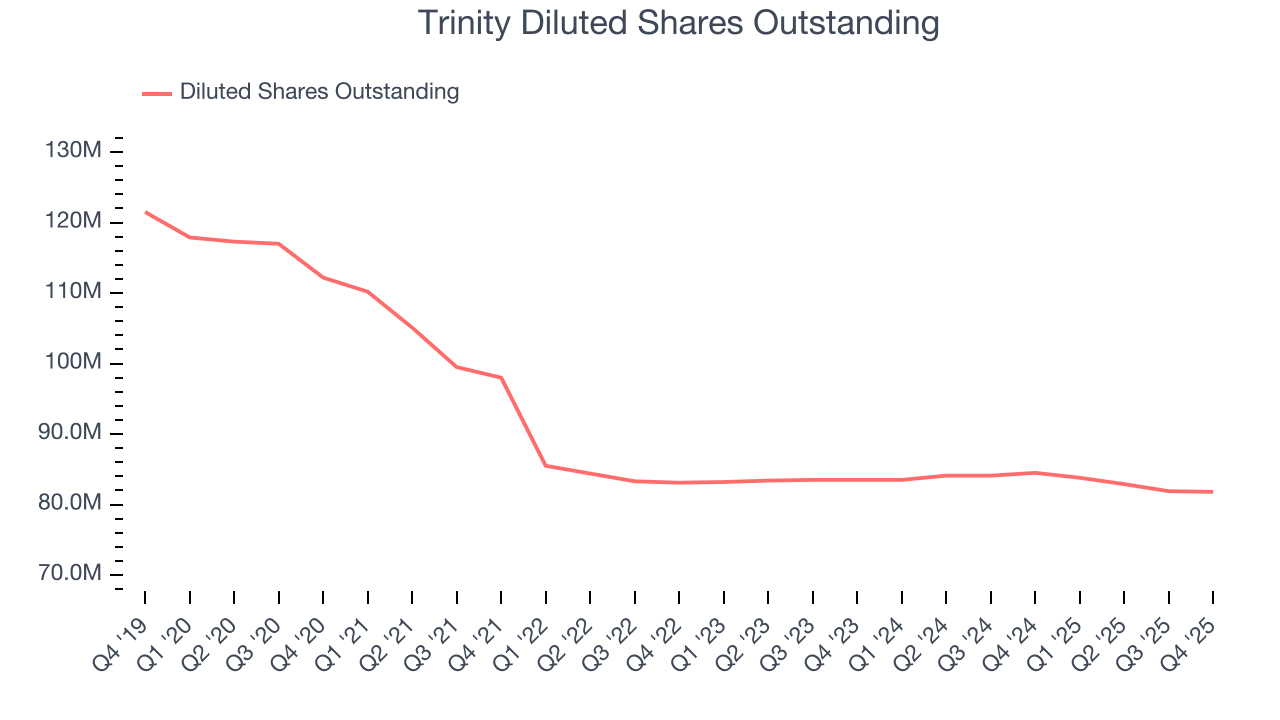
In Q4, Trinity reported EPS of $2.28, up from $0.34 in the same quarter last year. This print was close to analysts’ estimates. We also like to analyze expected EPS growth based on Wall Street analysts’ consensus projections, but there is insufficient data.
9. Cash Is King
If you’ve followed StockStory for a while, you know we emphasize free cash flow. Why, you ask? We believe that in the end, cash is king, and you can’t use accounting profits to pay the bills.
Trinity’s demanding reinvestments have drained its resources over the last five years, putting it in a pinch and limiting its ability to return capital to investors. Its free cash flow margin averaged negative 15.5%, meaning it lit $15.46 of cash on fire for every $100 in revenue. This is a stark contrast from its operating margin, and its investments in working capital/capital expenditures are the primary culprit.
Taking a step back, we can see that Trinity’s margin dropped by 22.9 percentage points during that time. Almost any movement in the wrong direction is undesirable because it is already burning cash. If the trend continues, it could signal it’s becoming a more capital-intensive business.
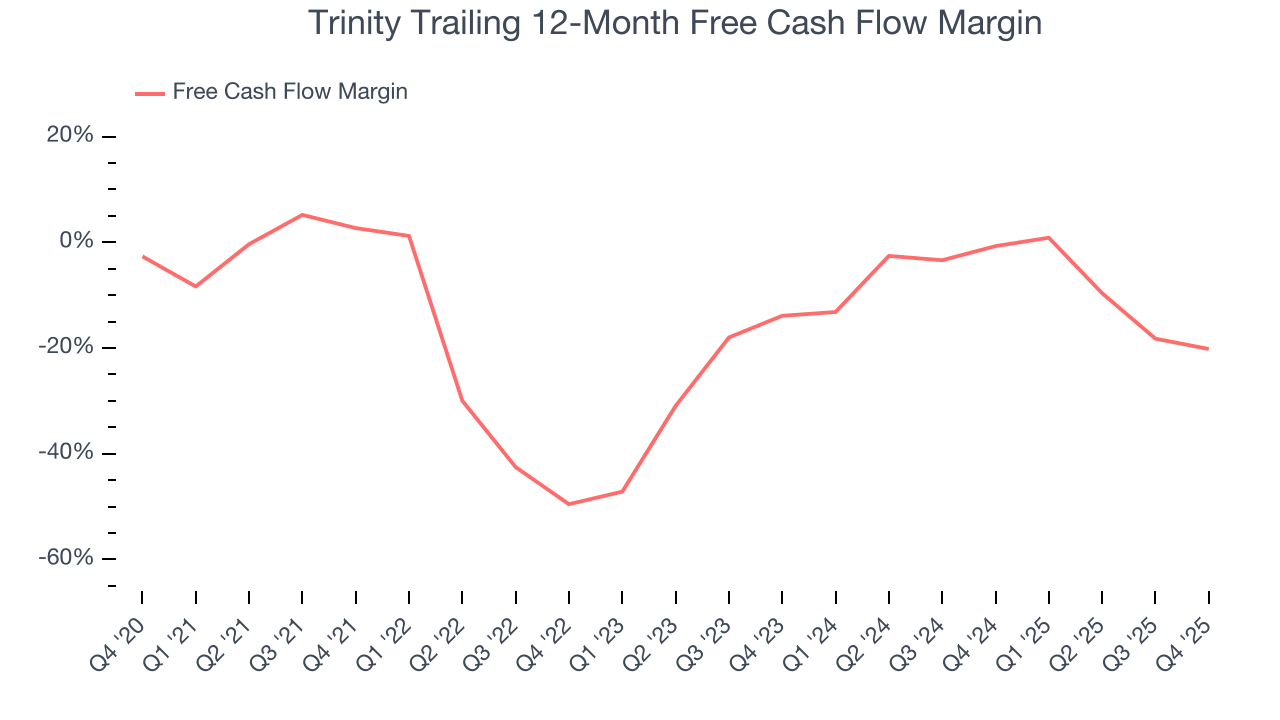
Trinity burned through $60.4 million of cash in Q4, equivalent to a negative 9.9% margin. The company’s cash burn increased from $21.6 million of lost cash in the same quarter last year.
10. Return on Invested Capital (ROIC)
EPS and free cash flow tell us whether a company was profitable while growing its revenue. But was it capital-efficient? Enter ROIC, a metric showing how much operating profit a company generates relative to the money it has raised (debt and equity).
Trinity’s management team makes decent investment decisions and generates value for shareholders. Its five-year average ROIC was 11.6%, slightly better than typical industrials business.
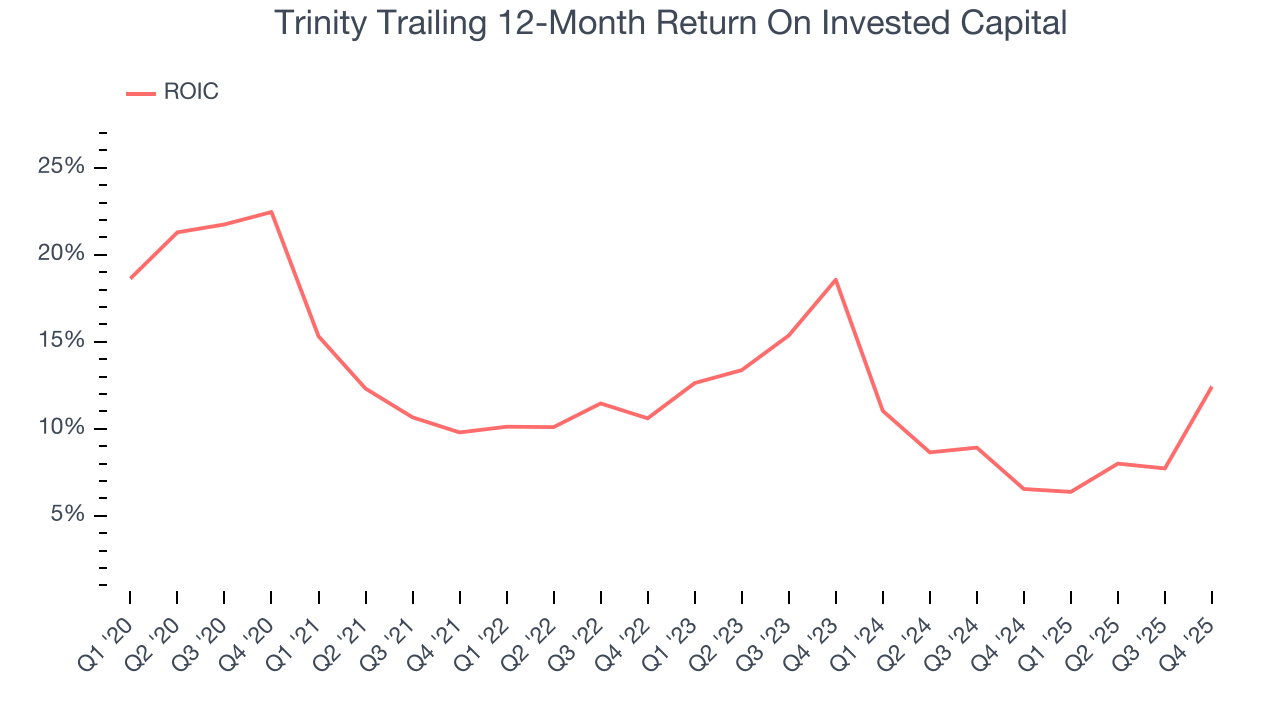
We like to invest in businesses with high returns, but the trend in a company’s ROIC is what often surprises the market and moves the stock price. Uneventfully, Trinity’s ROIC has stayed the same over the last few years. Given the company’s underwhelming financial performance in other areas, we’d like to see its returns improve before recommending the stock.
11. Balance Sheet Risk
As long-term investors, the risk we care about most is the permanent loss of capital, which can happen when a company goes bankrupt or raises money from a disadvantaged position. This is separate from short-term stock price volatility, something we are much less bothered by.
Trinity burned through $435.2 million of cash over the last year, and its $5.44 billion of debt exceeds the $201.3 million of cash on its balance sheet. This is a deal breaker for us because indebted loss-making companies spell trouble.
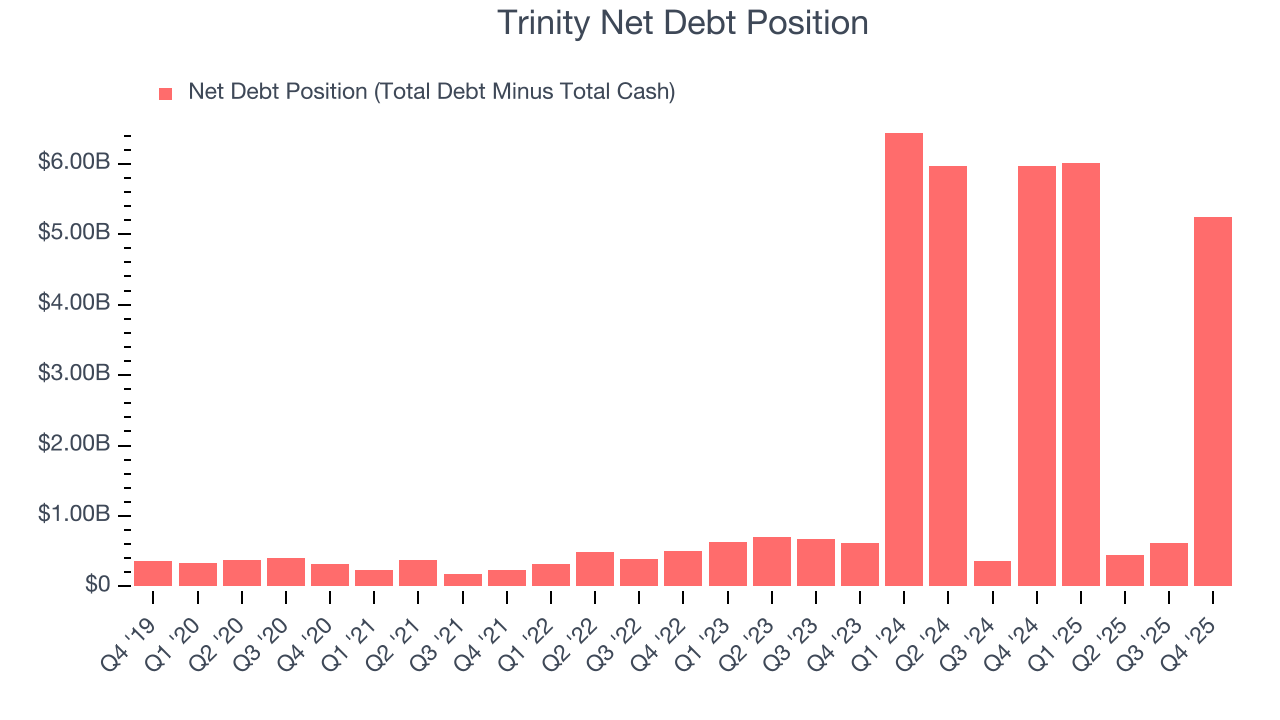
Unless the Trinity’s fundamentals change quickly, it might find itself in a position where it must raise capital from investors to continue operating. Whether that would be favorable is unclear because dilution is a headwind for shareholder returns.
We remain cautious of Trinity until it generates consistent free cash flow or any of its announced financing plans materialize on its balance sheet.
12. Key Takeaways from Trinity’s Q4 Results
We were impressed by how significantly Trinity blew past analysts’ revenue expectations this quarter. We were also glad its full-year EPS guidance trumped Wall Street’s estimates. Zooming out, we think this was a good print with some key areas of upside. The stock traded up 6.8% to $33.83 immediately following the results.
13. Is Now The Time To Buy Trinity?
Updated: March 27, 2026 at 11:49 PM EDT
When considering an investment in Trinity, investors should account for its valuation and business qualities as well as what’s happened in the latest quarter.
Trinity isn’t a terrible business, but it doesn’t pass our quality test. To begin with, its revenue growth was uninspiring over the last five years, and analysts expect its demand to deteriorate over the next 12 months. While its expanding operating margin shows the business has become more efficient, the downside is its cash profitability fell over the last five years. On top of that, its cash burn raises the question of whether it can sustainably maintain growth.
Trinity’s price-to-sales ratio based on the trailing 12 months is 1.2x. The market typically values companies like Trinity based on their anticipated profits for the next 12 months, but there aren’t enough published estimates to arrive at a reliable number. You should avoid this stock for now - better opportunities lie elsewhere.
Wall Street analysts have a consensus one-year price target of $33.50 on the company (compared to the current share price of $31.20).