
Unity (U)
Unity doesn’t excite us. Its sales have recently cratered and its historical operating losses don’t give us confidence in a turnaround.― StockStory Analyst Team
1. News


2. Summary
Why We Think Unity Will Underperform
Powering over half of the world's mobile games and expanding into industries from automotive to architecture, Unity (NYSE:U) provides software tools and services that allow developers to create, run, and monetize interactive 2D and 3D content across multiple platforms.
- Historical operating margin losses point to an inefficient cost structure
- Offerings struggled to generate meaningful interest as its average billings growth of 3.3% over the last year did not impress
- One positive is that its fast payback periods on sales and marketing expenses allow the company to invest heavily and onboard many customers concurrently


Unity falls short of our expectations. There are more rewarding stocks elsewhere.
Why There Are Better Opportunities Than Unity


Unity’s stock price of $18.25 implies a valuation ratio of 3.9x forward price-to-sales. Unity’s valuation may seem like a bargain, but we think there are valid reasons why it’s so cheap.
We’d rather pay up for companies with elite fundamentals than get a bargain on weak ones. Cheap stocks can be value traps, and as their performance deteriorates, they will stay cheap or get even cheaper.
3. Unity (U) Research Report: Q4 CY2025 Update
Interactive software platform Unity (NYSE:U) reported Q4 CY2025 results exceeding the market’s revenue expectations, with sales up 10.1% year on year to $503.1 million. On the other hand, next quarter’s revenue guidance of $485 million was less impressive, coming in 0.8% below analysts’ estimates. Its non-GAAP profit of $0.24 per share was 15.5% above analysts’ consensus estimates.
Unity (U) Q4 CY2025 Highlights:
- Revenue: $503.1 million vs analyst estimates of $492.1 million (10.1% year-on-year growth, 2.2% beat)
- Adjusted EPS: $0.24 vs analyst estimates of $0.21 (15.5% beat)
- Adjusted EBITDA: $124.9 million vs analyst estimates of $117.1 million (24.8% margin, 6.6% beat)
- Revenue Guidance for Q1 CY2026 is $485 million at the midpoint, below analyst estimates of $489.1 million
- EBITDA guidance for Q1 CY2026 is $107.5 million at the midpoint, below analyst estimates of $116.7 million
- Operating Margin: -21.2%, up from -27.1% in the same quarter last year
- Free Cash Flow Margin: 23.6%, down from 32.1% in the previous quarter
- Market Capitalization: $12.44 billion
Company Overview
Powering over half of the world's mobile games and expanding into industries from automotive to architecture, Unity (NYSE:U) provides software tools and services that allow developers to create, run, and monetize interactive 2D and 3D content across multiple platforms.
Unity's core product is its real-time 3D development platform, which offers a comprehensive suite of tools for creating interactive experiences. Developers can build content once and deploy it across various devices including mobile phones, PCs, gaming consoles, and augmented or virtual reality headsets. The platform includes features for graphics rendering, animation, physics simulation, audio management, and artificial intelligence capabilities.
Unity operates through two main solution sets. Its Create Solutions enable developers to build and ship interactive content with tools like the Unity Engine, which handles the technical complexities of real-time rendering and physics. Its Grow Solutions help developers monetize their applications through advertising, in-app purchases, and user acquisition tools, even for content not created with Unity.
A game studio might use Unity to build a mobile puzzle game, utilizing the platform's visual editing tools to design levels, implement gameplay mechanics, and add visual effects without extensive programming knowledge. Once published, the studio could use Unity's monetization services to display advertisements between game levels and analyze player behavior to optimize engagement.
Beyond gaming, Unity has expanded into industries such as architecture (for interactive building visualizations), automotive (for virtual car showrooms), film production (for pre-visualization), and industrial manufacturing (for training simulations). The company generates revenue through subscription fees for its software tools and a revenue share from its monetization services.
4. Design Software
The demand for rich, interactive 2D, 3D, VR and AR experiences is growing, and while the ubiquitous metaverse might still be more of a buzzword than a real thing, what is real is the demand for the tools to create these experiences, whether they are games, 3D tours or interactive movies.
Unity competes with Epic Games' Unreal Engine in the game development space, proprietary in-house engines at large game studios, and open-source alternatives like Godot. In the monetization sector, Unity faces competition from AppLovin (NYSE:APP), Digital Turbine (NASDAQ:APPS), and divisions of tech giants like Google (NASDAQ:GOOGL), Meta (NASDAQ:META), and Amazon (NASDAQ:AMZN).
5. Revenue Growth
A company’s long-term performance is an indicator of its overall quality. Any business can put up a good quarter or two, but many enduring ones grow for years. Over the last five years, Unity grew its sales at a decent 19.1% compounded annual growth rate. Its growth was slightly above the average software company and shows its offerings resonate with customers.
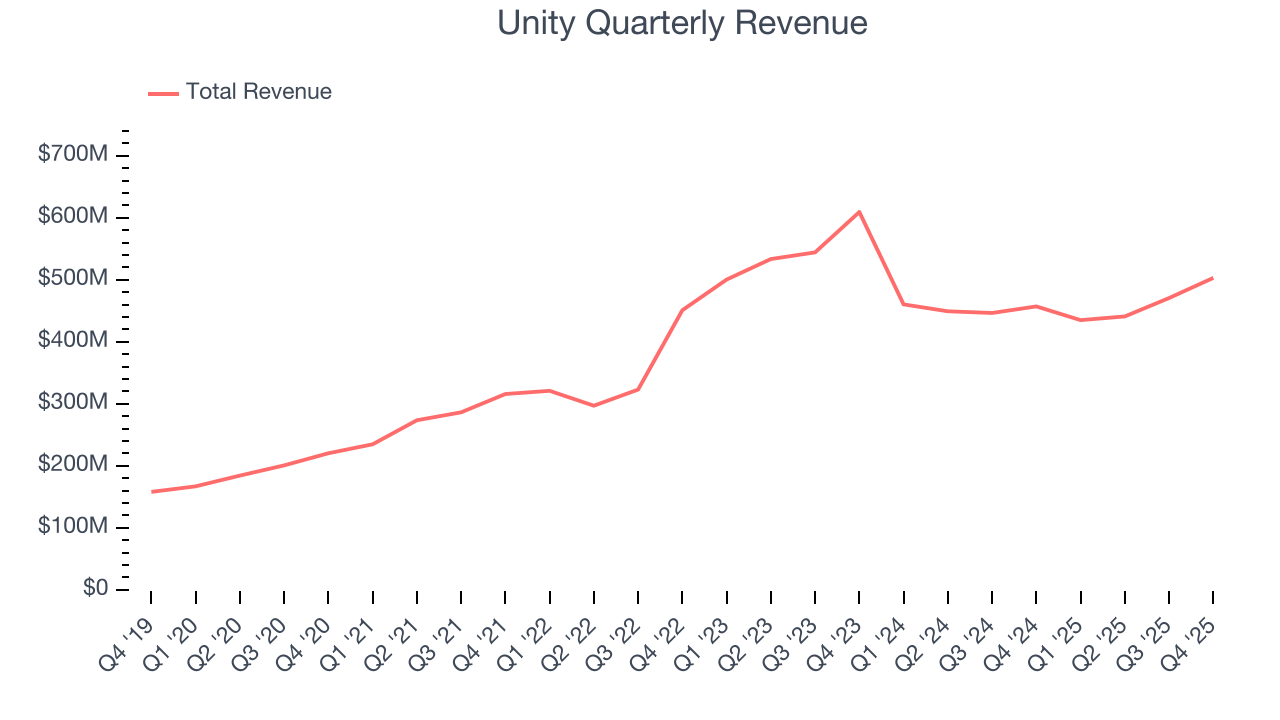
Long-term growth is the most important, but within software, a half-decade historical view may miss new innovations or demand cycles. Unity’s recent performance marks a sharp pivot from its five-year trend as its revenue has shown annualized declines of 8% over the last two years. 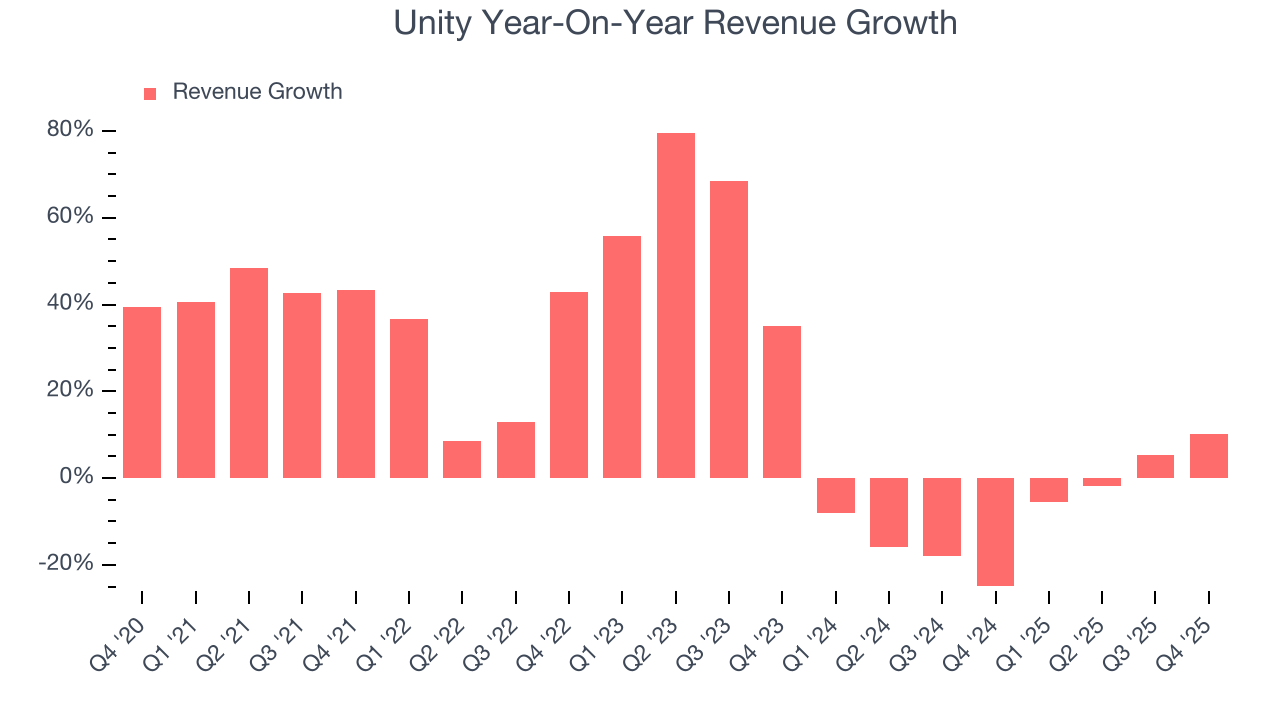
This quarter, Unity reported year-on-year revenue growth of 10.1%, and its $503.1 million of revenue exceeded Wall Street’s estimates by 2.2%. Company management is currently guiding for a 11.5% year-on-year increase in sales next quarter.
Looking further ahead, sell-side analysts expect revenue to grow 13% over the next 12 months. While this projection indicates its newer products and services will spur better top-line performance, it is still below the sector average.
6. Billings
Billings is a non-GAAP metric that is often called “cash revenue” because it shows how much money the company has collected from customers in a certain period. This is different from revenue, which must be recognized in pieces over the length of a contract.
Unity’s billings came in at $499.1 million in Q4, and over the last four quarters, its growth was underwhelming as it averaged 3.3% year-on-year increases. This performance mirrored its total sales and suggests that increasing competition is causing challenges in acquiring/retaining customers. 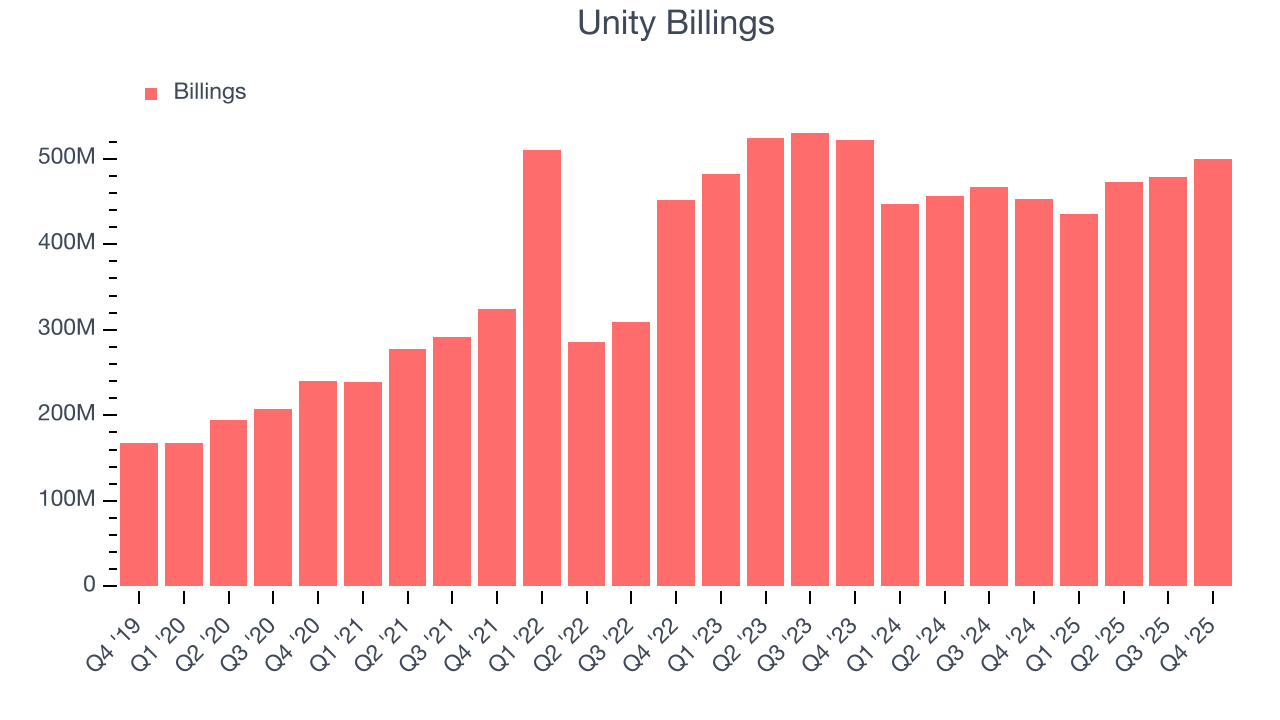
7. Customer Acquisition Efficiency
The customer acquisition cost (CAC) payback period measures the months a company needs to recoup the money spent on acquiring a new customer. This metric helps assess how quickly a business can break even on its sales and marketing investments.
Unity is quite efficient at acquiring new customers, and its CAC payback period checked in at 30.4 months this quarter. The company’s rapid recovery of its customer acquisition costs means it can attempt to spur growth by increasing its sales and marketing investments.
8. Gross Margin & Pricing Power
For software companies like Unity, gross profit tells us how much money remains after paying for the base cost of products and services (typically servers, licenses, and certain personnel). These costs are usually low as a percentage of revenue, explaining why software is more lucrative than other sectors.
Unity’s gross margin is better than the broader software industry and signals it has solid unit economics and competitive products. As you can see below, it averaged a decent 74.2% gross margin over the last year. That means for every $100 in revenue, roughly $74.21 was left to spend on selling, marketing, and R&D.
The market not only cares about gross margin levels but also how they change over time because expansion creates firepower for profitability and free cash generation. Unity has seen gross margins improve by 7 percentage points over the last 2 year, which is elite in the software space.
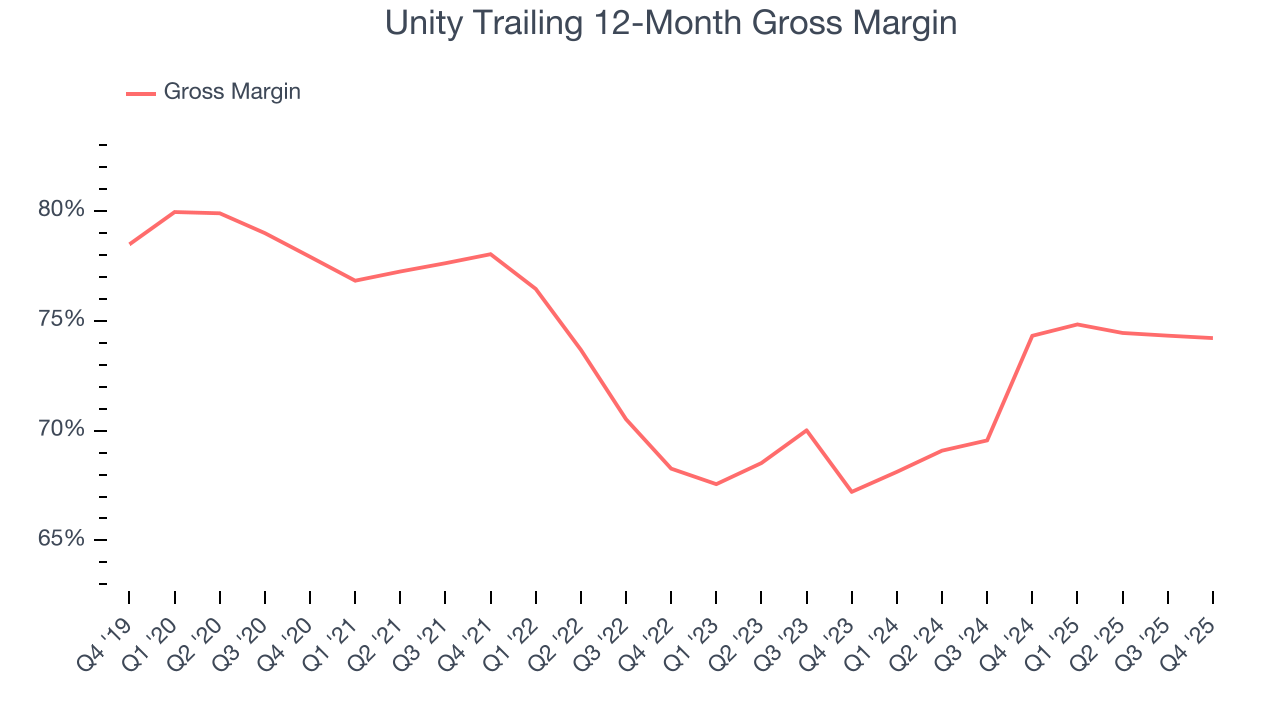
Unity’s gross profit margin came in at 74.3% this quarter, in line with the same quarter last year. Zooming out, the company’s full-year margin has remained steady over the past 12 months, suggesting its input costs have been stable and it isn’t under pressure to lower prices.
9. Operating Margin
Unity’s expensive cost structure has contributed to an average operating margin of negative 25.9% over the last year. Unprofitable, high-growth software companies require extra attention because they spend heaps of money to capture market share. As seen in its fast historical revenue growth, this strategy seems to have worked so far, but it’s unclear what would happen if Unity reeled back its investments. Wall Street seems to think it will face some obstacles, and we tend to agree.
Over the last two years, Unity’s expanding sales gave it operating leverage as its margin rose by 15.7 percentage points. Still, it will take much more for the company to reach long-term profitability.
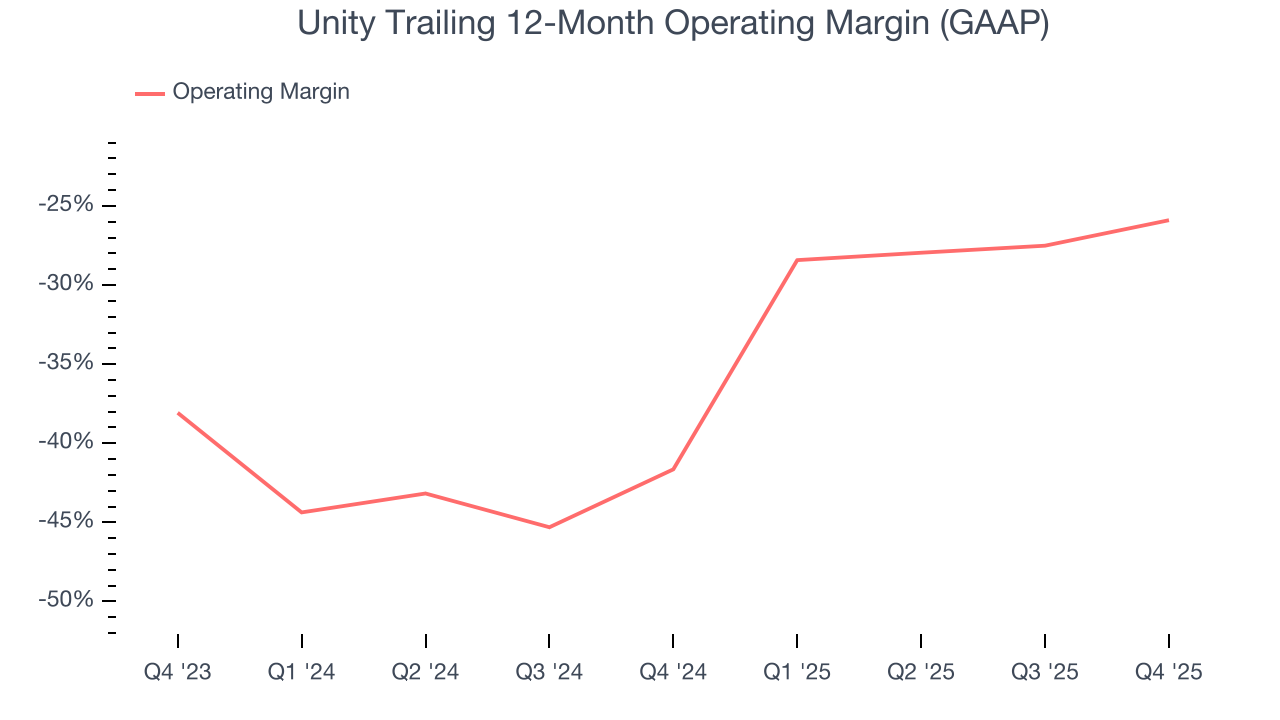
In Q4, Unity generated a negative 21.2% operating margin.
10. Cash Is King
If you’ve followed StockStory for a while, you know we emphasize free cash flow. Why, you ask? We believe that in the end, cash is king, and you can’t use accounting profits to pay the bills.
Unity has shown impressive cash profitability, driven by its cost-effective customer acquisition strategy that gives it the option to invest in new products and services rather than sales and marketing. The company’s free cash flow margin averaged 21.8% over the last year, better than the broader software sector. The divergence from its underwhelming operating margin stems from the add-back of non-cash charges like depreciation and stock-based compensation. GAAP operating profit expenses these line items, but free cash flow does not.
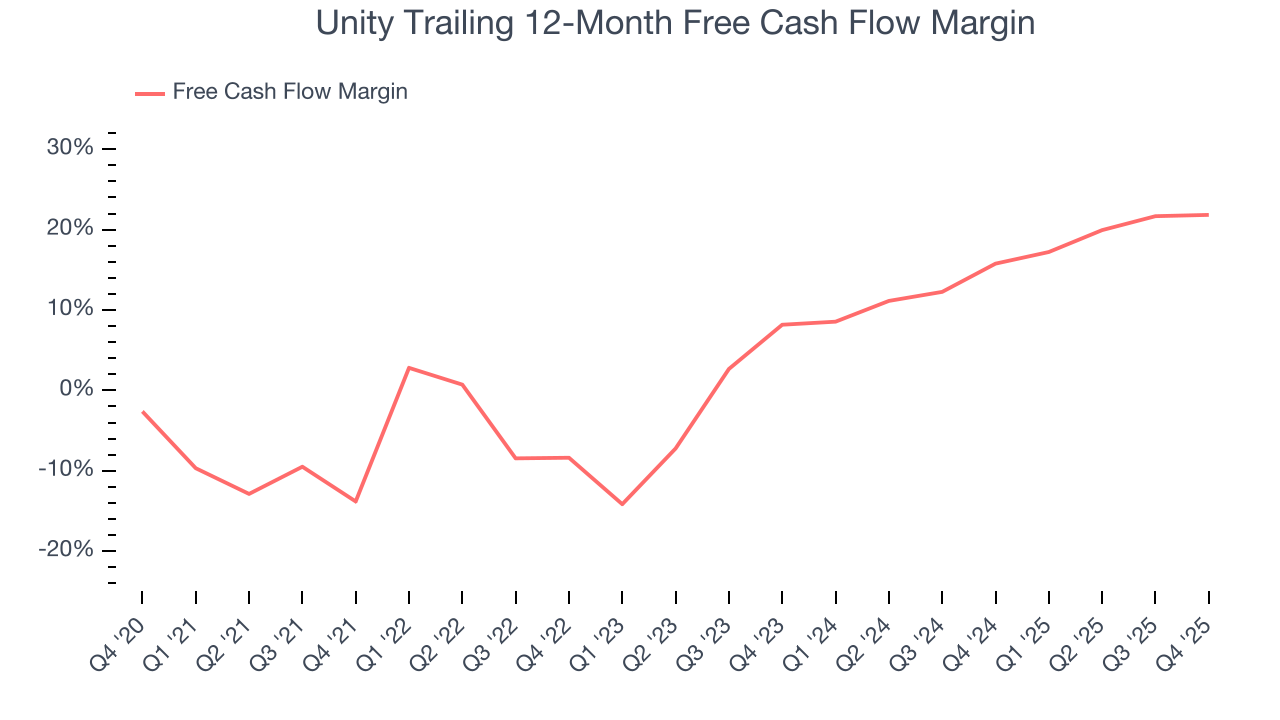
Unity’s free cash flow clocked in at $118.7 million in Q4, equivalent to a 23.6% margin. This cash profitability was in line with the comparable period last year and above its one-year average.
Over the next year, analysts predict Unity’s cash conversion will improve. Their consensus estimates imply its free cash flow margin of 21.8% for the last 12 months will increase to 25.5%, giving it more flexibility for investments, share buybacks, and dividends.
11. Balance Sheet Assessment
Unity reported $2.06 billion of cash and $2.24 billion of debt on its balance sheet in the most recent quarter. As investors in high-quality companies, we primarily focus on two things: 1) that a company’s debt level isn’t too high and 2) that its interest payments are not excessively burdening the business.
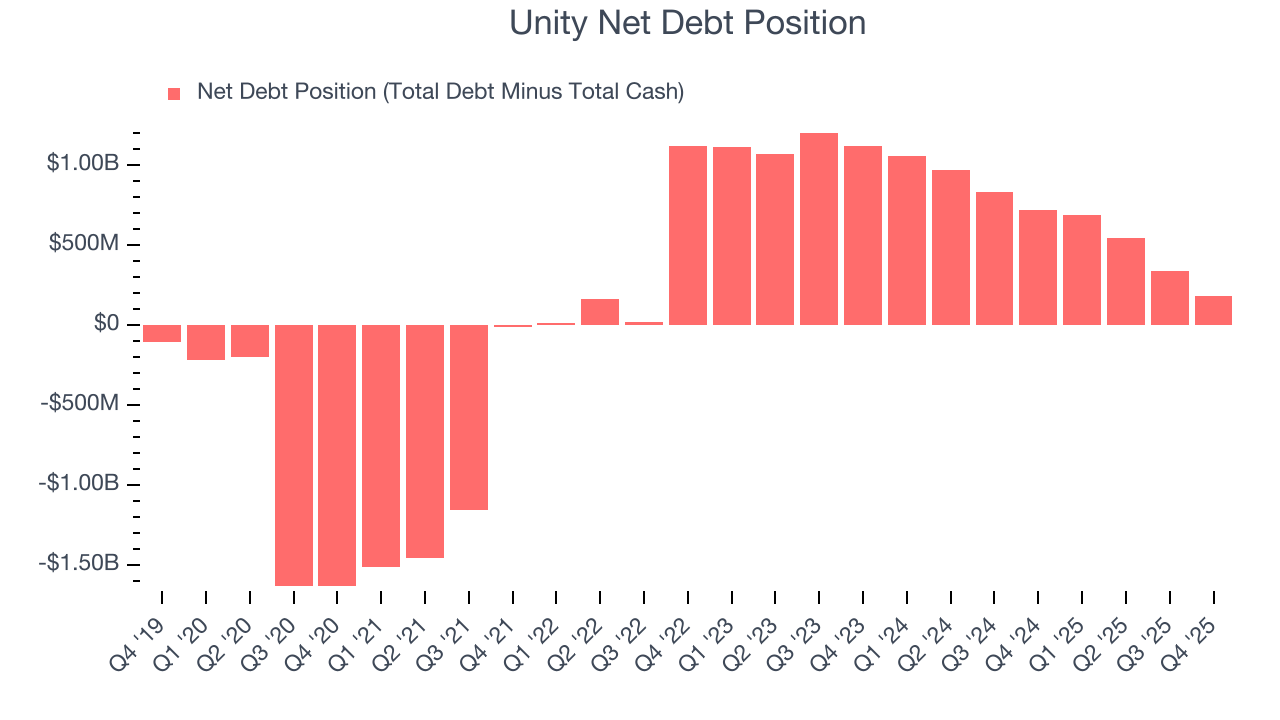
With $408.8 million of EBITDA over the last 12 months, we view Unity’s 0.4× net-debt-to-EBITDA ratio as safe. We also see its $25.65 million of annual interest expenses as appropriate. The company’s profits give it plenty of breathing room, allowing it to continue investing in growth initiatives.
12. Key Takeaways from Unity’s Q4 Results
We enjoyed seeing Unity beat analysts’ EBITDA expectations this quarter. We were also happy its revenue outperformed Wall Street’s estimates. On the other hand, its revenue and EBITDA guidance for next quarter both missed, and this is weighing heavily on shares. Overall, this was a weaker quarter. The stock traded down 24.1% to $22.15 immediately after reporting.
13. Is Now The Time To Buy Unity?
Updated: March 24, 2026 at 10:18 PM EDT
Before investing in or passing on Unity, we urge you to understand the company’s business quality (or lack thereof), valuation, and the latest quarterly results - in that order.
Unity’s business quality ultimately falls short of our standards. Although its revenue growth was solid over the last five years, it’s expected to deteriorate over the next 12 months and its operating margins reveal poor profitability compared to other software companies.
Unity’s price-to-sales ratio based on the next 12 months is 3.9x. This valuation multiple is fair, but we don’t have much faith in the company. We're fairly confident there are better investments elsewhere.
Wall Street analysts have a consensus one-year price target of $32.33 on the company (compared to the current share price of $18.25).
Although the price target is bullish, readers should exercise caution because analysts tend to be overly optimistic. The firms they work for, often big banks, have relationships with companies that extend into fundraising, M&A advisory, and other rewarding business lines. As a result, they typically hesitate to say bad things for fear they will lose out. We at StockStory do not suffer from such conflicts of interest, so we’ll always tell it like it is.