
U.S. Physical Therapy (USPH)
We aren’t fans of U.S. Physical Therapy. Its poor sales growth and falling returns on capital suggest its growth opportunities are shrinking.― StockStory Analyst Team
1. News


2. Summary
Why We Think U.S. Physical Therapy Will Underperform
With a nationwide footprint spanning 671 clinics across 42 states, U.S. Physical Therapy (NYSE:USPH) operates a network of outpatient physical therapy clinics and provides industrial injury prevention services to employers across the United States.
- Subscale operations are evident in its revenue base of $781 million, meaning it has fewer distribution channels than its larger rivals
- Incremental sales over the last five years were less profitable as its 1.9% annual earnings per share growth lagged its revenue gains
- A positive is that its solid 13% annual revenue growth over the last five years indicates its offering’s solve complex business issues


U.S. Physical Therapy’s quality doesn’t meet our expectations. We’re redirecting our focus to better businesses.
Why There Are Better Opportunities Than U.S. Physical Therapy


U.S. Physical Therapy is trading at $73.83 per share, or 25.8x forward P/E. Not only does U.S. Physical Therapy trade at a premium to companies in the healthcare space, but this multiple is also high for its fundamentals.
We prefer to invest in similarly-priced but higher-quality companies with superior earnings growth.
3. U.S. Physical Therapy (USPH) Research Report: Q4 CY2025 Update
Outpatient physical therapy provider U.S. Physical Therapy (NYSE:USPH) announced better-than-expected revenue in Q4 CY2025, with sales up 12.3% year on year to $202.7 million. Its non-GAAP profit of $0.67 per share was in line with analysts’ consensus estimates.
U.S. Physical Therapy (USPH) Q4 CY2025 Highlights:
- Revenue: $202.7 million vs analyst estimates of $199.4 million (12.3% year-on-year growth, 1.7% beat)
- Adjusted EPS: $0.67 vs analyst estimates of $0.67 (in line)
- Adjusted EBITDA: $24.75 million vs analyst estimates of $24.74 million (12.2% margin, in line)
- EBITDA guidance for the upcoming financial year 2026 is $104 million at the midpoint, in line with analyst expectations
- Operating Margin: 8.3%, down from 10.9% in the same quarter last year
- Free Cash Flow Margin: 10.4%, similar to the same quarter last year
- Sales Volumes rose 11.2% year on year (0% in the same quarter last year)
- Market Capitalization: $1.2 billion
Company Overview
With a nationwide footprint spanning 671 clinics across 42 states, U.S. Physical Therapy (NYSE:USPH) operates a network of outpatient physical therapy clinics and provides industrial injury prevention services to employers across the United States.
The company's business is structured around two main segments. The Physical Therapy Operations segment forms the core of its business, where U.S. Physical Therapy typically owns a majority interest (usually 65-75%) in clinic partnerships, with the managing physical therapist owning the remaining interest. These clinics provide treatment for orthopedic injuries, neurological conditions, and post-surgical rehabilitation, with patients typically visiting 2-3 times weekly for 2-6 weeks.
Patients come primarily through physician referrals, with treatments including therapeutic exercise, manual therapy, ultrasound, electrical stimulation, and education on managing daily life skills. The company provides administrative support to its clinics, handling everything from site selection and clinic design to accounting systems and marketing support, while allowing each location to maintain its local identity.
The Industrial Injury Prevention Services (IIP) segment has grown through several acquisitions since 2017. This division offers services such as onsite injury prevention, ergonomic assessments, post-offer employment testing, and functional capacity evaluations. These services are delivered by physical therapists and certified athletic trainers, with most clients being employers (including Fortune 500 companies) who contract and pay for these services directly.
Revenue comes from diverse sources, with approximately 63% derived from managed care plans, commercial health insurers, workers' compensation, and other private payers, while about 37% comes from Medicare and Medicaid. For Medicare reimbursement, facilities must meet specific participation conditions set by the Department of Health and Human Services.
The company continues to expand through acquisitions of both physical therapy practices and industrial injury prevention service providers, while also developing satellite clinics within existing partnerships to extend its geographic reach.
4. Outpatient & Specialty Care
The outpatient and specialty care industry delivers targeted medical services in non-hospital settings that are often cost-effective compared to inpatient alternatives. This means that they are more desired as rising healthcare costs and ways to combat them become more and more top-of-mind. Outpatient and specialty care providers boast revenue streams that are stable due to the recurring nature of treatment for chronic conditions and long-term patient relationships. However, their reliance on government reimbursement programs like Medicare means stroke-of-the-pen risk. Additionally, scaling a network of facilities can be capital-intensive with uneven return profiles amid competition from integrated healthcare systems. Looking ahead, the industry is positioned to grow as demand for outpatient services expands, driven by aging populations, a rising prevalence of chronic diseases, and a shift toward value-based care models. Tailwinds include advancements in medical technology that support more complex procedures in outpatient settings and the increasing focus on preventive care, which can be aided by data and AI. However, headwinds such as reimbursement rate cuts, labor shortages, and the financial strain of digitization may temper growth.
U.S. Physical Therapy's competitors include Select Medical Holdings (NYSE:SEM), ATI Physical Therapy (NYSE:ATIP), and Athletico Physical Therapy (privately held), along with numerous regional physical therapy chains and independent clinics.
5. Revenue Scale
Larger companies benefit from economies of scale, where fixed costs like infrastructure, technology, and administration are spread over a higher volume of goods or services, reducing the cost per unit. Scale can also lead to bargaining power with suppliers, greater brand recognition, and more investment firepower. A virtuous cycle can ensue if a scaled company plays its cards right.
With just $781 million in revenue over the past 12 months, U.S. Physical Therapy is a small company in an industry where scale matters. This makes it difficult to build trust with customers because healthcare is heavily regulated, complex, and resource-intensive.
6. Revenue Growth
A company’s long-term sales performance is one signal of its overall quality. Any business can put up a good quarter or two, but the best consistently grow over the long haul. Thankfully, U.S. Physical Therapy’s 13% annualized revenue growth over the last five years was solid. Its growth beat the average healthcare company and shows its offerings resonate with customers.
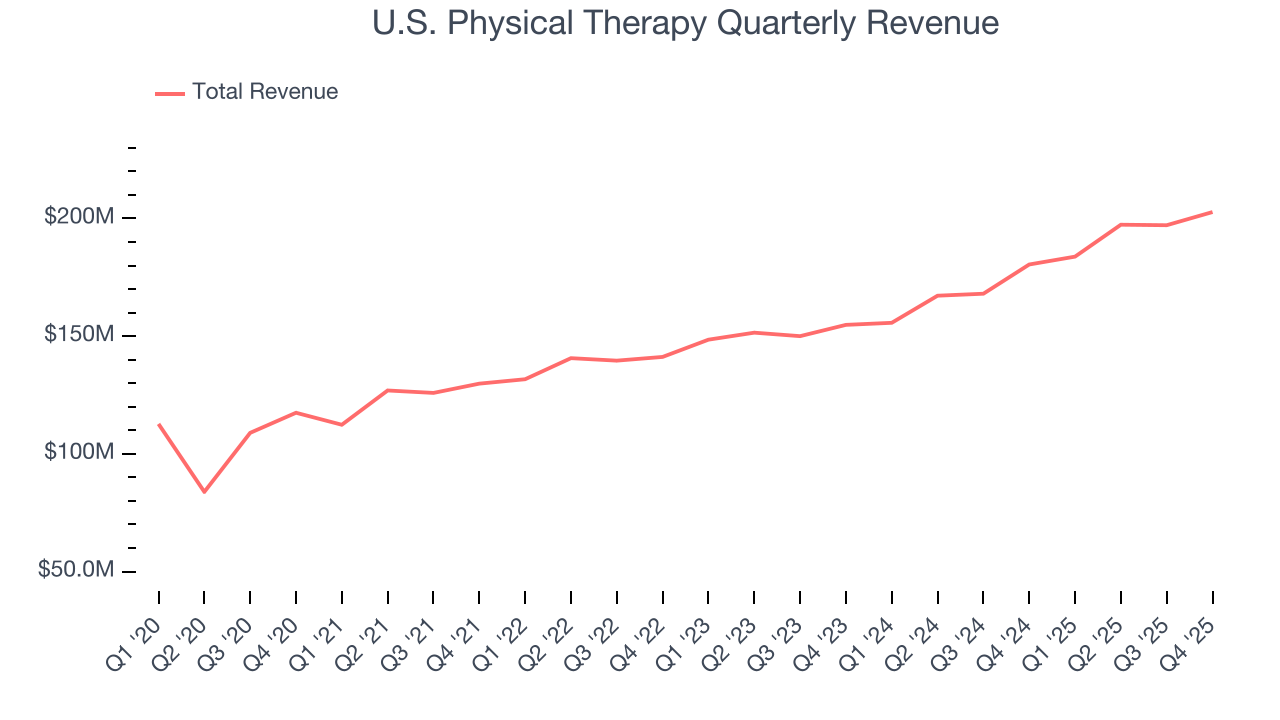
Long-term growth is the most important, but within healthcare, a half-decade historical view may miss new innovations or demand cycles. U.S. Physical Therapy’s annualized revenue growth of 13.6% over the last two years aligns with its five-year trend, suggesting its demand was predictably strong. 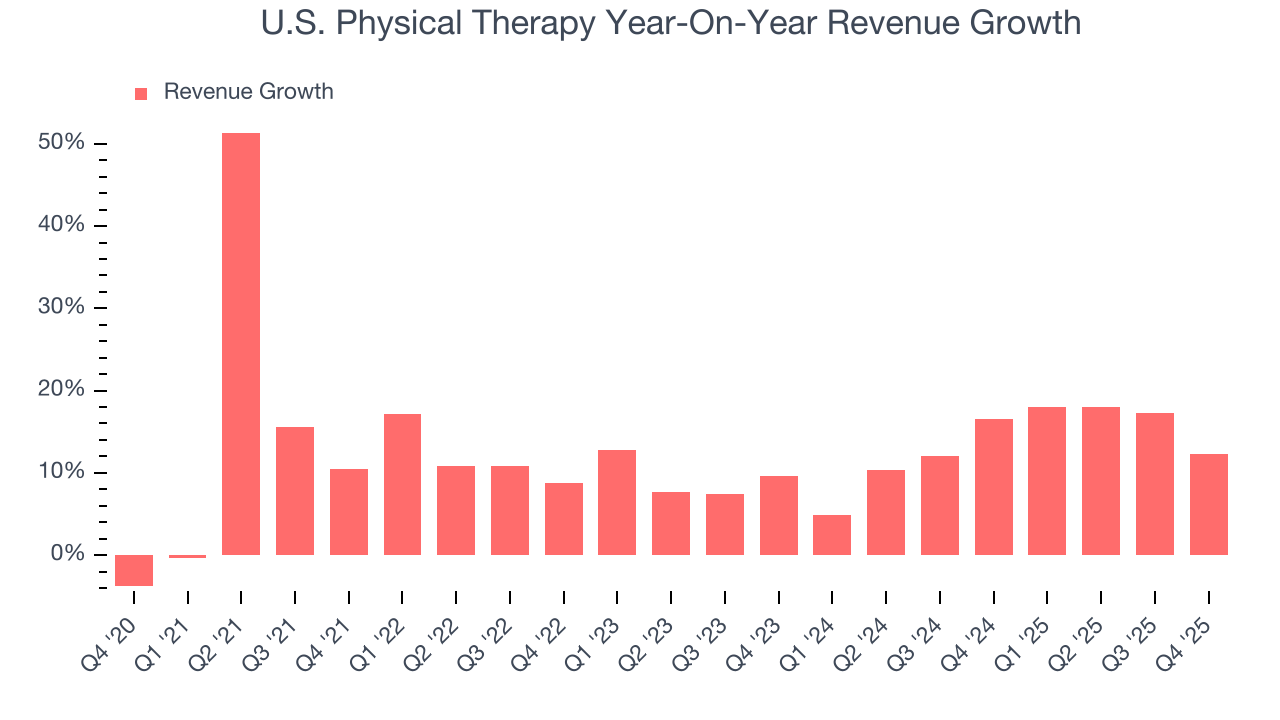
We can dig further into the company’s revenue dynamics by analyzing its number of patient visits, which reached 1.59 million in the latest quarter. Over the last two years, U.S. Physical Therapy’s patient visits averaged 12% year-on-year growth. Because this number is lower than its revenue growth, we can see the company benefited from price increases. 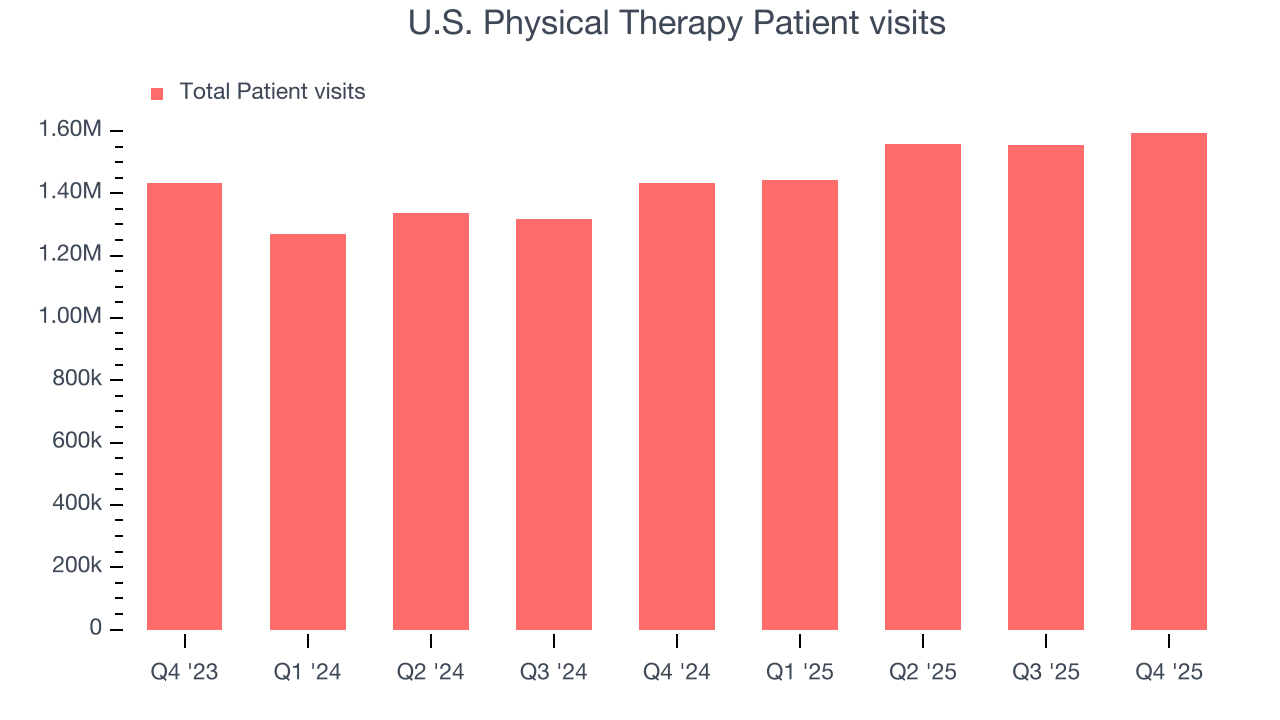
This quarter, U.S. Physical Therapy reported year-on-year revenue growth of 12.3%, and its $202.7 million of revenue exceeded Wall Street’s estimates by 1.7%.
Looking ahead, sell-side analysts expect revenue to grow 6% over the next 12 months, a deceleration versus the last two years. Still, this projection is above the sector average and suggests the market is baking in some success for its newer products and services.
7. Adjusted Operating Margin
U.S. Physical Therapy has done a decent job managing its cost base over the last five years. The company has produced an average adjusted operating margin of 10.7%, higher than the broader healthcare sector.
Analyzing the trend in its profitability, U.S. Physical Therapy’s adjusted operating margin decreased by 3.2 percentage points over the last five years, but it rose by 2.5 percentage points on a two-year basis. Still, shareholders will want to see U.S. Physical Therapy become more profitable in the future.
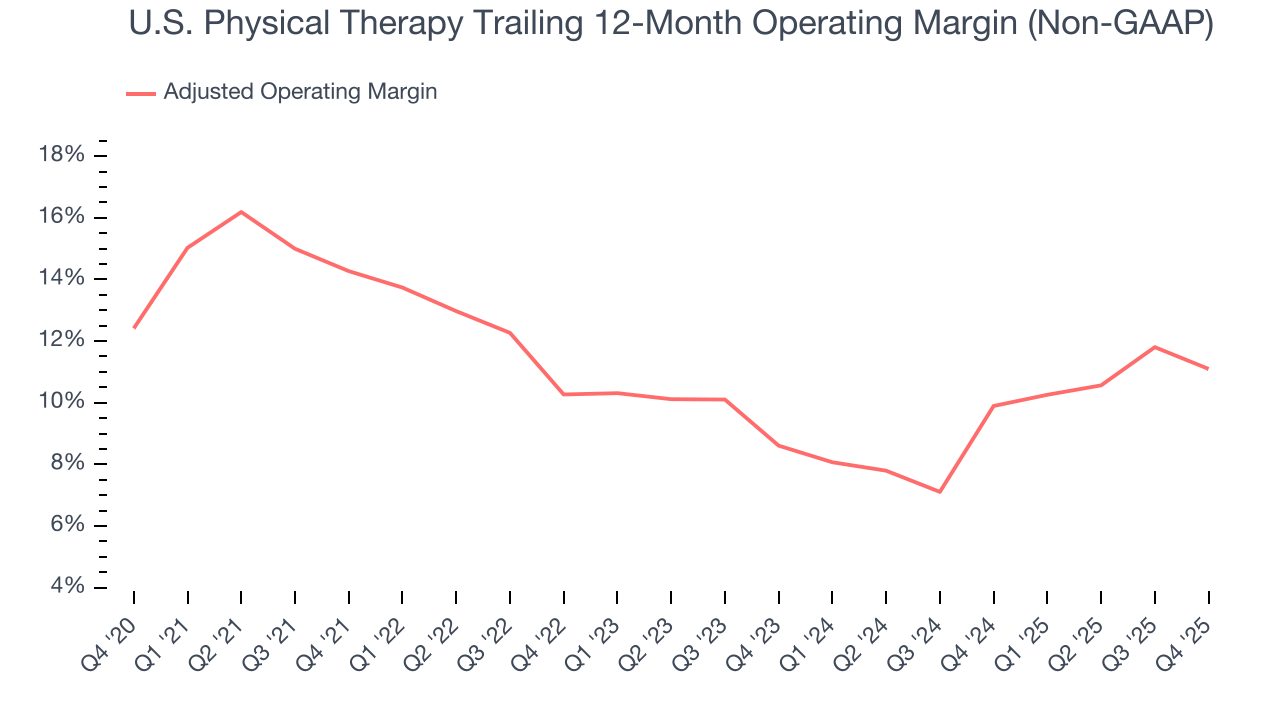
This quarter, U.S. Physical Therapy generated an adjusted operating margin profit margin of 8.3%, down 2.6 percentage points year on year. This contraction shows it was less efficient because its expenses grew faster than its revenue.
8. Earnings Per Share
Revenue trends explain a company’s historical growth, but the long-term change in earnings per share (EPS) points to the profitability of that growth – for example, a company could inflate its sales through excessive spending on advertising and promotions.
U.S. Physical Therapy’s EPS grew at an unimpressive 1.9% compounded annual growth rate over the last five years, lower than its 13% annualized revenue growth. This tells us the company became less profitable on a per-share basis as it expanded.
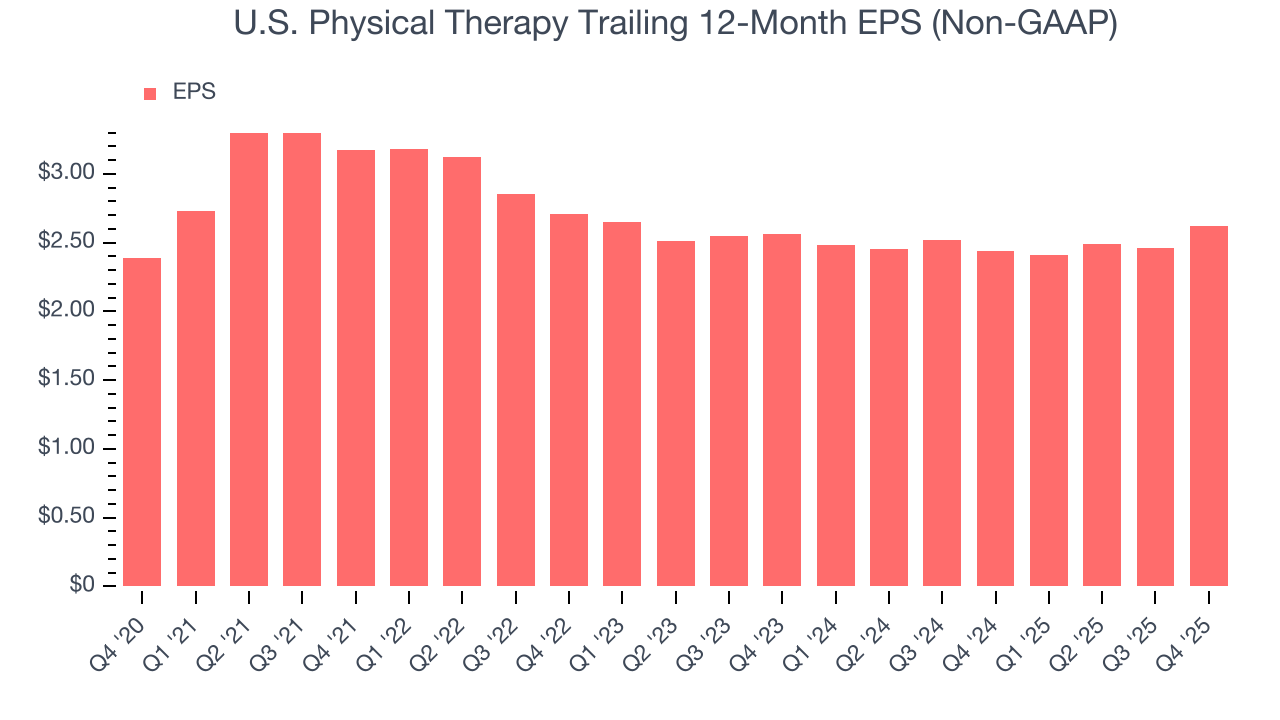
Diving into the nuances of U.S. Physical Therapy’s earnings can give us a better understanding of its performance. As we mentioned earlier, U.S. Physical Therapy’s adjusted operating margin declined by 3.2 percentage points over the last five years. Its share count also grew by 18%, meaning the company not only became less efficient with its operating expenses but also diluted its shareholders. 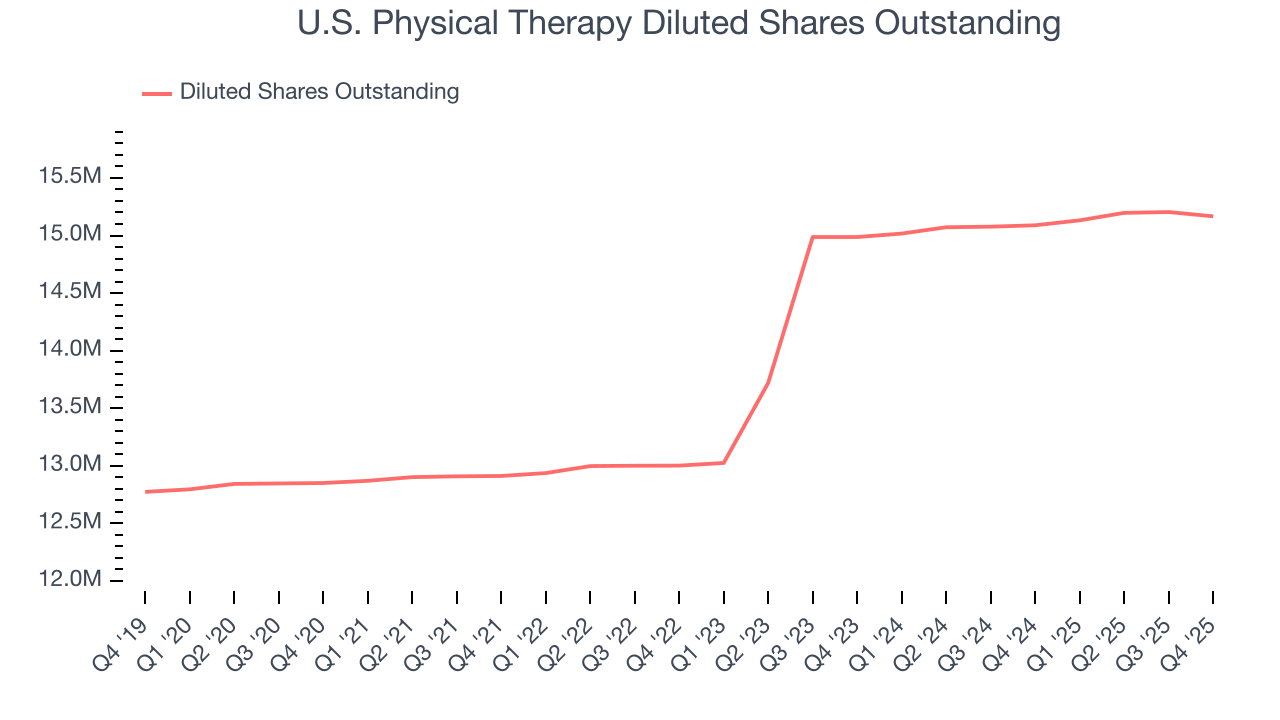
In Q4, U.S. Physical Therapy reported adjusted EPS of $0.67, up from $0.51 in the same quarter last year. This print was close to analysts’ estimates. Over the next 12 months, Wall Street expects U.S. Physical Therapy’s full-year EPS of $2.62 to grow 14%.
9. Cash Is King
Although earnings are undoubtedly valuable for assessing company performance, we believe cash is king because you can’t use accounting profits to pay the bills.
U.S. Physical Therapy has shown impressive cash profitability, giving it the option to reinvest or return capital to investors. The company’s free cash flow margin averaged 10.2% over the last five years, better than the broader healthcare sector.
Taking a step back, we can see that U.S. Physical Therapy’s margin dropped by 6 percentage points during that time. If its declines continue, it could signal increasing investment needs and capital intensity.
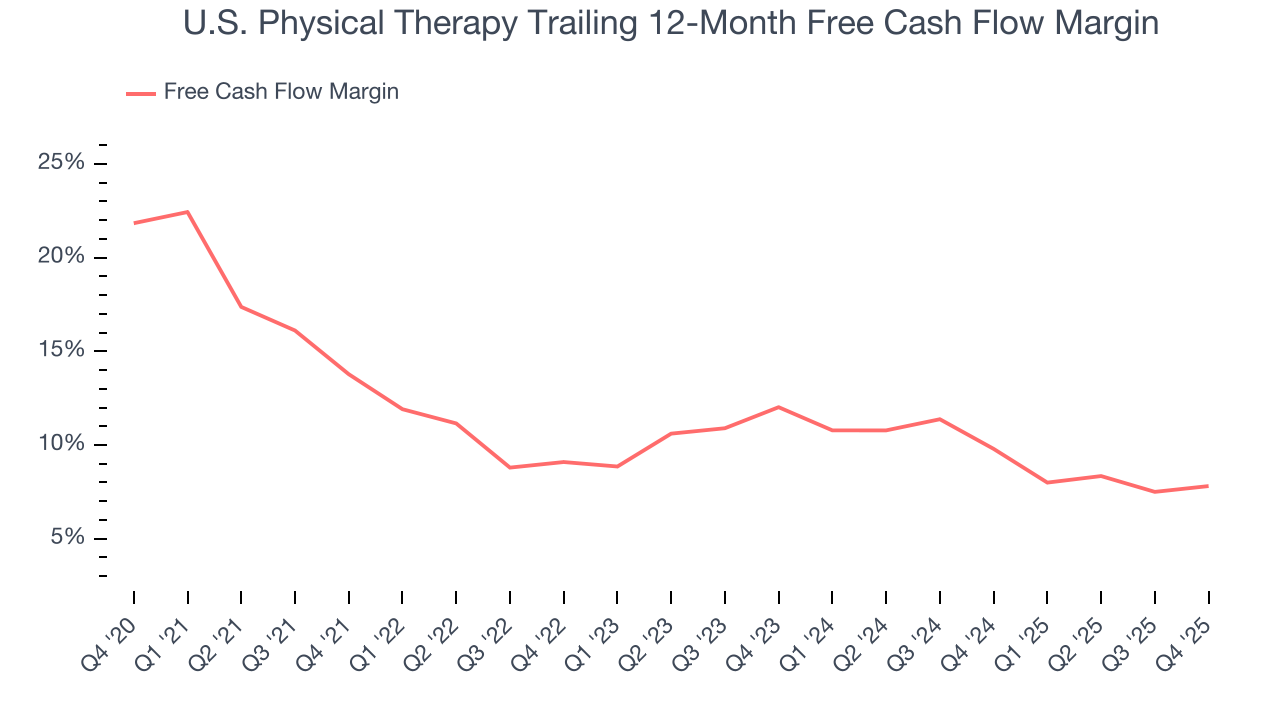
U.S. Physical Therapy’s free cash flow clocked in at $21.01 million in Q4, equivalent to a 10.4% margin. This cash profitability was in line with the comparable period last year and its five-year average.
10. Return on Invested Capital (ROIC)
EPS and free cash flow tell us whether a company was profitable while growing its revenue. But was it capital-efficient? Enter ROIC, a metric showing how much operating profit a company generates relative to the money it has raised (debt and equity).
U.S. Physical Therapy’s management team makes decent investment decisions and generates value for shareholders. Its five-year average ROIC was 10.3%, slightly better than typical healthcare business.
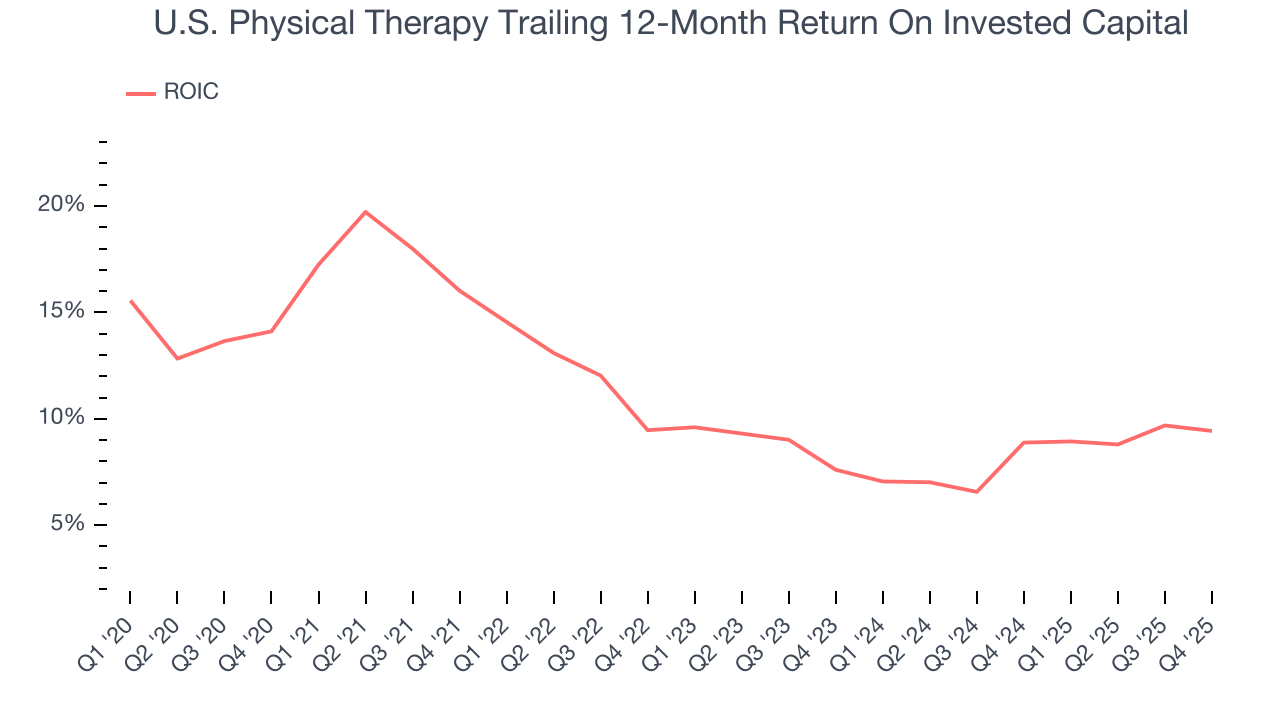
We like to invest in businesses with high returns, but the trend in a company’s ROIC is what often surprises the market and moves the stock price. Over the last few years, U.S. Physical Therapy’s ROIC averaged 3.6 percentage point decreases each year. We like what management has done in the past, but its declining returns are perhaps a symptom of fewer profitable growth opportunities.
11. Balance Sheet Assessment
U.S. Physical Therapy reported $35.57 million of cash and $273 million of debt on its balance sheet in the most recent quarter. As investors in high-quality companies, we primarily focus on two things: 1) that a company’s debt level isn’t too high and 2) that its interest payments are not excessively burdening the business.
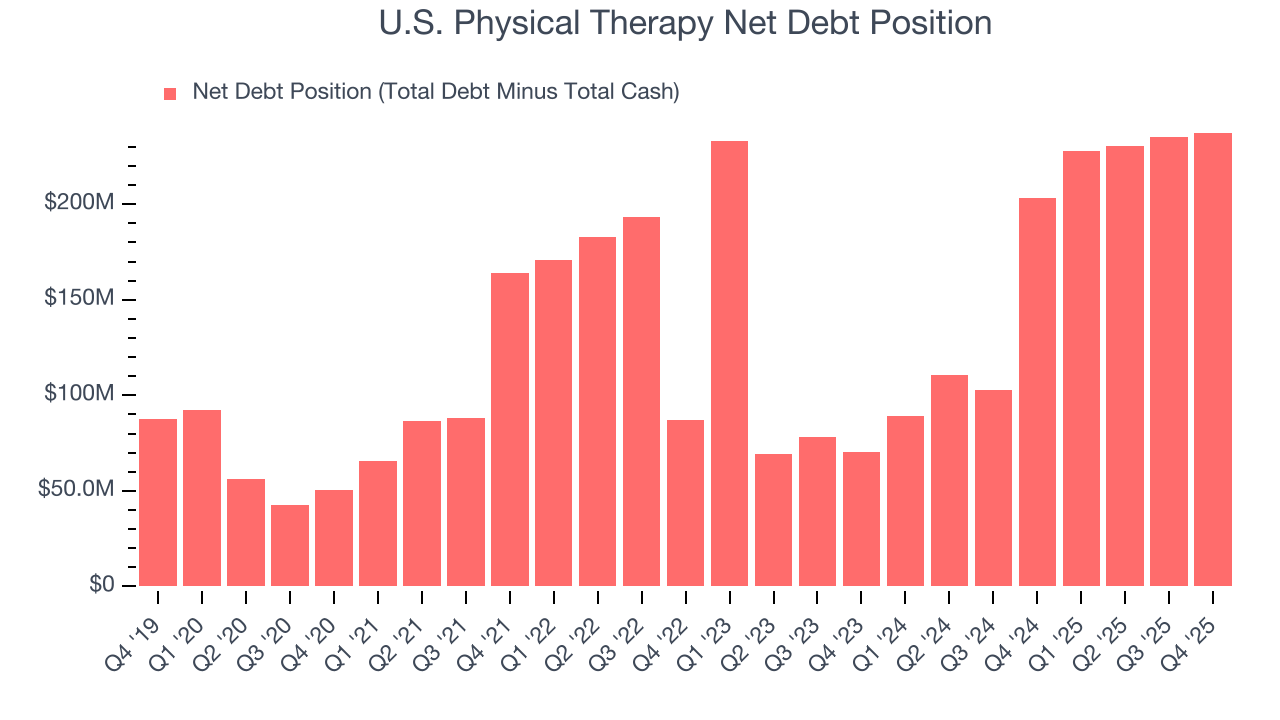
With $95.01 million of EBITDA over the last 12 months, we view U.S. Physical Therapy’s 2.5× net-debt-to-EBITDA ratio as safe. We also see its $9.35 million of annual interest expenses as appropriate. The company’s profits give it plenty of breathing room, allowing it to continue investing in growth initiatives.
12. Key Takeaways from U.S. Physical Therapy’s Q4 Results
It was encouraging to see U.S. Physical Therapy beat analysts’ revenue expectations this quarter. On the other hand, its EPS was in line. Overall, this print had some key positives. The stock remained flat at $79.15 immediately after reporting.
13. Is Now The Time To Buy U.S. Physical Therapy?
Updated: March 22, 2026 at 12:06 AM EDT
The latest quarterly earnings matters, sure, but we actually think longer-term fundamentals and valuation matter more. Investors should consider all these pieces before deciding whether or not to invest in U.S. Physical Therapy.
U.S. Physical Therapy’s business quality ultimately falls short of our standards. Although its revenue growth was solid over the last five years, it’s expected to deteriorate over the next 12 months and its subscale operations give it fewer distribution channels than its larger rivals. And while the company’s growth in patient visits was splendid, the downside is its unimpressive EPS growth over the last five years shows it’s failed to produce meaningful profits for shareholders.
U.S. Physical Therapy’s P/E ratio based on the next 12 months is 25.8x. This multiple tells us a lot of good news is priced in - we think there are better stocks to buy right now.
Wall Street analysts have a consensus one-year price target of $104 on the company (compared to the current share price of $73.83).
Although the price target is bullish, readers should exercise caution because analysts tend to be overly optimistic. The firms they work for, often big banks, have relationships with companies that extend into fundraising, M&A advisory, and other rewarding business lines. As a result, they typically hesitate to say bad things for fear they will lose out. We at StockStory do not suffer from such conflicts of interest, so we’ll always tell it like it is.