
Verizon (VZ)
Verizon keeps us up at night. Its sales have underperformed and its low returns on capital show it has few growth opportunities.― StockStory Analyst Team
1. News


2. Summary
Why We Think Verizon Will Underperform
Formed in 1984 as Bell Atlantic after the breakup of Bell System into seven companies, Verizon (NYSE:VZ) is a telecom giant providing a range of communications and internet services.
- Annual sales growth of 1.5% over the last five years lagged behind its consumer discretionary peers as its large revenue base made it difficult to generate incremental demand
- Performance over the past five years shows its incremental sales were less profitable as its earnings per share were flat
- Low free cash flow margin gives it little breathing room, constraining its ability to self-fund growth or return capital to shareholders


Verizon lacks the business quality we seek. There are more appealing investments to be made.
Why There Are Better Opportunities Than Verizon


Verizon is trading at $50.31 per share, or 10.3x forward P/E. Verizon’s valuation may seem like a bargain, especially when stacked up against other consumer discretionary companies. We remind you that you often get what you pay for, though.
Cheap stocks can look like great bargains at first glance, but you often get what you pay for. These mediocre businesses often have less earnings power, meaning there is more reliance on a re-rating to generate good returns - an unlikely scenario for low-quality companies.
3. Verizon (VZ) Research Report: Q4 CY2025 Update
Telecommunications giant Verizon (NYSE:VZ) announced better-than-expected revenue in Q4 CY2025, with sales up 2% year on year to $36.38 billion. Its non-GAAP profit of $1.09 per share was 3.3% above analysts’ consensus estimates.
Verizon (VZ) Q4 CY2025 Highlights:
- Revenue: $36.38 billion vs analyst estimates of $36.14 billion (2% year-on-year growth, 0.7% beat)
- Adjusted EPS: $1.09 vs analyst estimates of $1.06 (3.3% beat)
- Operating Margin: 13.8%, down from 20.8% in the same quarter last year
- Free Cash Flow Margin: 12%, down from 15% in the same quarter last year
- Market Capitalization: $167.9 billion
Company Overview
Formed in 1984 as Bell Atlantic after the breakup of Bell System into seven companies, Verizon (NYSE:VZ) is a telecom giant providing a range of communications and internet services.
In 2000, Bell Atlantic acquired GTE, a telecomm company with a footprint where Bell wasn’t. The combined company changed its name to Verizon, a combination of of veritas (Latin for "truth") and horizon. One more recent major acquisition was TracFone in 2021 TracFone is a leading provider of prepaid wireless services in the US, and it added roughly 20 million subscribers to Verizon's base, which is why you'll see a big jump in the customer chart below.
Verizon’s offerings range from wireless voice and data services to high-speed internet products. For example, its flagship wireless service provides nationwide 5G voice, data, and mobile broadband services sold to both consumers and businesses. Verizon also offers Fios, its fiber-optic internet, TV, and phone service, primarily catering to residential users. The company also provides network and communications solutions for businesses, including Internet of Things (IoT) connectivity, cybersecurity, and cloud services.
Verizon generates the majority of its revenue through subscription-based services, particularly from its wireless business. Customers pay monthly fees for access to mobile networks, data plans, and bundled services. This recurring revenue model provides consistent cash flow for the company. In addition, Verizon makes money from the sale of devices such as smartphones and tablets, often bundled with service plans, though the margin on these products is lower compared to its service revenue. Business services, such as cloud and security solutions, also contribute to Verizon’s revenue, particularly in enterprise segments.
4. Wireless, Cable and Satellite
The massive physical footprints of cell phone towers, fiber in the ground, or satellites in space make it challenging for companies in this industry to adjust to shifting consumer habits. Over the last decade-plus, consumers have ‘cut the cord’ to their landlines and traditional cable subscriptions in favor of wireless communications and streaming video. These trends do mean that more households need cell phone plans and high-speed internet. Companies that successfully serve customers can enjoy high retention rates and pricing power since the options for mobile and internet connectivity in any geography are usually limited.
Competitors in the telecommunications industry include AT&T (NYSE:T), T-Mobile (NASDAQ:TMUS), and Comcast (NASDAQ:CMCSA).
5. Revenue Growth
A company’s long-term sales performance can indicate its overall quality. Any business can have short-term success, but a top-tier one grows for years. Over the last five years, Verizon grew its sales at a weak 1.5% compounded annual growth rate. This fell short of our benchmarks and is a tough starting point for our analysis.
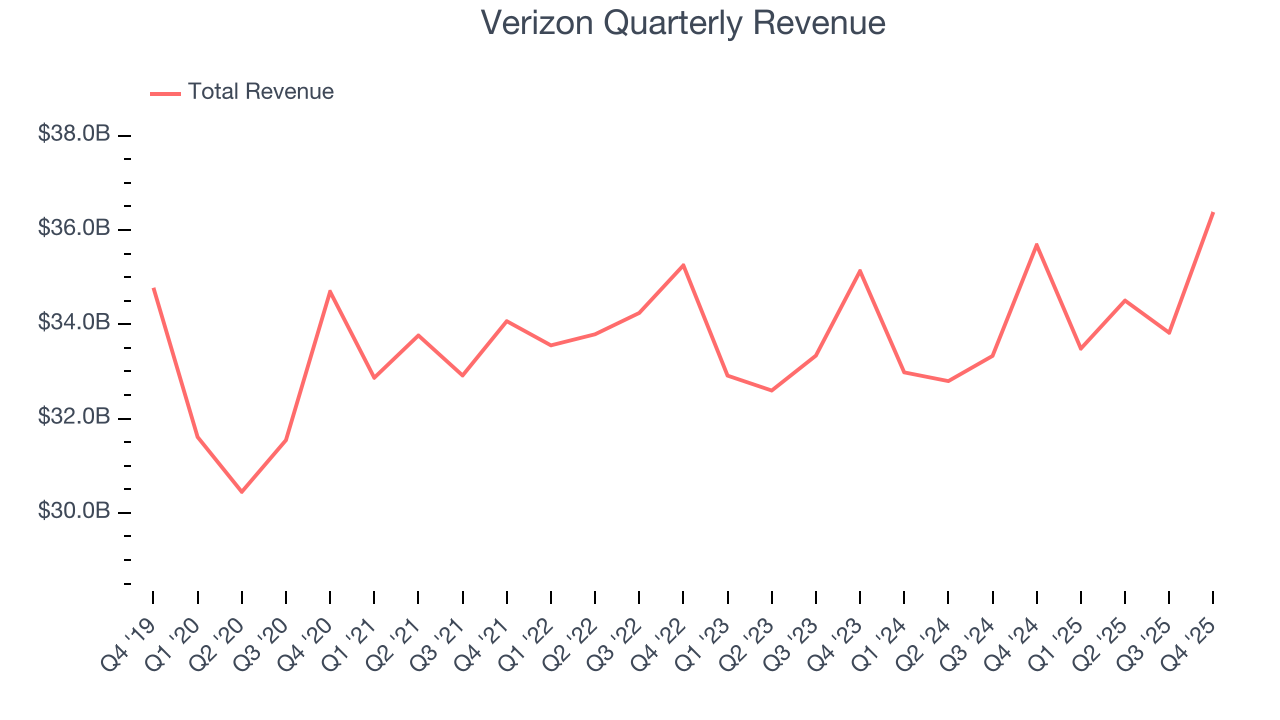
We at StockStory place the most emphasis on long-term growth, but within consumer discretionary, a stretched historical view may miss a company riding a successful new product or trend. Verizon’s annualized revenue growth of 1.6% over the last two years aligns with its five-year trend, suggesting its demand was consistently weak. 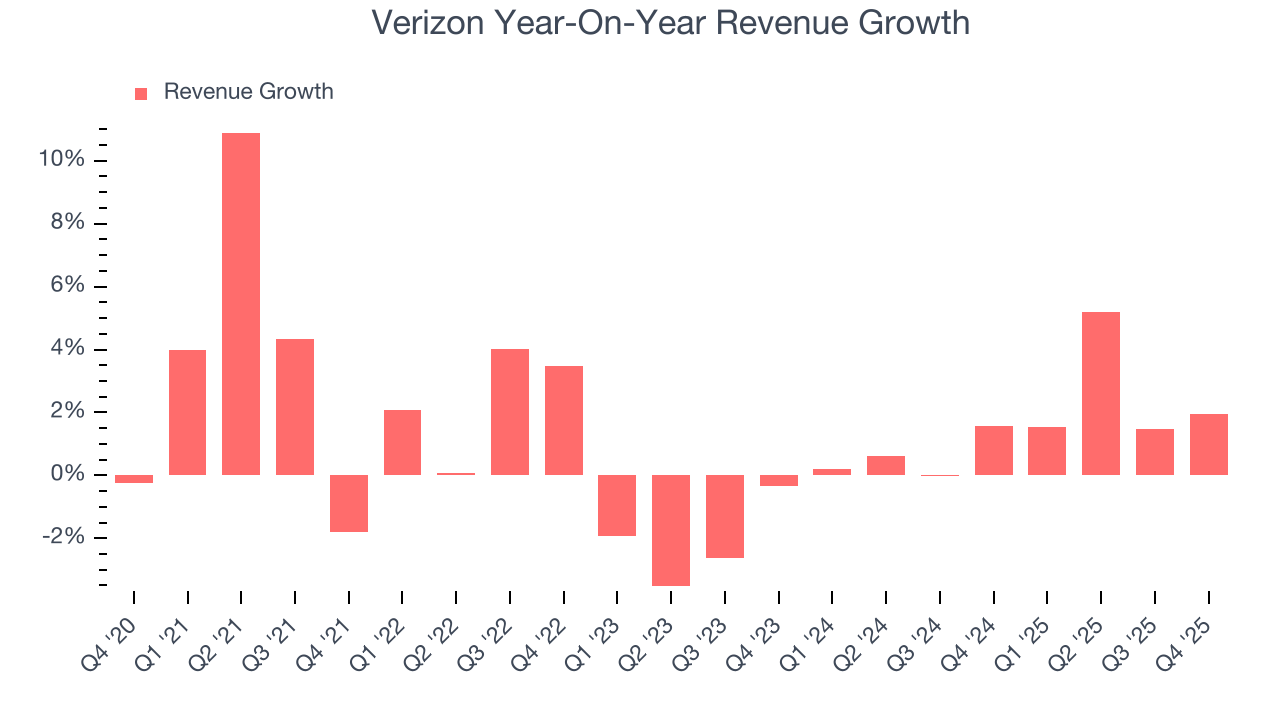
This quarter, Verizon reported modest year-on-year revenue growth of 2% but beat Wall Street’s estimates by 0.7%.
Looking ahead, sell-side analysts expect revenue to grow 2.5% over the next 12 months, similar to its two-year rate. This projection doesn't excite us and suggests its newer products and services will not lead to better top-line performance yet.
6. Operating Margin
Verizon’s operating margin might fluctuated slightly over the last 12 months but has generally stayed the same, averaging 21.2% over the last two years. This profitability was lousy for a consumer discretionary business and caused by its suboptimal cost structure.
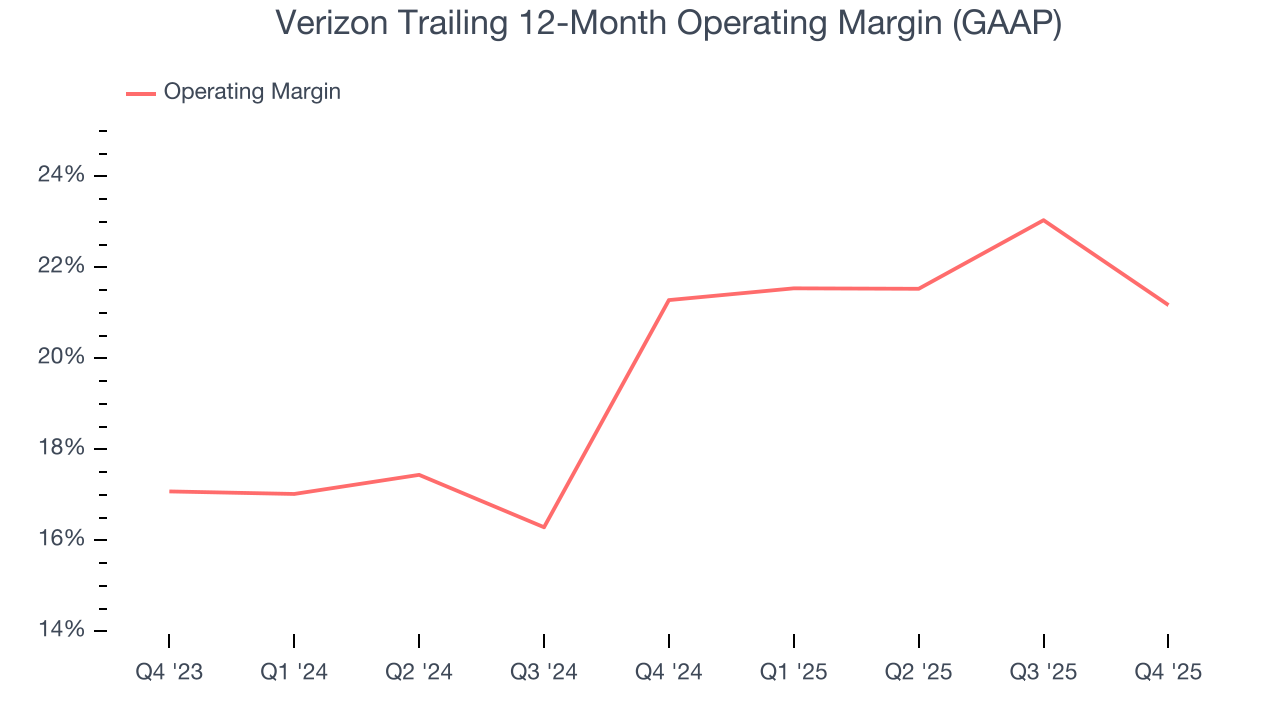
This quarter, Verizon generated an operating margin profit margin of 13.8%, down 7 percentage points year on year. This contraction shows it was less efficient because its expenses grew faster than its revenue.
7. Earnings Per Share
Revenue trends explain a company’s historical growth, but the long-term change in earnings per share (EPS) points to the profitability of that growth – for example, a company could inflate its sales through excessive spending on advertising and promotions.
Verizon’s flat EPS over the last five years was below its 1.5% annualized revenue growth. This tells us the company became less profitable on a per-share basis as it expanded.
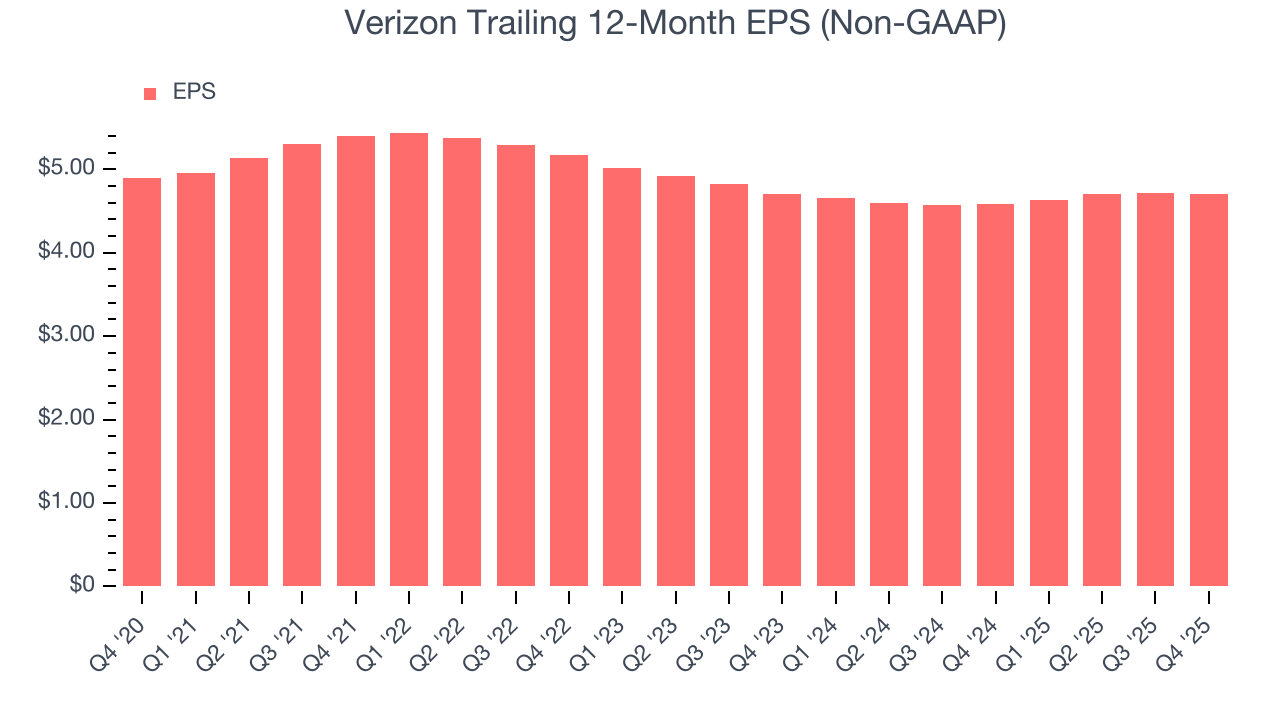
In Q4, Verizon reported adjusted EPS of $1.09, down from $1.10 in the same quarter last year. Despite falling year on year, this print beat analysts’ estimates by 3.3%. Over the next 12 months, Wall Street expects Verizon’s full-year EPS of $4.71 to grow 1%.
8. Cash Is King
Although earnings are undoubtedly valuable for assessing company performance, we believe cash is king because you can’t use accounting profits to pay the bills.
Verizon has shown poor cash profitability over the last two years, giving the company limited opportunities to return capital to shareholders. Its free cash flow margin averaged 14.6%, lousy for a consumer discretionary business.
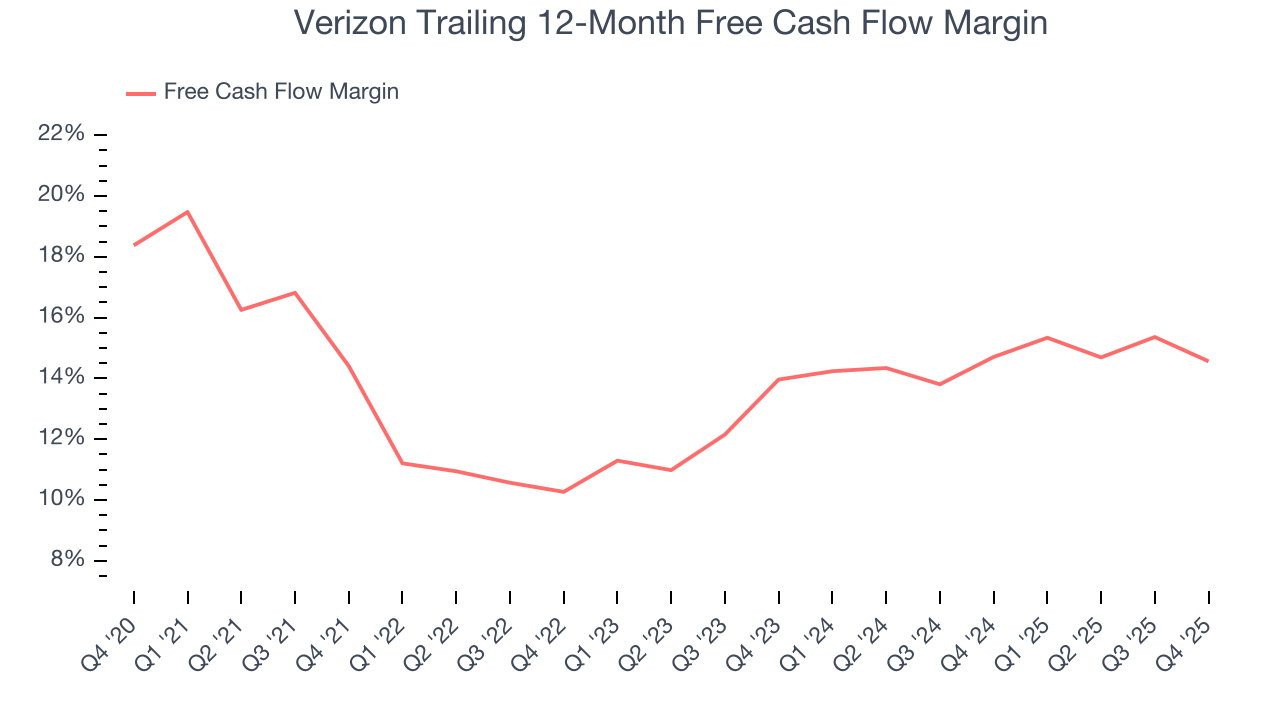
Verizon’s free cash flow clocked in at $4.37 billion in Q4, equivalent to a 12% margin. The company’s cash profitability regressed as it was 3 percentage points lower than in the same quarter last year, prompting us to pay closer attention. Short-term fluctuations typically aren’t a big deal because investment needs can be seasonal, but we’ll be watching to see if the trend extrapolates into future quarters.
Over the next year, analysts’ consensus estimates show they’re expecting Verizon’s free cash flow margin of 14.6% for the last 12 months to remain the same.
9. Return on Invested Capital (ROIC)
EPS and free cash flow tell us whether a company was profitable while growing its revenue. But was it capital-efficient? A company’s ROIC explains this by showing how much operating profit it makes compared to the money it has raised (debt and equity).
Verizon historically did a mediocre job investing in profitable growth initiatives. Its five-year average ROIC was 9.7%, somewhat low compared to the best consumer discretionary companies that consistently pump out 25%+.
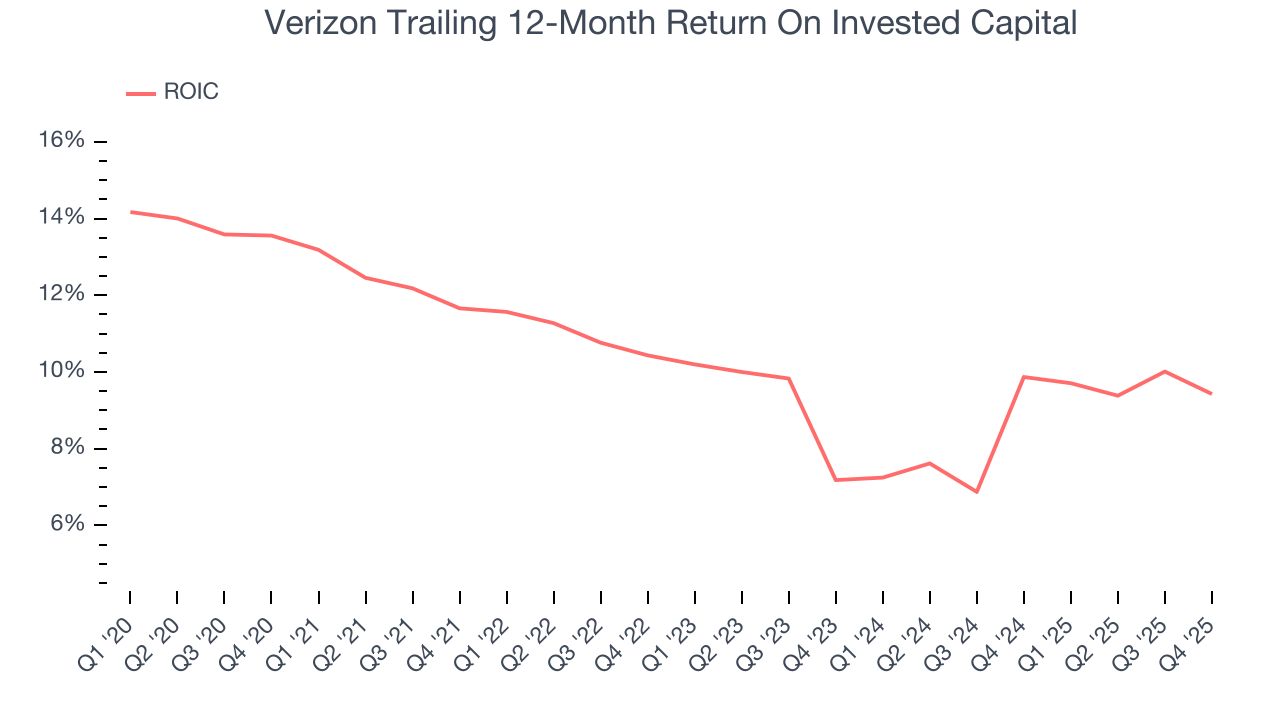
We like to invest in businesses with high returns, but the trend in a company’s ROIC is what often surprises the market and moves the stock price. On average, Verizon’s ROIC decreased by 1.4 percentage points annually over the last few years. Paired with its already low returns, these declines suggest its profitable growth opportunities are few and far between.
10. Balance Sheet Assessment
Verizon reported $19.05 billion of cash and $181.6 billion of debt on its balance sheet in the most recent quarter. As investors in high-quality companies, we primarily focus on two things: 1) that a company’s debt level isn’t too high and 2) that its interest payments are not excessively burdening the business.
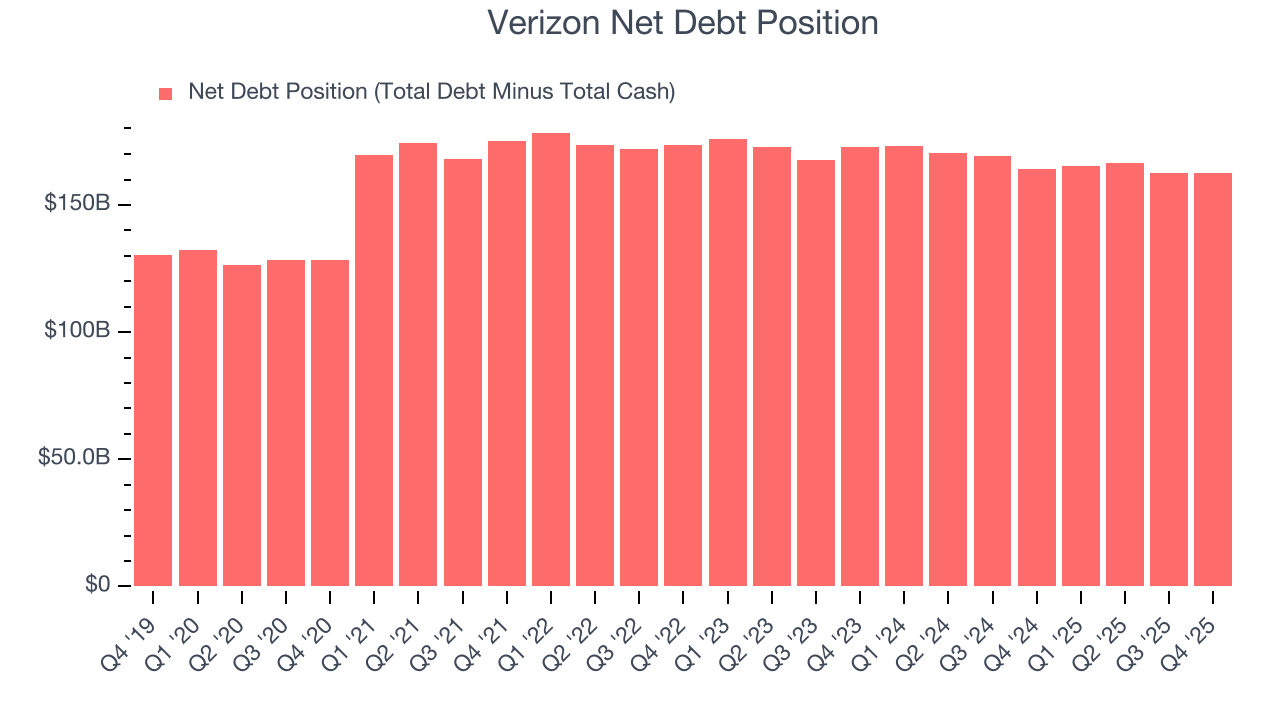
With $50 billion of EBITDA over the last 12 months, we view Verizon’s 3.3× net-debt-to-EBITDA ratio as safe. We also see its $2.99 billion of annual interest expenses as appropriate. The company’s profits give it plenty of breathing room, allowing it to continue investing in growth initiatives.
11. Key Takeaways from Verizon’s Q4 Results
It was good to see Verizon beat analysts’ revenue and EPS expectations this quarter. Zooming out, we think this was a decent quarter. The stock traded up 3.8% to $41.32 immediately following the results.
12. Is Now The Time To Buy Verizon?
Updated: March 29, 2026 at 11:44 PM EDT
A common mistake we notice when investors are deciding whether to buy a stock or not is that they simply look at the latest earnings results. Business quality and valuation matter more, so we urge you to understand these dynamics as well.
Verizon falls short of our quality standards. On top of that, Verizon’s Forecasted free cash flow margin for next year suggests the company will fail to improve its cash conversion, and its weak EPS growth over the last five years shows it’s failed to produce meaningful profits for shareholders.
Verizon’s P/E ratio based on the next 12 months is 10.3x. This valuation multiple is fair, but we don’t have much confidence in the company. There are superior stocks to buy right now.
Wall Street analysts have a consensus one-year price target of $50.99 on the company (compared to the current share price of $50.31).