
XPO (XPO)
XPO is up against the odds. Not only are its sales cratering but also its low returns on capital suggest it struggles to generate profits.― StockStory Analyst Team
1. News


2. Summary
Why We Think XPO Will Underperform
Owning a mobile game simulating freight operations for the Tour de France, XPO (NYSE:XPO) is a transportation company specializing in expedited shipping services.
- Products and services are facing significant end-market challenges during this cycle as sales have declined by 1.4% annually over the last five years
- Gross margin of 14.7% reflects its high production costs
- Ability to fund investments or reward shareholders with increased buybacks or dividends is restricted by its weak free cash flow margin of 1.7% for the last five years


XPO’s quality is not up to our standards. There are more promising alternatives.
Why There Are Better Opportunities Than XPO


At $177.01 per share, XPO trades at 42.5x forward P/E. This valuation multiple seems a bit much considering the tepid revenue growth profile.
There are stocks out there featuring similar valuation multiples with better fundamentals. We prefer to invest in those.
3. XPO (XPO) Research Report: Q4 CY2025 Update
Freight delivery company XPO (NYSE:XPO) reported Q4 CY2025 results topping the market’s revenue expectations, with sales up 4.7% year on year to $2.01 billion. Its non-GAAP profit of $0.88 per share was 15.3% above analysts’ consensus estimates.
XPO (XPO) Q4 CY2025 Highlights:
- Revenue: $2.01 billion vs analyst estimates of $1.95 billion (4.7% year-on-year growth, 2.9% beat)
- Adjusted EPS: $0.88 vs analyst estimates of $0.76 (15.3% beat)
- Adjusted EBITDA: $312 million vs analyst estimates of $295.5 million (15.5% margin, 5.6% beat)
- Operating Margin: 7.1%, in line with the same quarter last year
- Free Cash Flow Margin: 6%, down from 7.2% in the same quarter last year
- Market Capitalization: $21.08 billion
Company Overview
Owning a mobile game simulating freight operations for the Tour de France, XPO (NYSE:XPO) is a transportation company specializing in expedited shipping services.
The company was renamed from Express-1 to XPO in 2011 when it was acquired by a serial founder and investor, Brad Jacobs. XPO is the seventh billion-dollar company Jacobs has led, and a common theme tying his investments together is M&A.
XPO was no different, and when making acquisitions, the company originally targeted smaller companies to enhance its existing services and extract cost efficiencies. As it expanded, it began acquiring larger companies to enter new markets and geographic regions. Specifically, the $3.56 billion acquisition of Norbert Dentressangle (2015) expanded its presence in Europe and the $3 billion acquisition of Con-way (2015) strengthened XPO’s less-than-truckload (LTL), full truckload, and multimodal freight transportation services.
Today, XPO offers delivery services for various businesses across the United States and North America. On the less-than-truckload (LTL) side, deliveries are made by collecting smaller shipments from various customers, combining them at a central hub, and then transporting them with its own fleet of trucks. Conversely, its full truckload (FTL) business handles larger shipments from a single customer, filling an entire truck, and transporting it directly to the destination without consolidation or additional stops. Some other services include multimodal freight transport and last-mile delivery, which consist of using multiple forms of transportation like trucks, trains, and ships to move goods and deliver goods from a distribution center or hub directly to the customer's location.
The company engages in various types of contracts with its customers, which can include short-term agreements for specific shipments or longer-term contracts. These contracts are dependent on the mode of transportation. FTL contracts include fixed rates per mile or load with additional fuel surcharges while LTL contracts feature pricing based on factors like weight, volume, and distance. For multimodal transport contracts, pricing involves fees for coordinating different transportation modes. Last-mile delivery contracts on the other hand offer fixed pricing for standard routes and variable pricing based on urgency and distance.
4. Ground Transportation
The growth of e-commerce and global trade continues to drive demand for shipping services, especially last-mile delivery, presenting opportunities for ground transportation companies. The industry continues to invest in data, analytics, and autonomous fleets to optimize efficiency and find the most cost-effective routes. Despite the essential services this industry provides, ground transportation companies are still at the whim of economic cycles. Consumer spending, for example, can greatly impact the demand for these companies’ offerings while fuel costs can influence profit margins.
Competitors offering similar products include FedEx (NYSE:FDX), UPS (NYSE:UPS), and Old Dominion (NASDAQ:ODFL).
5. Revenue Growth
Reviewing a company’s long-term sales performance reveals insights into its quality. Any business can have short-term success, but a top-tier one grows for years. Over the last five years, XPO grew its sales at a tepid 5.7% compounded annual growth rate. This fell short of our benchmark for the industrials sector and is a poor baseline for our analysis.
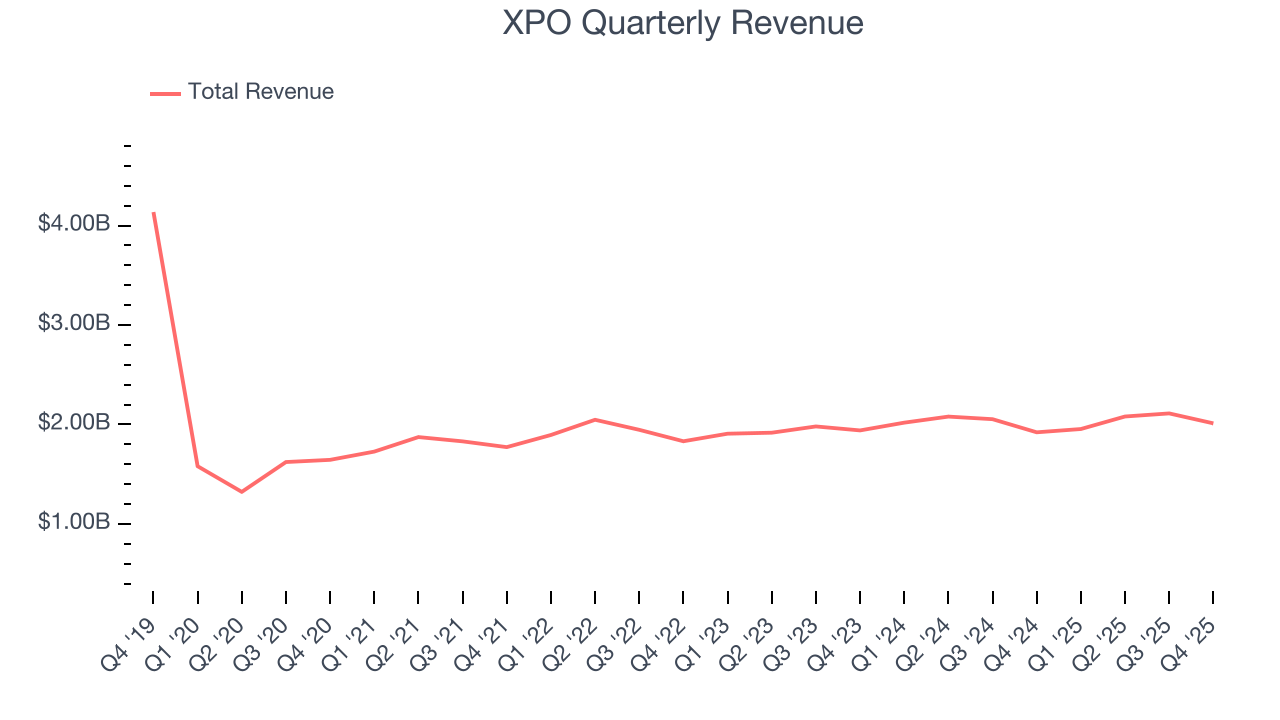
We at StockStory place the most emphasis on long-term growth, but within industrials, a half-decade historical view may miss cycles, industry trends, or a company capitalizing on catalysts such as a new contract win or a successful product line. XPO’s recent performance shows its demand has slowed as its annualized revenue growth of 2.6% over the last two years was below its five-year trend. 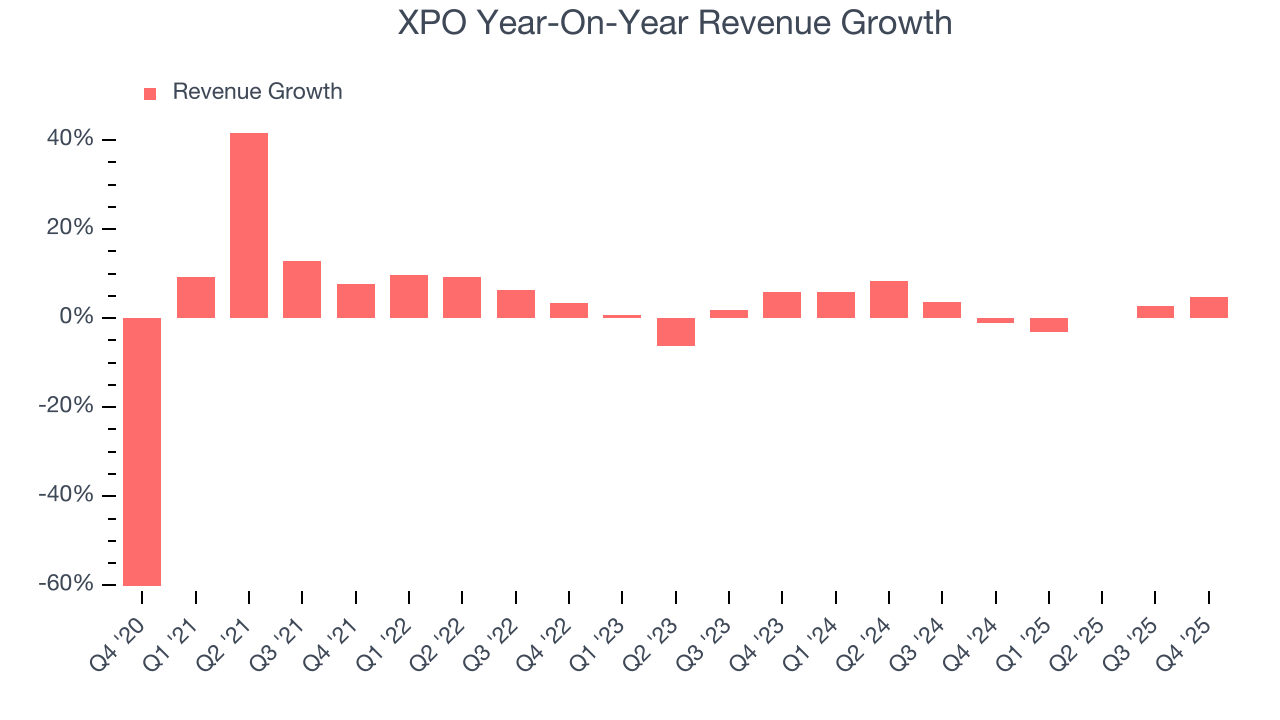
We can better understand the company’s revenue dynamics by analyzing its most important segments, North American Less-Than-Truckload and European Transportation , which are 57.9% and 42.1% of revenue. Over the last two years, XPO’s North American Less-Than-Truckload revenue (freight services) averaged 1.9% year-on-year growth while its European Transportation revenue (truckload, less-than-truckload, and truck brokerage) averaged 4.1% growth. 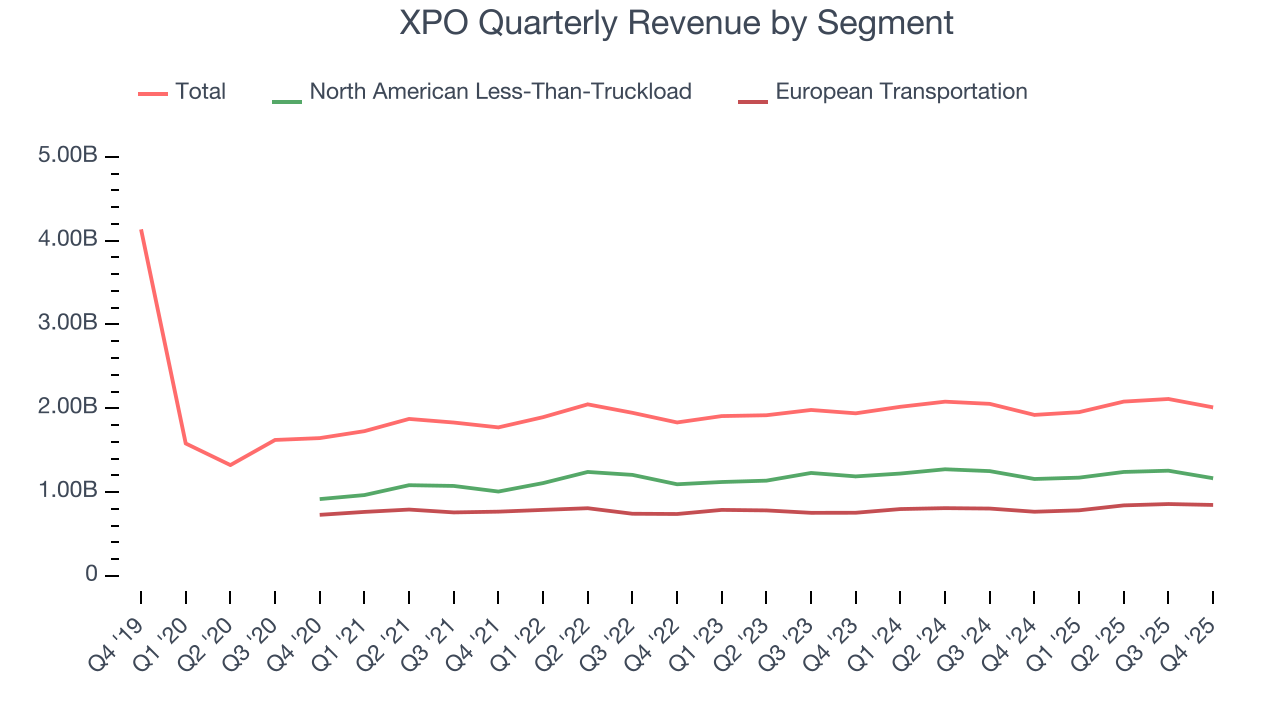
This quarter, XPO reported modest year-on-year revenue growth of 4.7% but beat Wall Street’s estimates by 2.9%.
Looking ahead, sell-side analysts expect revenue to grow 2.6% over the next 12 months, similar to its two-year rate. This projection is underwhelming and implies its newer products and services will not catalyze better top-line performance yet.
6. Gross Margin & Pricing Power
XPO has bad unit economics for an industrials business, signaling it operates in a competitive market. As you can see below, it averaged a 17.3% gross margin over the last five years. Said differently, XPO had to pay a chunky $82.68 to its suppliers for every $100 in revenue. 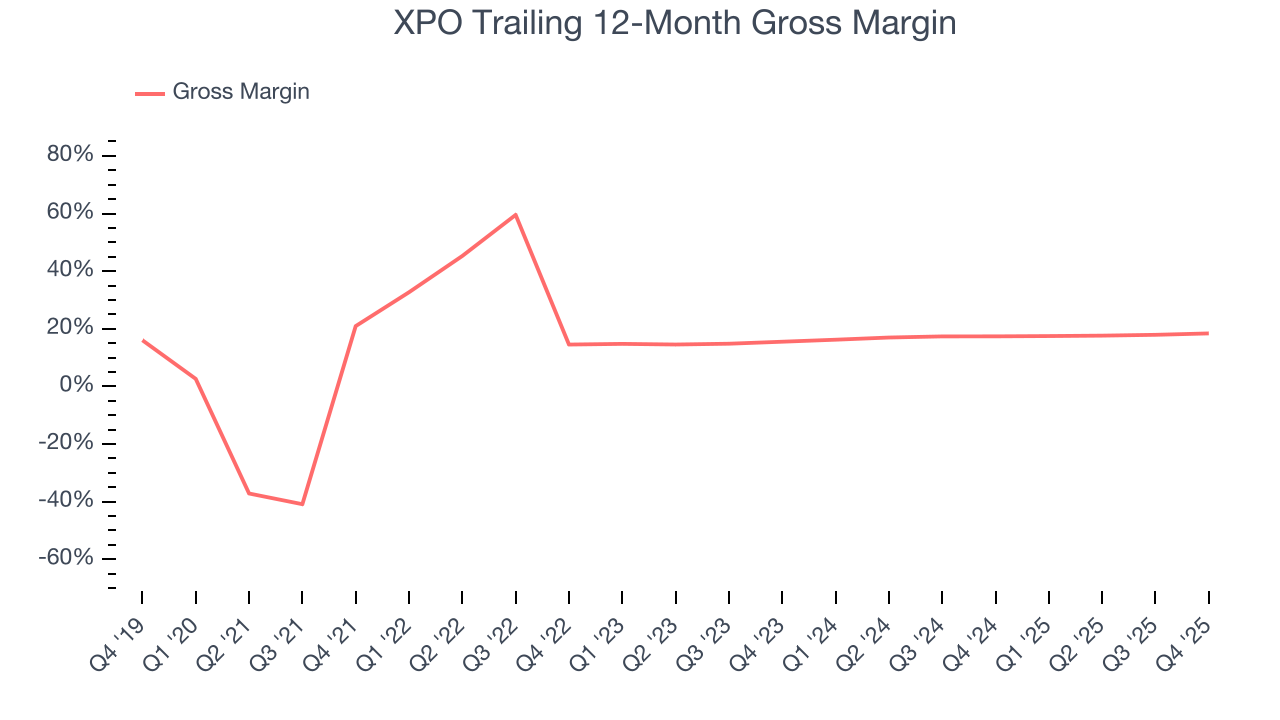
XPO’s gross profit margin came in at 18.2% this quarter, marking a 2.1 percentage point increase from 16.2% in the same quarter last year. XPO’s full-year margin has also been trending up over the past 12 months, increasing by 1 percentage points. If this move continues, it could suggest better unit economics due to more leverage from its growing sales on the fixed portion of its cost of goods sold (such as manufacturing expenses).
7. Operating Margin
Operating margin is a key measure of profitability. Think of it as net income - the bottom line - excluding the impact of taxes and interest on debt, which are less connected to business fundamentals.
XPO was profitable over the last five years but held back by its large cost base. Its average operating margin of 6.3% was weak for an industrials business. This result isn’t too surprising given its low gross margin as a starting point.
On the plus side, XPO’s operating margin rose by 3.7 percentage points over the last five years, as its sales growth gave it operating leverage.
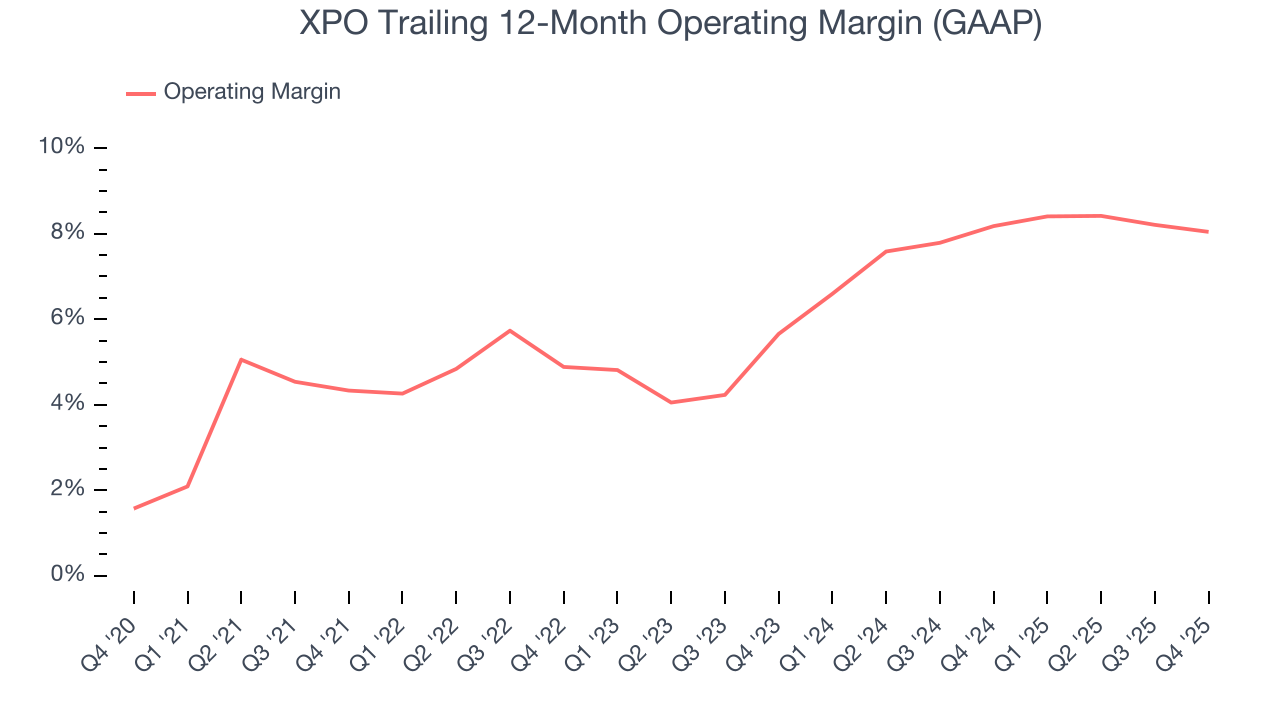
This quarter, XPO generated an operating margin profit margin of 7.1%, in line with the same quarter last year. This indicates the company’s cost structure has recently been stable.
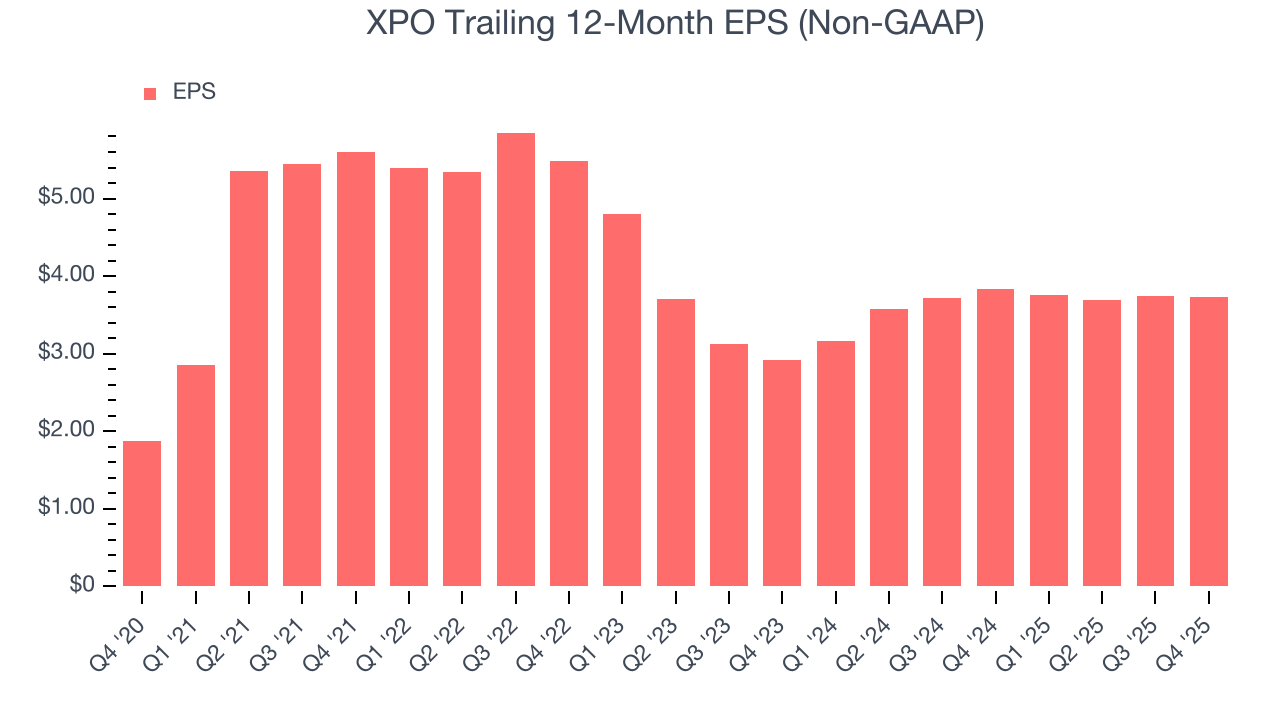
8. Earnings Per Share
We track the long-term change in earnings per share (EPS) for the same reason as long-term revenue growth. Compared to revenue, however, EPS highlights whether a company’s growth is profitable.
XPO’s EPS grew at a spectacular 14.8% compounded annual growth rate over the last five years, higher than its 5.7% annualized revenue growth. This tells us the company became more profitable on a per-share basis as it expanded.
We can take a deeper look into XPO’s earnings to better understand the drivers of its performance. As we mentioned earlier, XPO’s operating margin was flat this quarter but expanded by 3.7 percentage points over the last five years. This was the most relevant factor (aside from the revenue impact) behind its higher earnings; interest expenses and taxes can also affect EPS but don’t tell us as much about a company’s fundamentals.
Like with revenue, we analyze EPS over a shorter period to see if we are missing a change in the business.
For XPO, its two-year annual EPS growth of 13% was lower than its five-year trend. We still think its growth was good and hope it can accelerate in the future.
In Q4, XPO reported adjusted EPS of $0.88, down from $0.89 in the same quarter last year. Despite falling year on year, this print easily cleared analysts’ estimates. Over the next 12 months, Wall Street expects XPO’s full-year EPS of $3.73 to grow 13.7%.
9. Cash Is King
If you’ve followed StockStory for a while, you know we emphasize free cash flow. Why, you ask? We believe that in the end, cash is king, and you can’t use accounting profits to pay the bills.
XPO has shown poor cash profitability over the last five years, giving the company limited opportunities to return capital to shareholders. Its free cash flow margin averaged 1.7%, lousy for an industrials business.
Taking a step back, we can see that XPO’s margin dropped by 4 percentage points during that time. It may have ticked higher more recently, but shareholders are likely hoping for its margin to at least revert to its historical level. Almost any movement in the wrong direction is undesirable because of its already low cash conversion. If the longer-term trend returns, it could signal it’s becoming a more capital-intensive business.
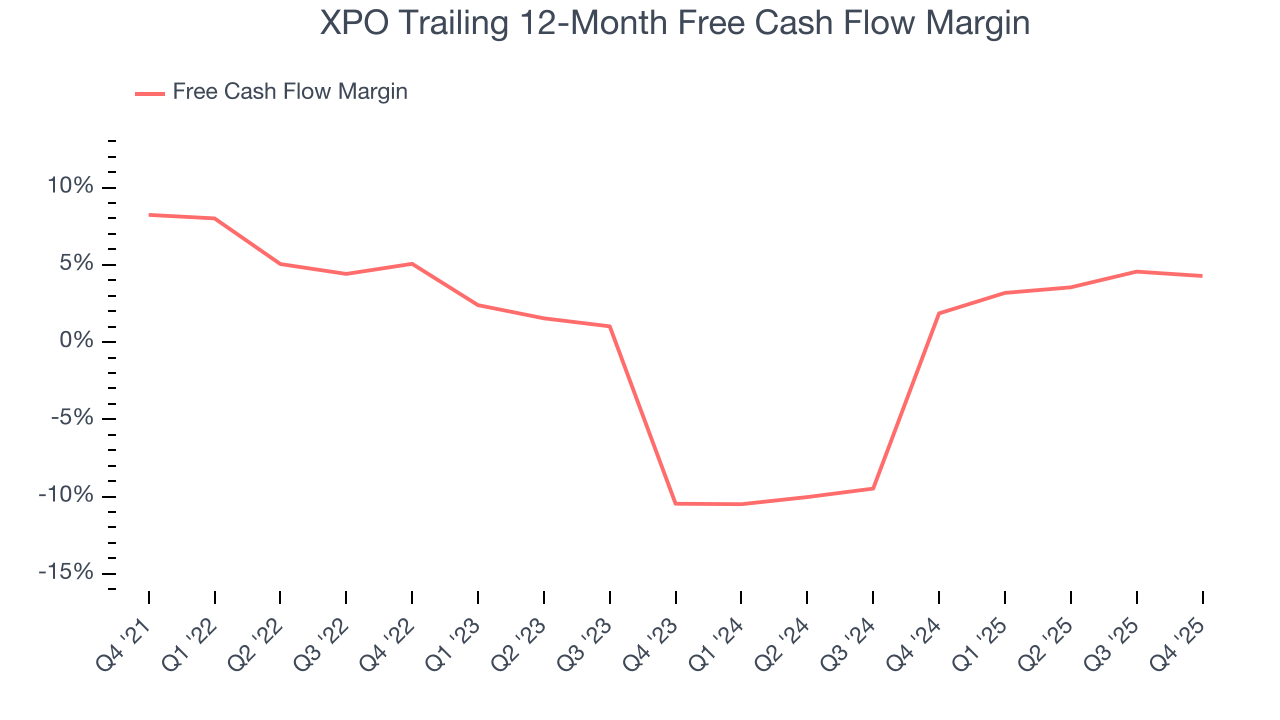
XPO’s free cash flow clocked in at $120 million in Q4, equivalent to a 6% margin. The company’s cash profitability regressed as it was 1.3 percentage points lower than in the same quarter last year, but it’s still above its five-year average. We wouldn’t read too much into this quarter’s decline because investment needs can be seasonal, causing short-term swings. Long-term trends carry greater meaning.
10. Return on Invested Capital (ROIC)
EPS and free cash flow tell us whether a company was profitable while growing its revenue. But was it capital-efficient? A company’s ROIC explains this by showing how much operating profit it makes compared to the money it has raised (debt and equity).
XPO historically did a mediocre job investing in profitable growth initiatives. Its five-year average ROIC was 8.2%, somewhat low compared to the best industrials companies that consistently pump out 20%+.
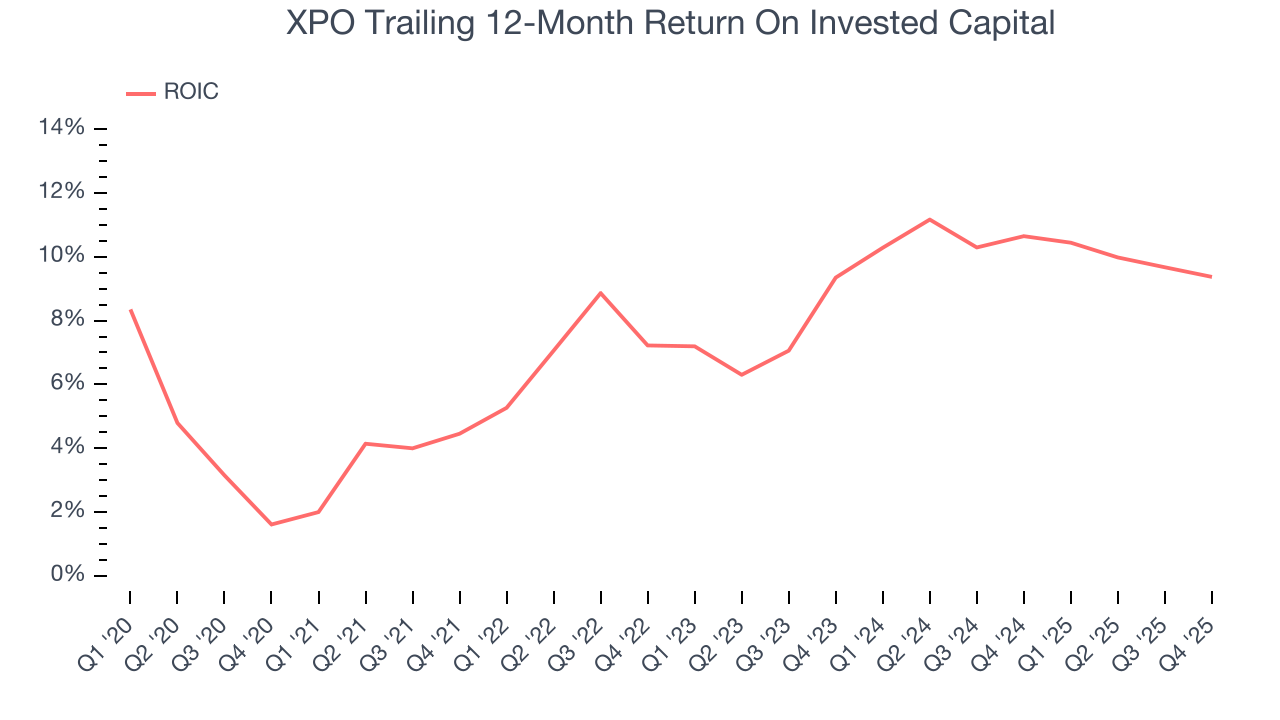
We like to invest in businesses with high returns, but the trend in a company’s ROIC is what often surprises the market and moves the stock price. Over the last few years, XPO’s ROIC averaged 4.2 percentage point increases each year. This is a good sign, and we hope the company can continue improving.
11. Balance Sheet Assessment
XPO reported $310 million of cash and $4.09 billion of debt on its balance sheet in the most recent quarter. As investors in high-quality companies, we primarily focus on two things: 1) that a company’s debt level isn’t too high and 2) that its interest payments are not excessively burdening the business.
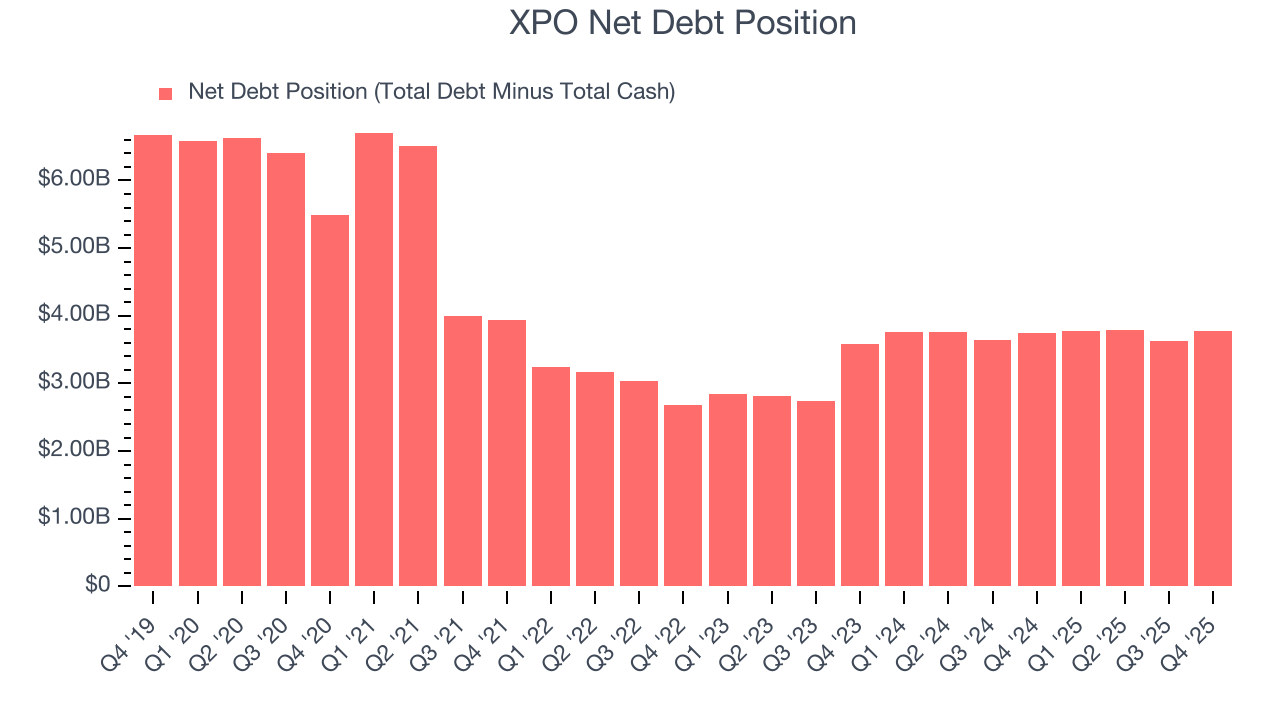
With $1.27 billion of EBITDA over the last 12 months, we view XPO’s 3.0× net-debt-to-EBITDA ratio as safe. We also see its $166 million of annual interest expenses as appropriate. The company’s profits give it plenty of breathing room, allowing it to continue investing in growth initiatives.
12. Key Takeaways from XPO’s Q4 Results
We were impressed by how significantly XPO blew past analysts’ European Transportation revenue expectations this quarter. We were also glad its revenue outperformed Wall Street’s estimates. Zooming out, we think this was a solid print. The market seemed to be hoping for more, and the stock traded down 1.1% to $177.50 immediately following the results.
13. Is Now The Time To Buy XPO?
Updated: February 5, 2026 at 7:23 AM EST
We think that the latest earnings result is only one piece of the bigger puzzle. If you’re deciding whether to own XPO, you should also grasp the company’s longer-term business quality and valuation.
XPO isn’t a terrible business, but it doesn’t pass our bar. First off, its revenue growth was uninspiring over the last five years, and analysts expect its demand to deteriorate over the next 12 months. And while its spectacular EPS growth over the last five years shows its profits are trickling down to shareholders, the downside is its low gross margins indicate some combination of competitive pressures and high production costs. On top of that, its cash profitability fell over the last five years.
XPO’s P/E ratio based on the next 12 months is 42.3x. This valuation tells us it’s a bit of a market darling with a lot of good news priced in - we think there are better opportunities elsewhere.
Wall Street analysts have a consensus one-year price target of $156.08 on the company (compared to the current share price of $177.50), implying they don’t see much short-term potential in XPO.