
NXP Semiconductors (NXPI)
We’re not sold on NXP Semiconductors. Its recent pullback in sales and cash profitability shows it’s struggling to scale down costs as demand fades.― StockStory Analyst Team
1. News


2. Summary
Why NXP Semiconductors Is Not Exciting
Spun off from Dutch electronics giant Philips in 2006, NXP Semiconductors (NASDAQ: NXPI) is a designer and manufacturer of chips used in autos, industrial manufacturing, mobile devices, and communications infrastructure.
- Demand will likely be soft over the next 12 months as Wall Street’s estimates imply tepid growth of 10.6%
- The good news is that its successful business model is illustrated by its impressive operating margin, and its rise over the last five years was fueled by some leverage on its fixed costs


NXP Semiconductors doesn’t fulfill our quality requirements. We believe there are better businesses elsewhere.
Why There Are Better Opportunities Than NXP Semiconductors


NXP Semiconductors’s stock price of $190.73 implies a valuation ratio of 13.7x forward P/E. Yes, this valuation multiple is lower than that of other semiconductor peers, but we’ll remind you that you often get what you pay for.
Cheap stocks can look like great bargains at first glance, but you often get what you pay for. These mediocre businesses often have less earnings power, meaning there is more reliance on a re-rating to generate good returns - an unlikely scenario for low-quality companies.
3. NXP Semiconductors (NXPI) Research Report: Q4 CY2025 Update
Chip manufacturer NXP Semiconductors (NASDAQ: NXPI) announced better-than-expected revenue in Q4 CY2025, with sales up 7.2% year on year to $3.34 billion. Guidance for next quarter’s revenue was better than expected at $3.15 billion at the midpoint, 1.5% above analysts’ estimates. Its non-GAAP profit of $3.35 per share was 1.2% above analysts’ consensus estimates.
NXP Semiconductors (NXPI) Q4 CY2025 Highlights:
- Revenue: $3.34 billion vs analyst estimates of $3.31 billion (7.2% year-on-year growth, 0.7% beat)
- Adjusted EPS: $3.35 vs analyst estimates of $3.31 (1.2% beat)
- Adjusted EBITDA: $1.32 billion vs analyst estimates of $1.29 billion (39.6% margin, 2% beat)
- Revenue Guidance for Q1 CY2026 is $3.15 billion at the midpoint, above analyst estimates of $3.10 billion
- Adjusted EPS guidance for Q1 CY2026 is $2.97 at the midpoint, above analyst estimates of $2.95
- Operating Margin: 22.3%, in line with the same quarter last year
- Free Cash Flow Margin: 23.8%, up from 8.4% in the same quarter last year
- Inventory Days Outstanding: 153, down from 161 in the previous quarter
- Market Capitalization: $56.91 billion
Company Overview
Spun off from Dutch electronics giant Philips in 2006, NXP Semiconductors (NASDAQ: NXPI) is a designer and manufacturer of chips used in autos, industrial manufacturing, mobile devices, and communications infrastructure.
NXPI manufactures high performance Mixed Signal (HPMS) chips, which is a hybrid of digital and analog chips that are used to convert analog signals to digital signals so that digital devices can process them.
NXP IPO-ed in 2010, and merged with Freescale Semiconductor in 2015. That merger made NXPI the leading producer of chips used in autos globally. Its mixed signal chips are used to monitor engines and fuel economy, along with the infotainment systems, and even in the systems that power keyless entry.
NXP is used in Industrial and IoT applications, where its chips power the sensors used in factory automation and smart home devices. Its chips are used to power mobile wallets and fast charging in mobile devices, and secure IDs for uses like RFID tags used to monitor supply chains, and chips in payment cards or passports.
NXPI's peers and competitors include Texas Instruments (NASDAQ:TXN), Skyworks (NASDAQ:SWKS), Infineon (XTRA:IFX), ON Semi (NASDAQ:ON), Microchip Technology (NASDAQ: MCHP) , and Analog Devices (NASDAQ: ADI).
4. Analog Semiconductors
Longer manufacturing duration allows analog chip makers to generate greater efficiencies, leading to structurally higher gross margins than their fabless digital peers. The downside of vertical integration is that cyclicality can be more pronounced for analog chipmakers, as capacity utilization upsides work in reverse during down periods.
5. Revenue Growth
Reviewing a company’s long-term sales performance reveals insights into its quality. Any business can put up a good quarter or two, but the best consistently grow over the long haul. Luckily, NXP Semiconductors’s sales grew at a decent 7.3% compounded annual growth rate over the last five years. Its growth was slightly above the average semiconductor company and shows its offerings resonate with customers. Semiconductors are a cyclical industry, and long-term investors should be prepared for periods of high growth followed by periods of revenue contractions.
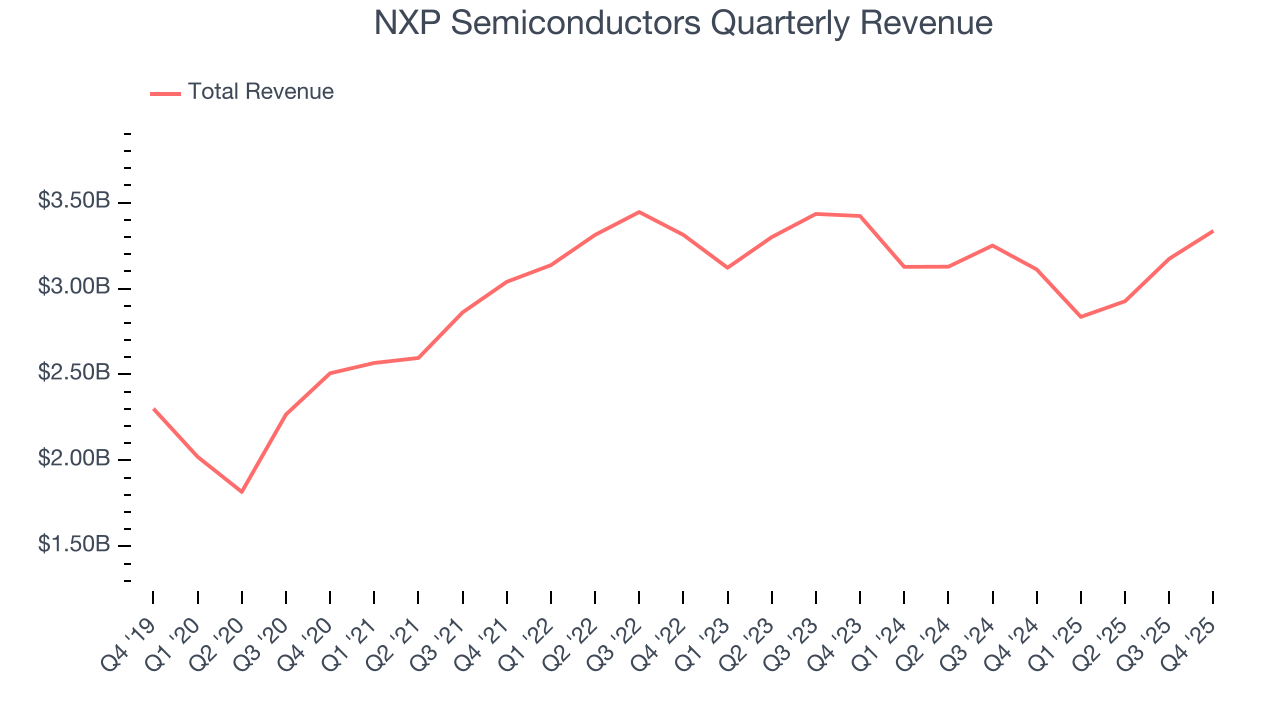
Long-term growth is the most important, but short-term results matter for semiconductors because the rapid pace of technological innovation (Moore's Law) could make yesterday's hit product obsolete today. NXP Semiconductors’s recent performance marks a sharp pivot from its five-year trend as its revenue has shown annualized declines of 3.9% over the last two years. 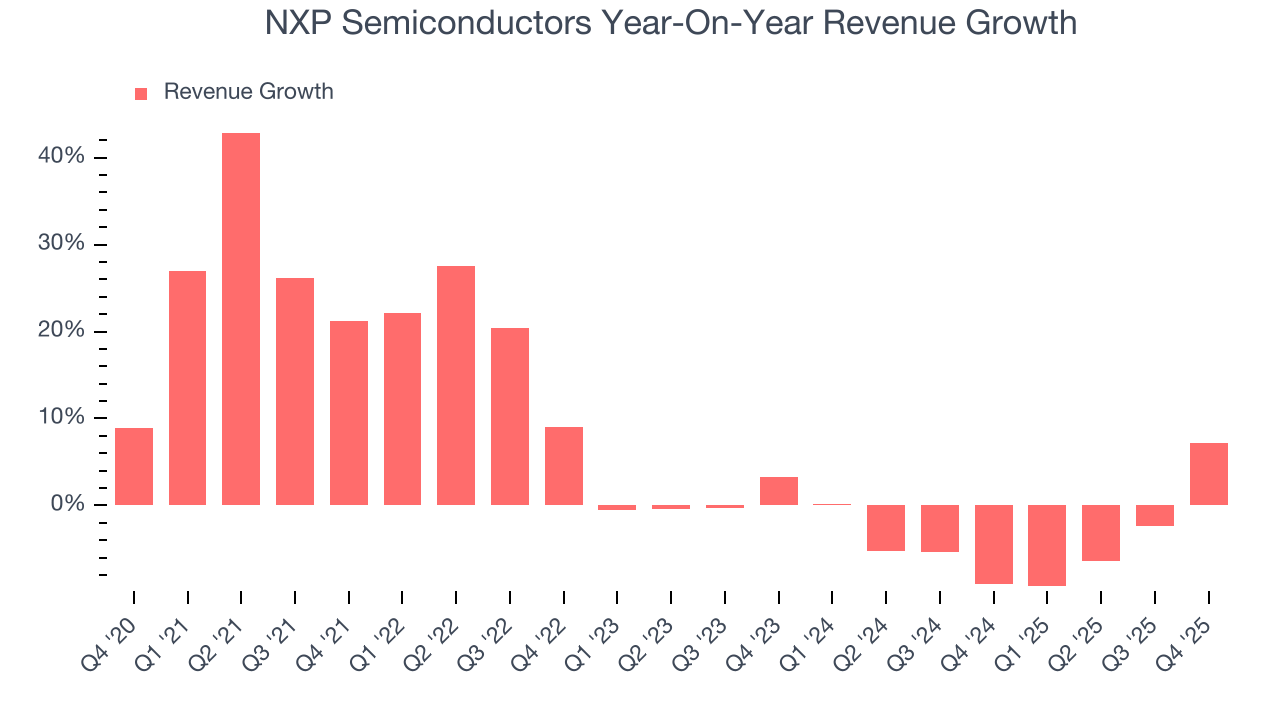
This quarter, NXP Semiconductors reported year-on-year revenue growth of 7.2%, and its $3.34 billion of revenue exceeded Wall Street’s estimates by 0.7%. Adding to the positive news, NXP Semiconductors’s growth inflected positively this quarter, news that will likely give some shareholders hope. Company management is currently guiding for a 11.1% year-on-year increase in sales next quarter.
Looking further ahead, sell-side analysts expect revenue to grow 9.2% over the next 12 months. While this projection implies its newer products and services will fuel better top-line performance, it is still below average for the sector.
6. Product Demand & Outstanding Inventory
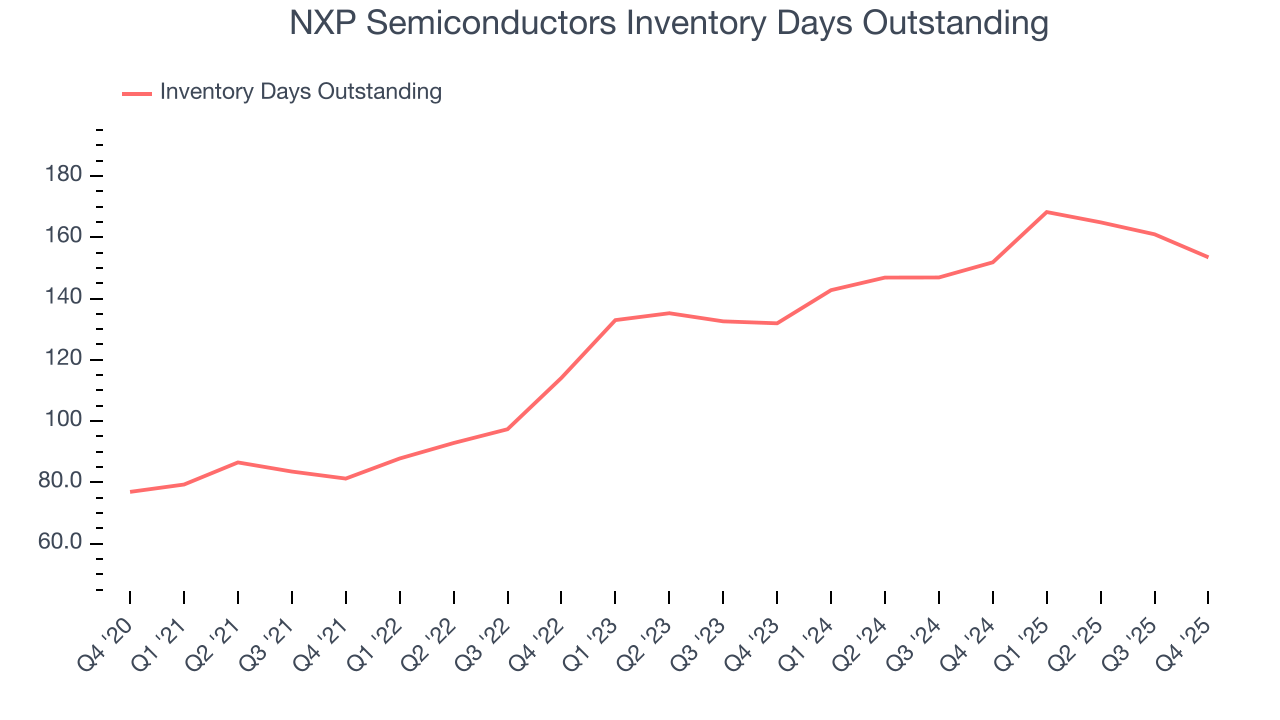
Days Inventory Outstanding (DIO) is an important metric for chipmakers, as it reflects a business’ capital intensity and the cyclical nature of semiconductor supply and demand. In a tight supply environment, inventories tend to be stable, allowing chipmakers to exert pricing power. Steadily increasing DIO can be a warning sign that demand is weak, and if inventories continue to rise, the company may have to downsize production.
This quarter, NXP Semiconductors’s DIO came in at 153, which is 29 days above its five-year average. These numbers suggest that despite the recent decrease, the company’s inventory levels are higher than what we’ve seen in the past.
7. Gross Margin & Pricing Power
In the semiconductor industry, a company’s gross profit margin is a critical metric to track because it sheds light on its pricing power, complexity of products, and ability to procure raw materials, equipment, and labor.
NXP Semiconductors’s gross margin is well ahead of its semiconductor peers, and its strong pricing power is an output of its differentiated, value-add products. As you can see below, it averaged an excellent 56% gross margin over the last two years. That means NXP Semiconductors only paid its suppliers $44.03 for every $100 in revenue. 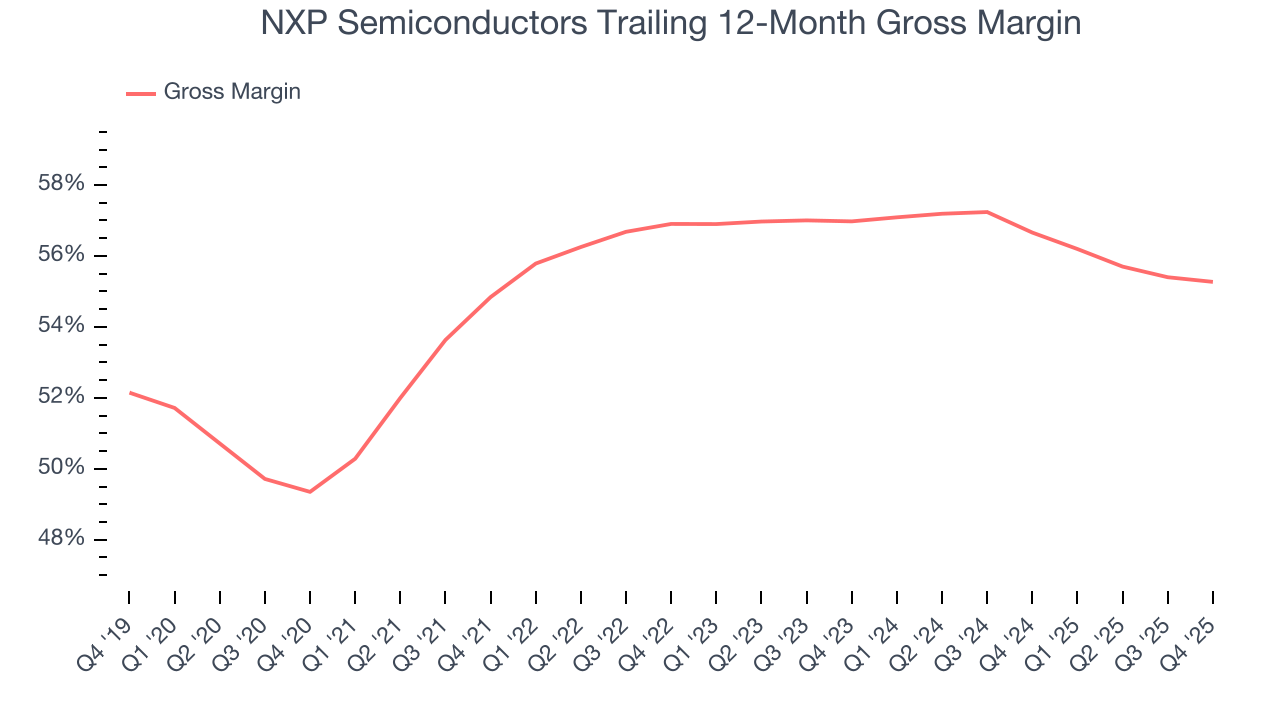
NXP Semiconductors produced a 54.2% gross profit margin in Q4, in line with the same quarter last year. On a wider time horizon, NXP Semiconductors’s full-year margin has been trending down over the past 12 months, decreasing by 1.4 percentage points. If this move continues, it could suggest a more competitive environment with some pressure to lower prices and higher input costs (such as raw materials and manufacturing expenses).
8. Operating Margin
Operating margin is a key measure of profitability. Think of it as net income - the bottom line - excluding the impact of taxes and interest on debt, which are less connected to business fundamentals.
NXP Semiconductors has been an efficient company over the last two years. It was one of the more profitable businesses in the semiconductor sector, boasting an average operating margin of 26%. This result isn’t surprising as its high gross margin gives it a favorable starting point.
Analyzing the trend in its profitability, NXP Semiconductors’s operating margin rose by 1.5 percentage points over the last five years, as its sales growth gave it operating leverage.
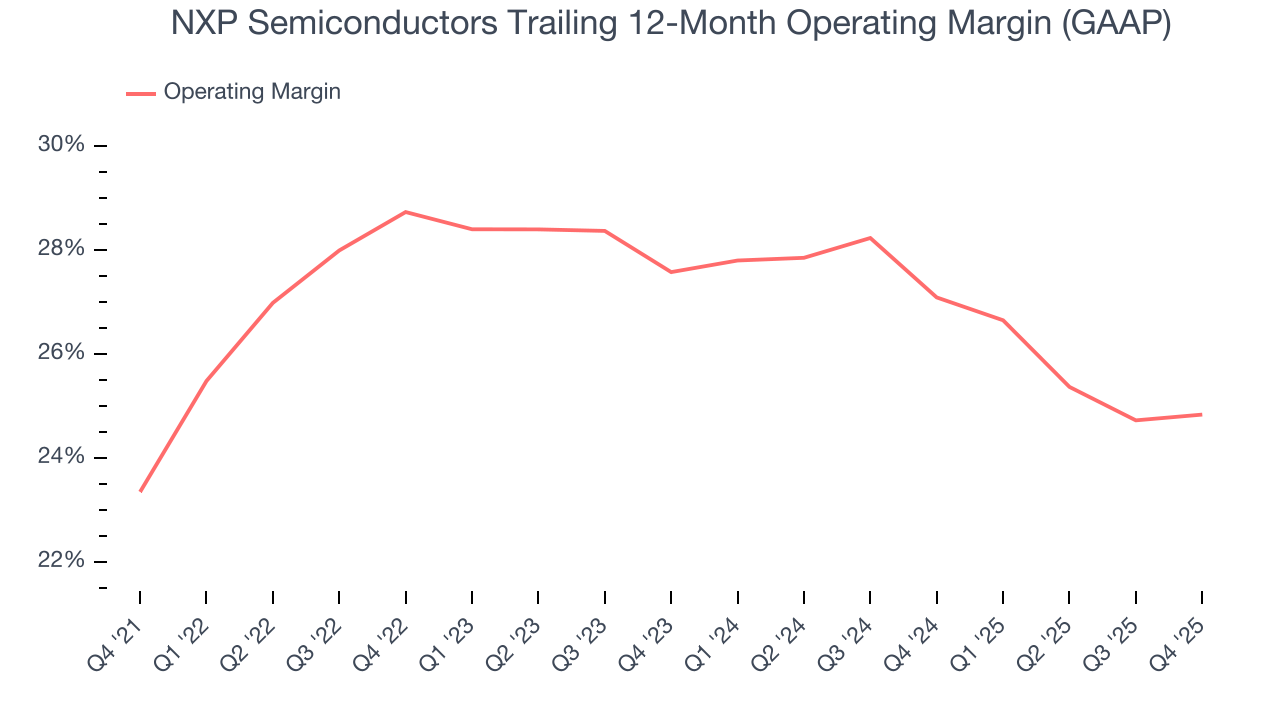
This quarter, NXP Semiconductors generated an operating margin profit margin of 22.3%, in line with the same quarter last year. This indicates the company’s cost structure has recently been stable.
9. Earnings Per Share
We track the long-term change in earnings per share (EPS) for the same reason as long-term revenue growth. Compared to revenue, however, EPS highlights whether a company’s growth is profitable.
NXP Semiconductors’s EPS grew at an unimpressive 13.9% compounded annual growth rate over the last five years. On the bright side, this performance was better than its 7.3% annualized revenue growth and tells us the company became more profitable on a per-share basis as it expanded.
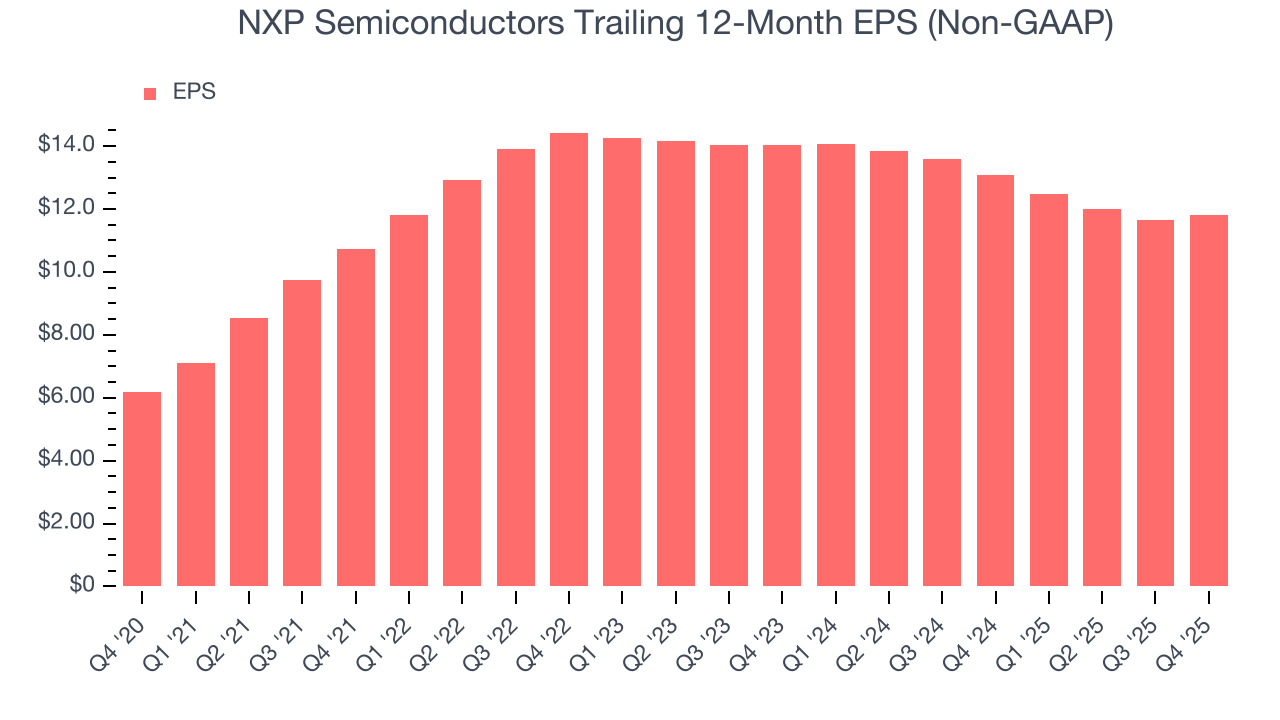
Diving into the nuances of NXP Semiconductors’s earnings can give us a better understanding of its performance. As we mentioned earlier, NXP Semiconductors’s operating margin was flat this quarter but expanded by 1.5 percentage points over the last five years. On top of that, its share count shrank by 10.9%. These are positive signs for shareholders because improving profitability and share buybacks turbocharge EPS growth relative to revenue growth. 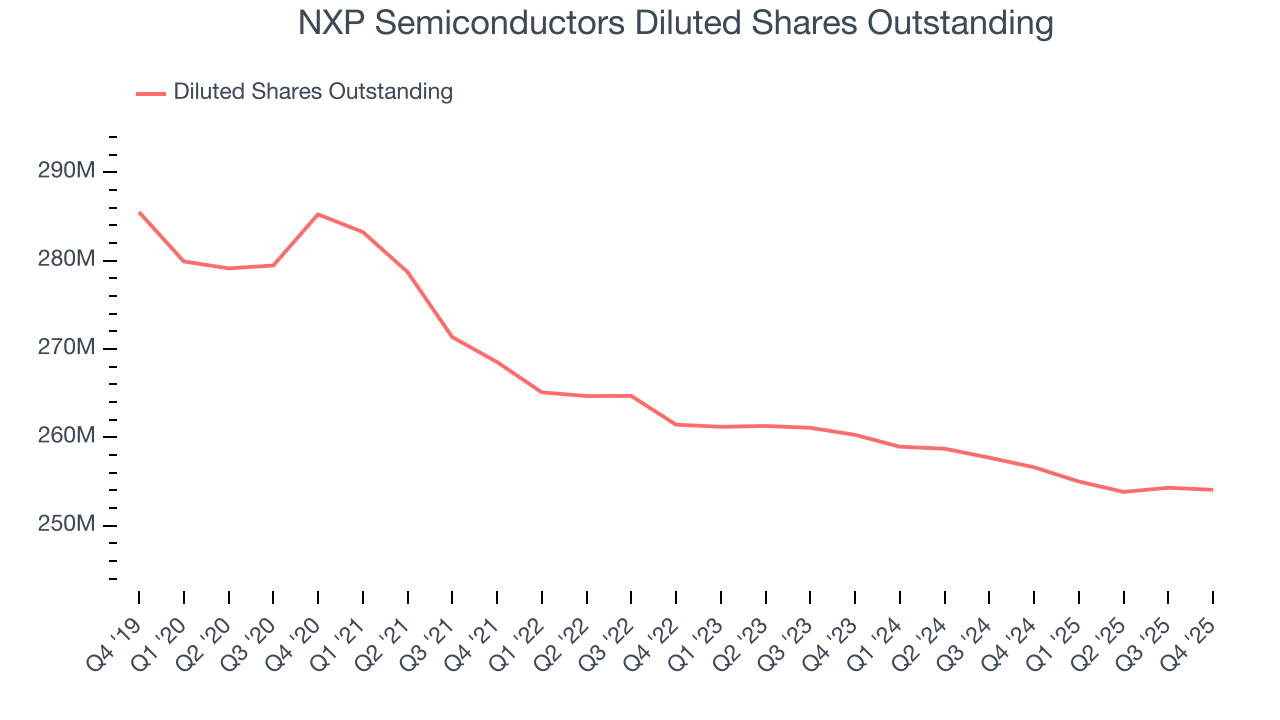
In Q4, NXP Semiconductors reported adjusted EPS of $3.35, up from $3.18 in the same quarter last year. This print beat analysts’ estimates by 1.2%. Over the next 12 months, Wall Street expects NXP Semiconductors’s full-year EPS of $11.82 to grow 17.2%.
10. Cash Is King
If you’ve followed StockStory for a while, you know we emphasize free cash flow. Why, you ask? We believe that in the end, cash is king, and you can’t use accounting profits to pay the bills.
NXP Semiconductors has shown decent cash profitability, giving it some flexibility to reinvest or return capital to investors. The company’s free cash flow margin averaged 18% over the last two years, slightly better than the broader semiconductor sector.
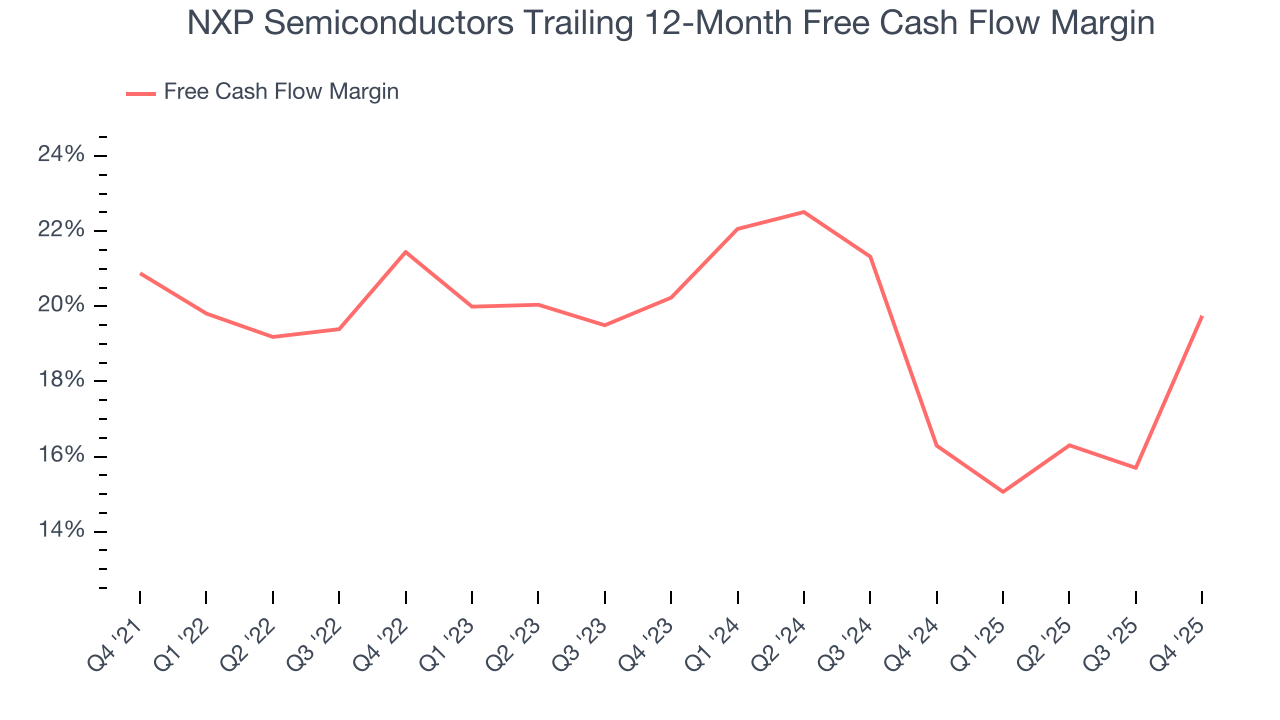
NXP Semiconductors’s free cash flow clocked in at $793 million in Q4, equivalent to a 23.8% margin. This result was good as its margin was 15.4 percentage points higher than in the same quarter last year, but we wouldn’t put too much weight on the short term because investment needs can be seasonal, causing temporary swings. Long-term trends trump fluctuations.
11. Return on Invested Capital (ROIC)
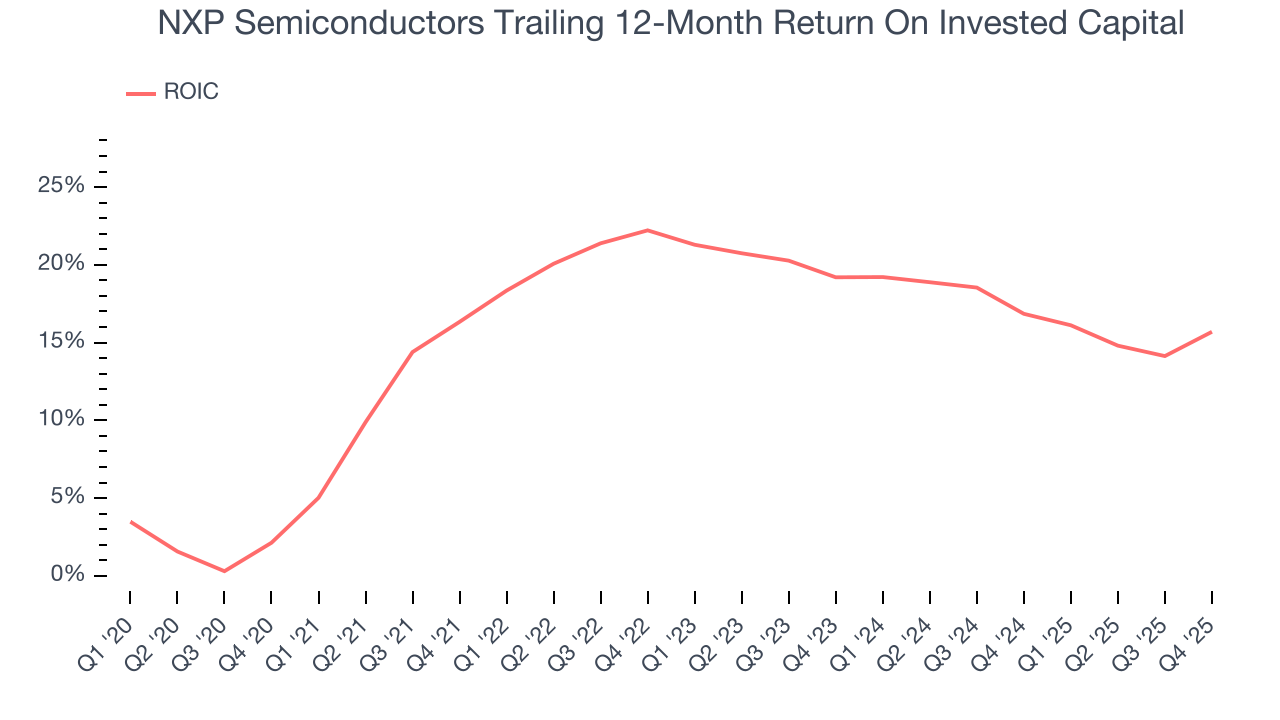
EPS and free cash flow tell us whether a company was profitable while growing its revenue. But was it capital-efficient? Enter ROIC, a metric showing how much operating profit a company generates relative to the money it has raised (debt and equity).
NXP Semiconductors’s management team makes decent investment decisions and generates value for shareholders. Its five-year average ROIC was 18.1%, slightly better than typical semiconductor business.
12. Balance Sheet Assessment
NXP Semiconductors reported $3.27 billion of cash and $12.22 billion of debt on its balance sheet in the most recent quarter. As investors in high-quality companies, we primarily focus on two things: 1) that a company’s debt level isn’t too high and 2) that its interest payments are not excessively burdening the business.
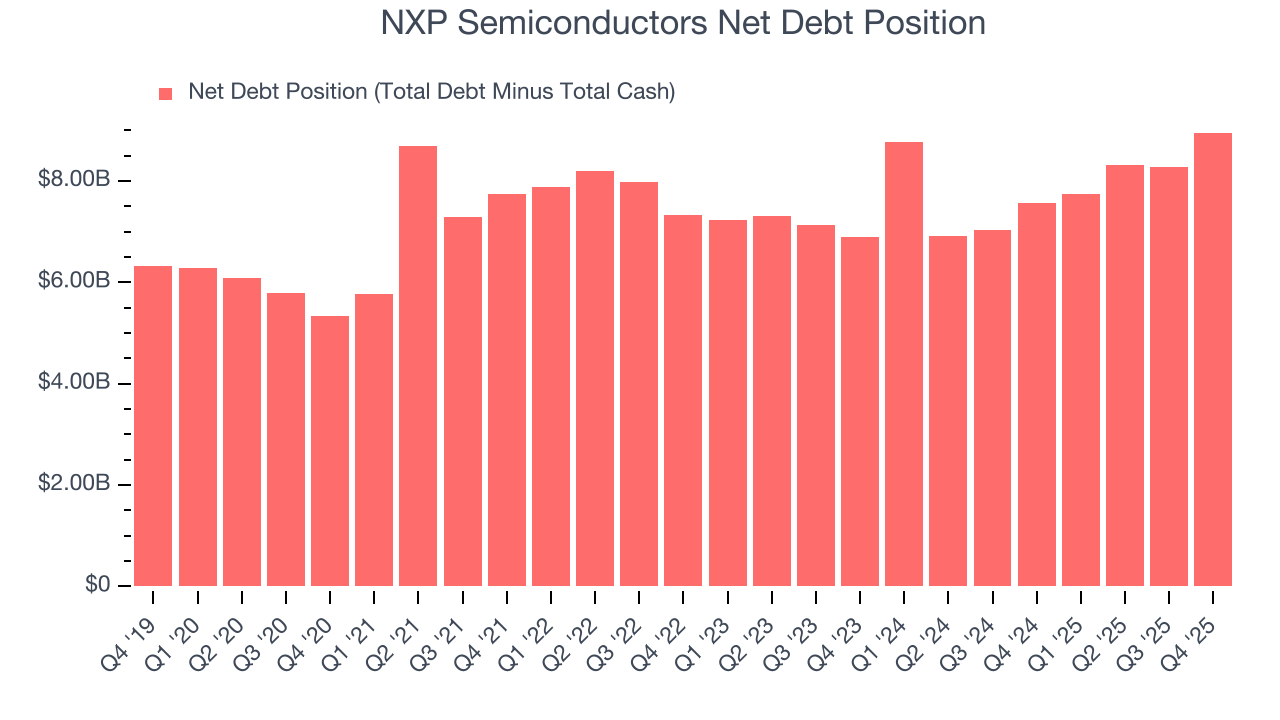
With $4.73 billion of EBITDA over the last 12 months, we view NXP Semiconductors’s 1.9× net-debt-to-EBITDA ratio as safe. We also see its $228 million of annual interest expenses as appropriate. The company’s profits give it plenty of breathing room, allowing it to continue investing in growth initiatives.
13. Key Takeaways from NXP Semiconductors’s Q4 Results
A highlight during the quarter was NXP Semiconductors’s improvement in inventory levels. We were also glad its revenue guidance for next quarter slightly exceeded Wall Street’s estimates. Overall, this print had some key positives. Investors were likely hoping for more, and shares traded down 4.9% to $219.73 immediately following the results.
14. Is Now The Time To Buy NXP Semiconductors?
Updated: March 13, 2026 at 10:24 PM EDT
Before deciding whether to buy NXP Semiconductors or pass, we urge investors to consider business quality, valuation, and the latest quarterly results.
NXP Semiconductors has a few positive attributes, but it doesn’t top our wishlist. First off, its revenue growth was decent over the last five years and is expected to accelerate over the next 12 months. And while NXP Semiconductors’s projected EPS for the next year is lacking, its strong operating margins show it’s a well-run business.
NXP Semiconductors’s P/E ratio based on the next 12 months is 13.7x. This valuation is reasonable, but the company’s shakier fundamentals present too much downside risk. We're pretty confident there are superior stocks to buy right now.
Wall Street analysts have a consensus one-year price target of $262.13 on the company (compared to the current share price of $190.73).