
HNI (HNI)
We see potential in HNI, but the state of its balance sheet makes us slightly uncomfortable.― StockStory Analyst Team
1. News


2. Summary
Why HNI Is Not Exciting
With roots dating back to 1944 and a significant acquisition of Kimball International in 2023, HNI (NYSE:HNI) manufactures and sells office furniture systems, seating, and storage solutions, as well as residential fireplaces and heating products.
- Poor expense management has led to an operating margin that is below the industry average
- 6× net-debt-to-EBITDA ratio shows it’s overleveraged and increases the probability of shareholder dilution if things turn unexpectedly


HNI has some noteworthy aspects, but we’d refrain from buying the stock until its EBITDA can comfortably service its debt.
Why There Are Better Opportunities Than HNI


HNI’s stock price of $35.32 implies a valuation ratio of 9.1x forward P/E. This is a cheap valuation multiple, but for good reason. You get what you pay for.
It’s better to pay up for high-quality businesses with higher long-term earnings potential rather than to buy lower-quality stocks because they appear cheap. These challenged businesses often don’t re-rate, a phenomenon known as a “value trap”.
3. HNI (HNI) Research Report: Q4 CY2025 Update
Workplace furnishings manufacturer HNI Corporation (NYSE:HNI) reported Q4 CY2025 results exceeding the market’s revenue expectations, with sales up 38.3% year on year to $888.4 million. Its non-GAAP profit of $0.83 per share was 8.8% below analysts’ consensus estimates.
HNI (HNI) Q4 CY2025 Highlights:
- Revenue: $888.4 million vs analyst estimates of $697.5 million (38.3% year-on-year growth, 27.4% beat)
- Adjusted EPS: $0.83 vs analyst expectations of $0.91 (8.8% miss)
- Operating Margin: -3.5%, down from 9.6% in the same quarter last year
- Free Cash Flow Margin: 1.9%, down from 6.5% in the same quarter last year
- Market Capitalization: $3.45 billion
Company Overview
With roots dating back to 1944 and a significant acquisition of Kimball International in 2023, HNI (NYSE:HNI) manufactures and sells office furniture systems, seating, and storage solutions, as well as residential fireplaces and heating products.
HNI operates through two distinct business segments: Workplace Furnishings and Residential Building Products. The Workplace Furnishings segment offers a comprehensive range of office furniture including panel-based systems, seating, tables, storage solutions, and architectural products under brands like HON, Allsteel, Kimball, and Gunlocke. These products serve both large corporate clients through the contract channel and smaller businesses through the SMB channel.
The company distributes its workplace products through multiple channels: independent office dealers, national office product distributors, eCommerce resellers, wholesalers, and direct sales to government entities. This multi-channel approach allows HNI to reach diverse customer bases from large corporations to small businesses.
In the Residential Building Products segment, HNI operates as Hearth & Home Technologies, North America's largest manufacturer of prefabricated fireplaces and related products. The company produces gas, wood, electric, and pellet-fueled fireplaces, stoves, and outdoor fire features under brands including Heatilator, Heat & Glo, Majestic, and Vermont Castings.
A homebuilder might install HNI's Heatilator gas fireplace as a centerpiece in a new home's living room, while a homeowner renovating an older property might choose a Quadra-Fire wood stove for supplemental heating. The residential products are sold through independent dealers, distributors, and company-owned retail outlets, with sales typically concentrated during the fall and winter months.
HNI maintains vertical manufacturing capabilities that provide flexibility to design and produce new products in-house as market needs evolve. The company serves customers across commercial, financial, healthcare, government, and education sectors throughout North America, with additional international presence, particularly in India.
4. Office & Commercial Furniture
The sector faces a tepid outlook as workplace dynamics continue to evolve. Hybrid work means that enterprise demand for office furniture is lower. Consumer demand for the same products likely will not offset the loss from enterprises, as individual workers tend to have less space and need for the sector's wares. The Trump administration also possesses a high willingness to impose tariffs on key partners, which could result in retaliatory actions, all of which could pressure those selling furniture that may feature components or labor from overseas. Lastly, the COVID-19 pandemic showed that there is always a risk that something disrupts supply chains, and companies need contingency plans for this.
In the workplace furnishings segment, HNI competes with companies like Steelcase (NYSE:SCS), Herman Miller (NASDAQ:MLHR), and Knoll. In the residential building products segment, key competitors include Travis Industries, Innovative Hearth Products, Wolf Steel Ltd. (Napoleon), and FPI Fireplace Products International Ltd. (Regency).
5. Revenue Growth
A company’s long-term performance is an indicator of its overall quality. Any business can have short-term success, but a top-tier one grows for years.
With $2.84 billion in revenue over the past 12 months, HNI is a mid-sized business services company, which sometimes brings disadvantages compared to larger competitors benefiting from better economies of scale. On the bright side, it can still flex high growth rates because it’s working from a smaller revenue base.
As you can see below, HNI’s sales grew at a solid 7.7% compounded annual growth rate over the last five years. This shows it had high demand, a useful starting point for our analysis.
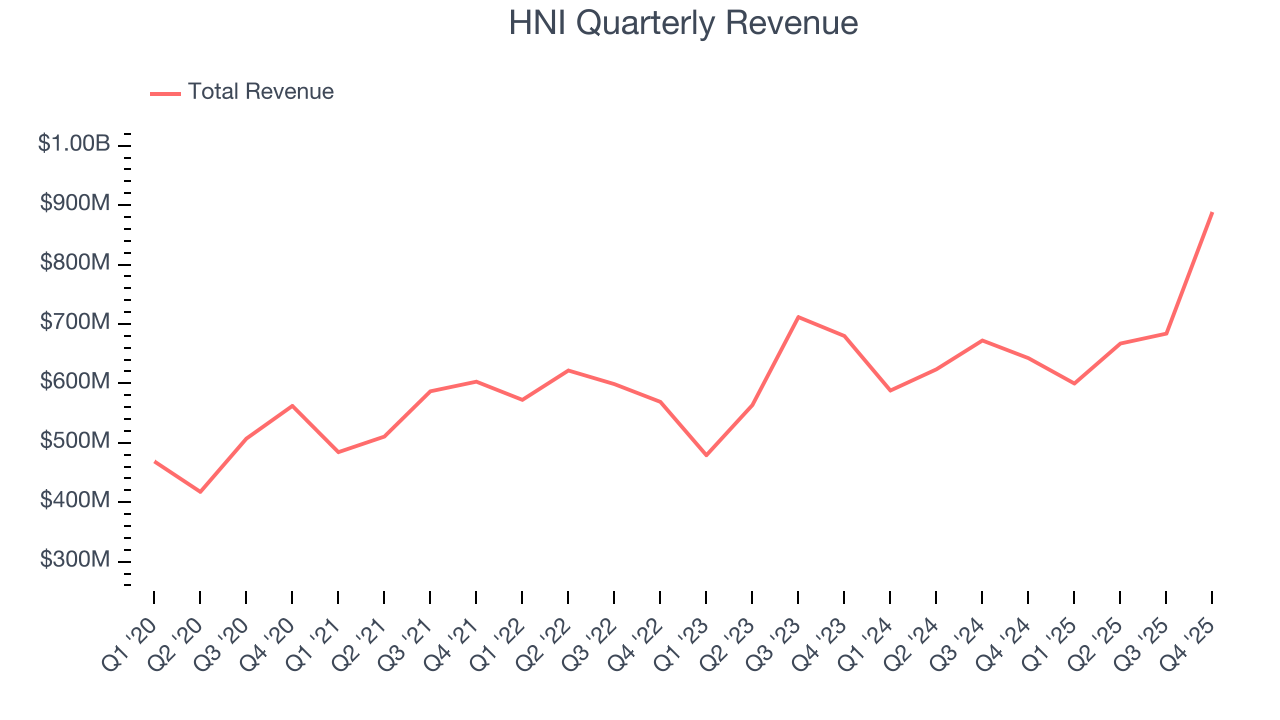
Long-term growth is the most important, but within business services, a half-decade historical view may miss new innovations or demand cycles. HNI’s annualized revenue growth of 8% over the last two years aligns with its five-year trend, suggesting its demand was predictably strong. 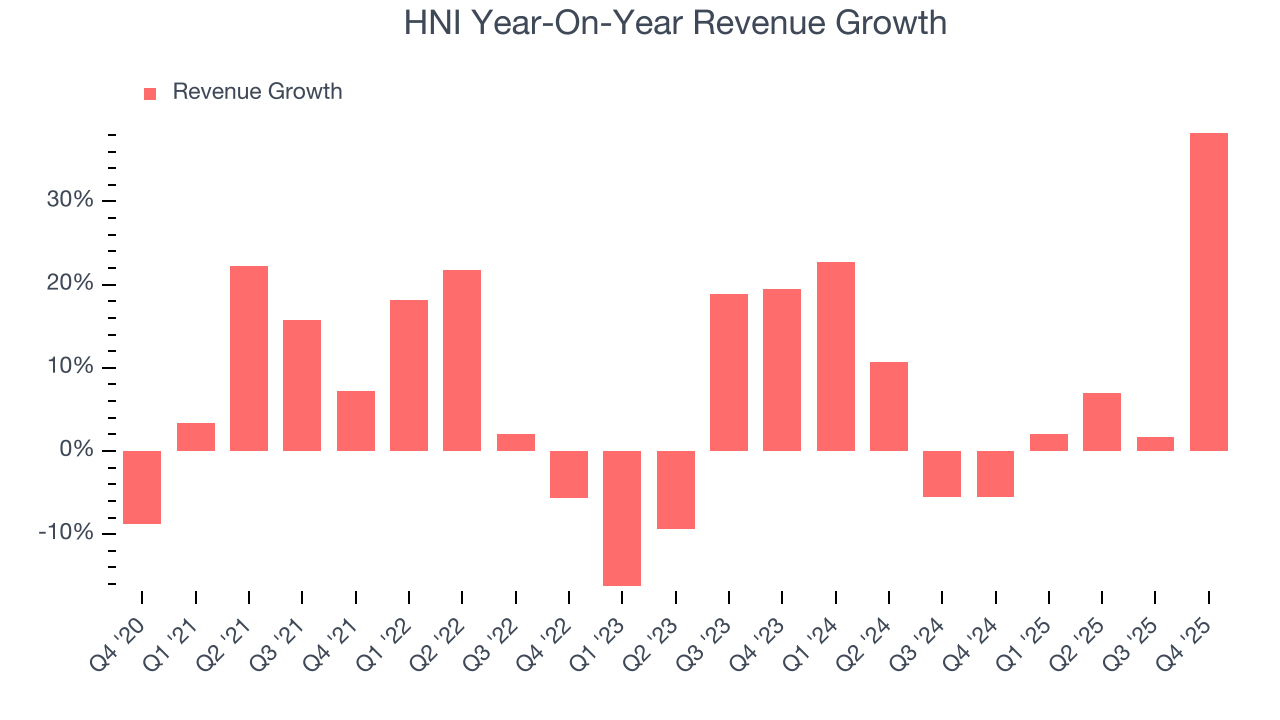
This quarter, HNI reported wonderful year-on-year revenue growth of 38.3%, and its $888.4 million of revenue exceeded Wall Street’s estimates by 27.4%.
Looking ahead, sell-side analysts expect revenue to decline by 1.1% over the next 12 months, a deceleration versus the last two years. This projection is underwhelming and indicates its products and services will face some demand challenges. At least the company is tracking well in other measures of financial health.
6. Operating Margin
HNI’s operating margin might fluctuated slightly over the last 12 months but has remained more or less the same, averaging 6.2% over the last five years. This profitability was paltry for a business services business and caused by its suboptimal cost structure.
Analyzing the trend in its profitability, HNI’s operating margin might fluctuated slightly but has generally stayed the same over the last five years. This raises questions about the company’s expense base because its revenue growth should have given it leverage on its fixed costs, resulting in better economies of scale and profitability.
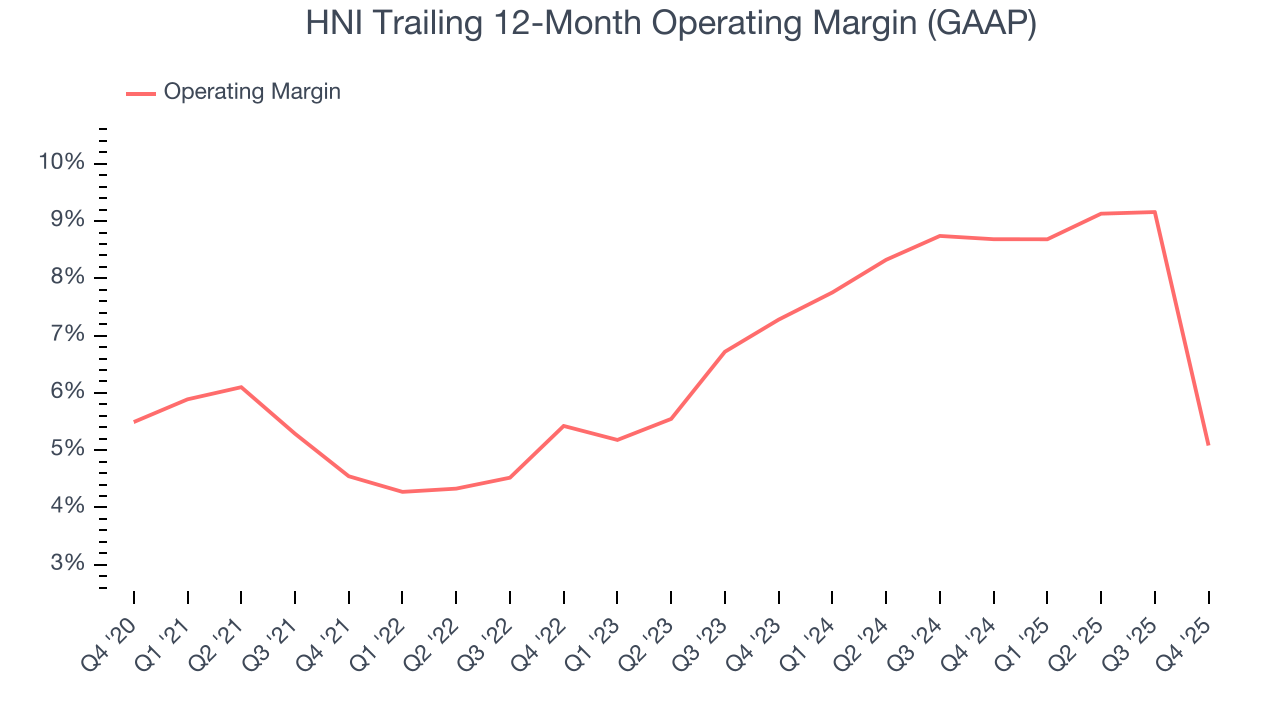
This quarter, HNI generated an operating margin profit margin of negative 3.5%, down 13.2 percentage points year on year. This contraction shows it was less efficient because its expenses grew faster than its revenue.
7. Earnings Per Share
We track the long-term change in earnings per share (EPS) for the same reason as long-term revenue growth. Compared to revenue, however, EPS highlights whether a company’s growth is profitable.
HNI’s EPS grew at a spectacular 14.3% compounded annual growth rate over the last five years, higher than its 7.7% annualized revenue growth. However, we take this with a grain of salt because its operating margin didn’t improve and it didn’t repurchase its shares, meaning the delta came from reduced interest expenses or taxes.
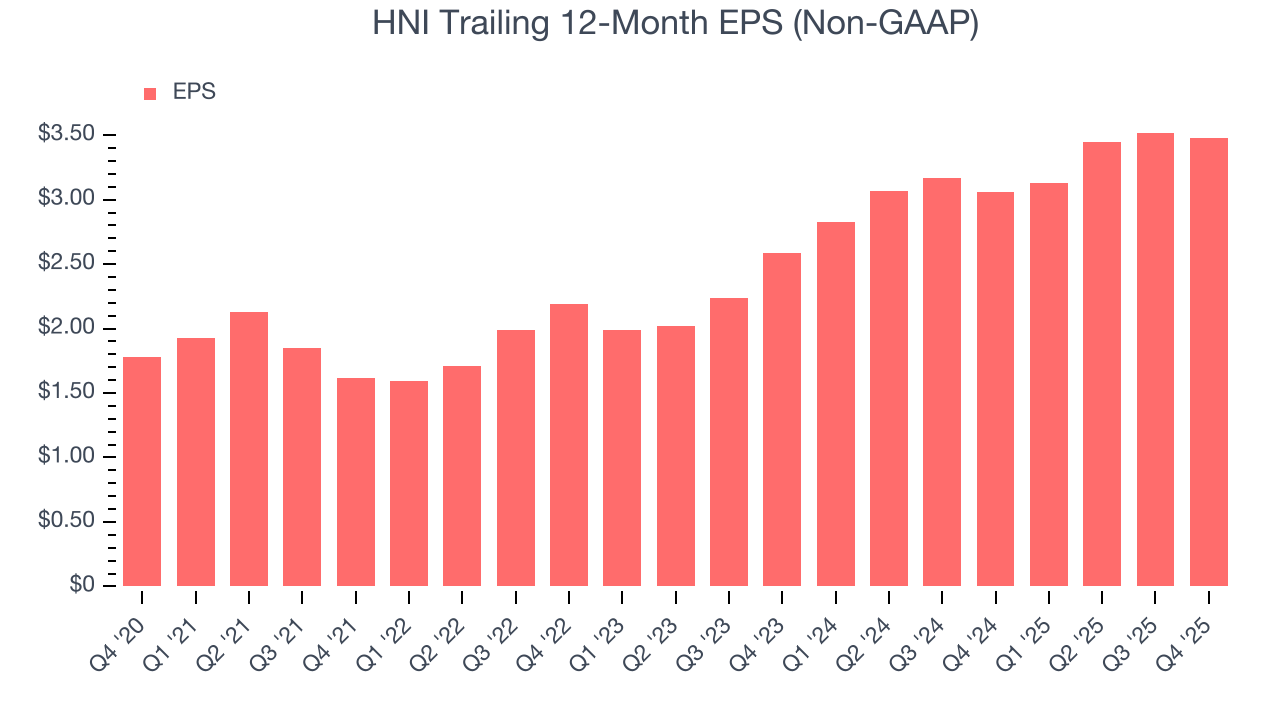
Like with revenue, we analyze EPS over a shorter period to see if we are missing a change in the business.
For HNI, its two-year annual EPS growth of 15.9% was higher than its five-year trend. We love it when earnings growth accelerates, especially when it accelerates off an already high base.
In Q4, HNI reported adjusted EPS of $0.83, down from $0.87 in the same quarter last year. This print missed analysts’ estimates, but we care more about long-term adjusted EPS growth than short-term movements. Over the next 12 months, Wall Street expects HNI’s full-year EPS of $3.48 to grow 16.7%.
8. Cash Is King
If you’ve followed StockStory for a while, you know we emphasize free cash flow. Why, you ask? We believe that in the end, cash is king, and you can’t use accounting profits to pay the bills.
HNI has shown decent cash profitability, giving it some flexibility to reinvest or return capital to investors. The company’s free cash flow margin averaged 5.1% over the last five years, slightly better than the broader business services sector.
Taking a step back, we can see that HNI’s margin expanded by 2.3 percentage points during that time. This shows the company is heading in the right direction, and we can see it became a less capital-intensive business because its free cash flow profitability rose while its operating profitability was flat.
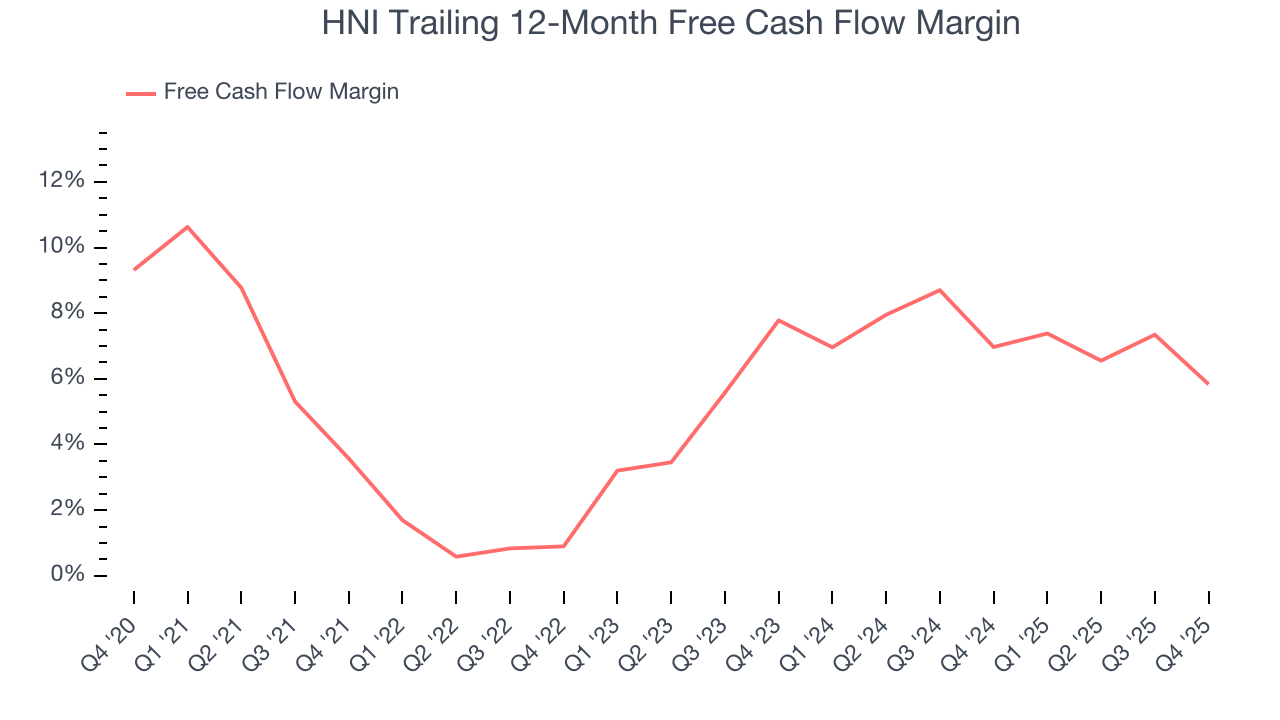
HNI’s free cash flow clocked in at $17 million in Q4, equivalent to a 1.9% margin. The company’s cash profitability regressed as it was 4.6 percentage points lower than in the same quarter last year, but we wouldn’t put too much weight on the short term because investment needs can be seasonal, causing temporary swings. Long-term trends trump fluctuations.
9. Return on Invested Capital (ROIC)
EPS and free cash flow tell us whether a company was profitable while growing its revenue. But was it capital-efficient? A company’s ROIC explains this by showing how much operating profit it makes compared to the money it has raised (debt and equity).
HNI’s management team makes decent investment decisions and generates value for shareholders. Its five-year average ROIC was 12%, slightly better than typical business services business.
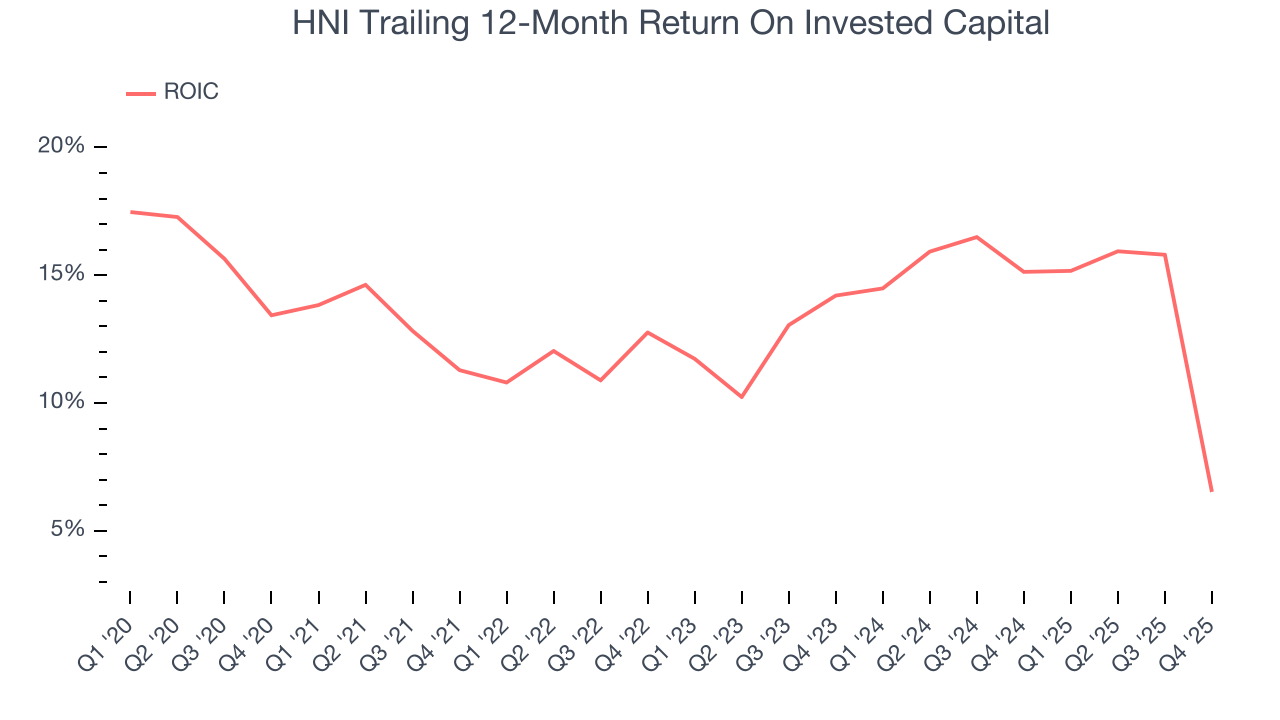
We like to invest in businesses with high returns, but the trend in a company’s ROIC is what often surprises the market and moves the stock price. Over the last few years, HNI’s ROIC averaged 1.2 percentage point decreases each year. Only time will tell if its new bets can bear fruit and potentially reverse the trend.
10. Balance Sheet Risk
As long-term investors, the risk we care about most is the permanent loss of capital, which can happen when a company goes bankrupt or raises money from a disadvantaged position. This is separate from short-term stock price volatility, something we are much less bothered by.
HNI’s $1.63 billion of debt exceeds the $215.7 million of cash on its balance sheet. Furthermore, its 6× net-debt-to-EBITDA ratio (based on its EBITDA of $254.5 million over the last 12 months) shows the company is overleveraged.
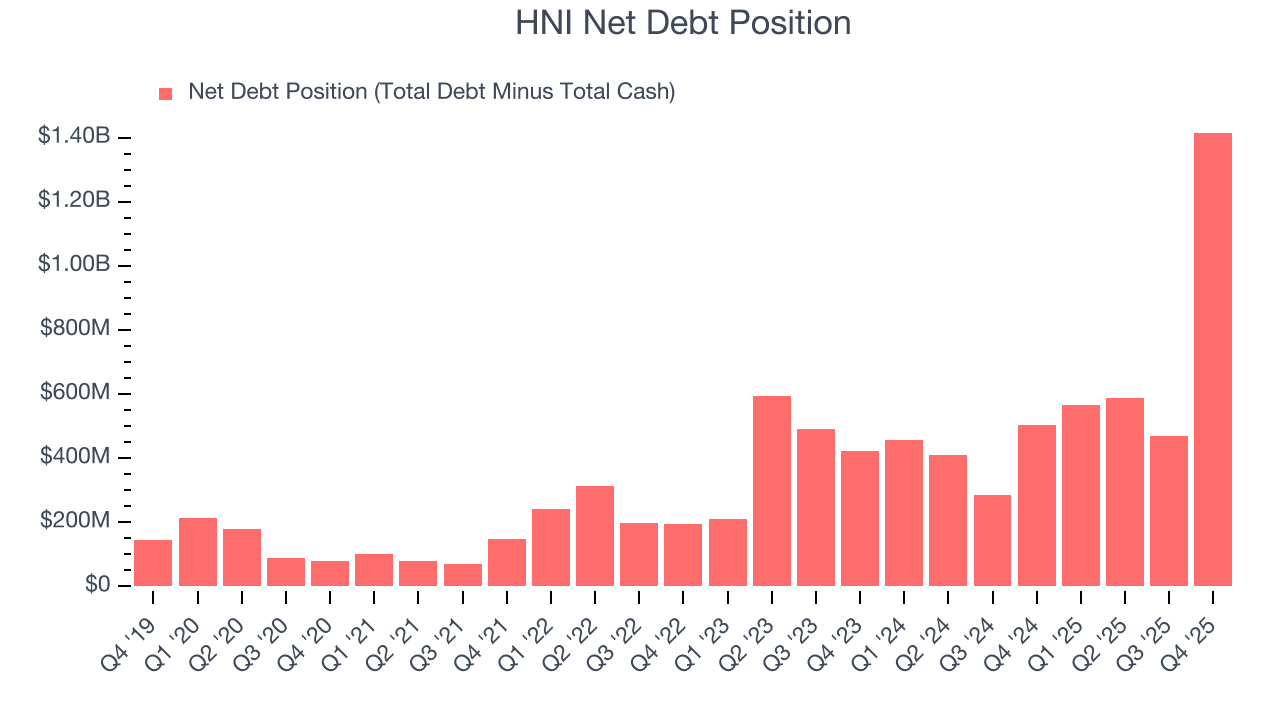
At this level of debt, incremental borrowing becomes increasingly expensive and credit agencies could downgrade the company’s rating if profitability falls. HNI could also be backed into a corner if the market turns unexpectedly – a situation we seek to avoid as investors in high-quality companies.
We hope HNI can improve its balance sheet and remain cautious until it increases its profitability or pays down its debt.
11. Key Takeaways from HNI’s Q4 Results
We were impressed by how significantly HNI blew past analysts’ revenue expectations this quarter. On the other hand, its EPS missed. Overall, this quarter could have been better. The stock remained flat at $48.53 immediately after reporting.
12. Is Now The Time To Buy HNI?
Updated: March 18, 2026 at 11:46 PM EDT
Before deciding whether to buy HNI or pass, we urge investors to consider business quality, valuation, and the latest quarterly results.
Aside from its balance sheet, HNI is a pretty good company. For starters, its revenue growth was solid over the last five years and is expected to accelerate over the next 12 months. And while its operating margins are low compared to other business services companies, its projected EPS for the next year implies the company’s fundamentals will improve. On top of that, HNI’s spectacular EPS growth over the last five years shows its profits are trickling down to shareholders.
HNI’s P/E ratio based on the next 12 months is 9.1x. Certain aspects of its fundamentals are attractive, but we aren’t investing at the moment because its balance sheet makes us uneasy. We recommend investors interested in the company wait until it generates sufficient cash flows or raises money before getting involved.
Wall Street analysts have a consensus one-year price target of $72 on the company (compared to the current share price of $35.32).