HP (HPQ)
HP faces an uphill battle. Not only is its demand weak but also its falling returns on capital suggest it’s becoming less profitable.― StockStory Analyst Team
1. News


2. Summary
Why We Think HP Will Underperform
Born from the legendary Silicon Valley garage startup founded by Bill Hewlett and Dave Packard in 1939, HP (NYSE:HPQ) designs and sells personal computers, printers, and related technology products and services to consumers, businesses, and enterprises worldwide.
- Sales were flat over the last five years, indicating it’s failed to expand this cycle
- Performance over the past two years shows its incremental sales were much less profitable, as its earnings per share fell by 2.6% annually
- Demand will likely fall over the next 12 months as Wall Street expects flat revenue


HP is skating on thin ice. We see more attractive opportunities in the market.
Why There Are Better Opportunities Than HP


At $18.92 per share, HP trades at 7x forward P/E. This certainly seems like a cheap stock, but we think there are valid reasons why it trades this way.
Cheap stocks can look like a great deal at first glance, but they can be value traps. They often have less earnings power, meaning there is more reliance on a re-rating to generate good returns - an unlikely scenario for low-quality companies.
3. HP (HPQ) Research Report: Q4 CY2025 Update
Personal computing and printing company HP (NYSE:HPQ) reported Q4 CY2025 results topping the market’s revenue expectations, with sales up 6.9% year on year to $14.44 billion. Its non-GAAP profit of $0.81 per share was 5.3% above analysts’ consensus estimates.
HP (HPQ) Q4 CY2025 Highlights:
- Revenue: $14.44 billion vs analyst estimates of $13.99 billion (6.9% year-on-year growth, 3.2% beat)
- Adjusted EPS: $0.81 vs analyst estimates of $0.77 (5.3% beat)
- Adjusted EBITDA: $1.16 billion vs analyst estimates of $1.16 billion (8% margin, 0.8% miss)
- Management reiterated its full-year Adjusted EPS guidance of $3.05 at the midpoint
- Operating Margin: 5.3%, down from 6.3% in the same quarter last year
- Free Cash Flow Margin: 1%, similar to the same quarter last year
- Market Capitalization: $16.85 billion
Company Overview
Born from the legendary Silicon Valley garage startup founded by Bill Hewlett and Dave Packard in 1939, HP (NYSE:HPQ) designs and sells personal computers, printers, and related technology products and services to consumers, businesses, and enterprises worldwide.
HP operates through three main segments: Personal Systems, Printing, and Corporate Investments. The Personal Systems division offers a wide range of computing devices including desktops, notebooks, workstations, and AI-enabled PCs under brands like Spectre, Envy, Omen, and Elite. These products serve both consumer and commercial markets, with specialized offerings for gamers, professionals, and enterprise customers.
The Printing segment encompasses both hardware and supplies, with solutions for home, office, and commercial environments. Beyond traditional printers, HP has expanded into graphics printing for businesses and 3D printing technologies that enable industrial manufacturing applications. The company generates significant recurring revenue through its printer supplies business, which includes ink and toner cartridges.
HP's business model combines direct sales with an extensive partner network of retailers, resellers, and distributors. A customer might purchase an HP laptop from a retail store like Best Buy, order directly from HP's website, or acquire equipment through a corporate purchasing agreement. For enterprise clients, HP often provides comprehensive solutions that include hardware, software, and services.
Manufacturing is primarily handled through outsourced partners, though HP maintains control over design and quality. This approach gives the company flexibility in its supply chain while allowing it to focus on innovation and customer relationships.
HP has invested heavily in security features across its product lines, incorporating hardware-level protections in both computers and printers to address growing cybersecurity concerns. The company has also been expanding its subscription-based services, offering options like HP Instant Ink that automatically delivers new cartridges when printers run low.
4. Hardware & Infrastructure
The Hardware & Infrastructure sector will be buoyed by demand related to AI adoption, cloud computing expansion, and the need for more efficient data storage and processing solutions. Companies with tech offerings such as servers, switches, and storage solutions are well-positioned in our new hybrid working and IT world. On the other hand, headwinds include ongoing supply chain disruptions, rising component costs, and intensifying competition from cloud-native and hyperscale providers reducing reliance on traditional hardware. Additionally, regulatory scrutiny over data sovereignty, cybersecurity standards, and environmental sustainability in hardware manufacturing could increase compliance costs.
HP's main competitors in personal computing include Dell Technologies (NYSE:DELL), Lenovo Group (OTC:LNVGY), Apple (NASDAQ:AAPL), and Acer. In the printing business, HP competes with Canon (NYSE:CAJ), Xerox (NASDAQ:XRX), Brother Industries (OTC:BRTHY), and Epson (OTC:SEKEY).
5. Revenue Growth
A company’s long-term sales performance can indicate its overall quality. Any business can put up a good quarter or two, but many enduring ones grow for years.
With $56.23 billion in revenue over the past 12 months, HP is a behemoth in the business services sector and benefits from economies of scale, giving it an edge in distribution. This also enables it to gain more leverage on its fixed costs than smaller competitors and the flexibility to offer lower prices. However, its scale is a double-edged sword because finding new avenues for growth becomes difficult when you already have a substantial market presence. To accelerate sales, HP likely needs to optimize its pricing or lean into new offerings and international expansion.
As you can see below, HP struggled to increase demand as its $56.23 billion of sales for the trailing 12 months was close to its revenue five years ago. This shows demand was soft, a rough starting point for our analysis.
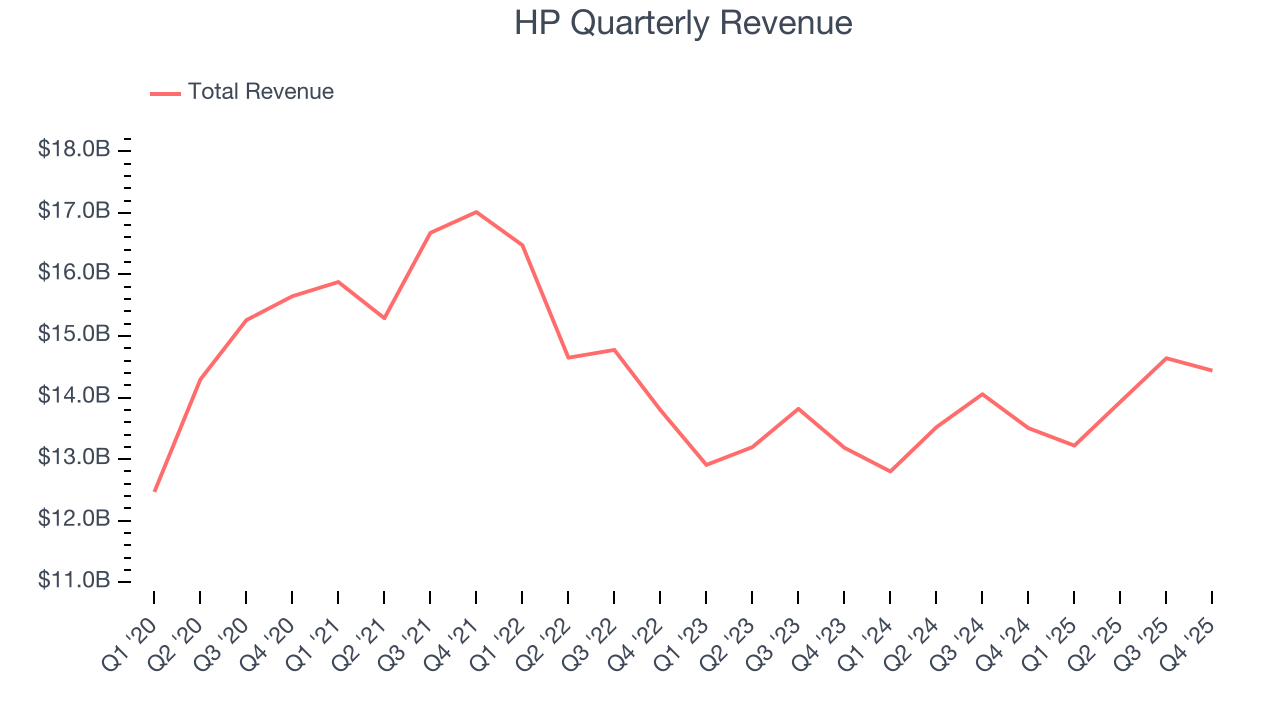
We at StockStory place the most emphasis on long-term growth, but within business services, a half-decade historical view may miss recent innovations or disruptive industry trends. HP’s annualized revenue growth of 2.9% over the last two years is above its five-year trend, which is encouraging. 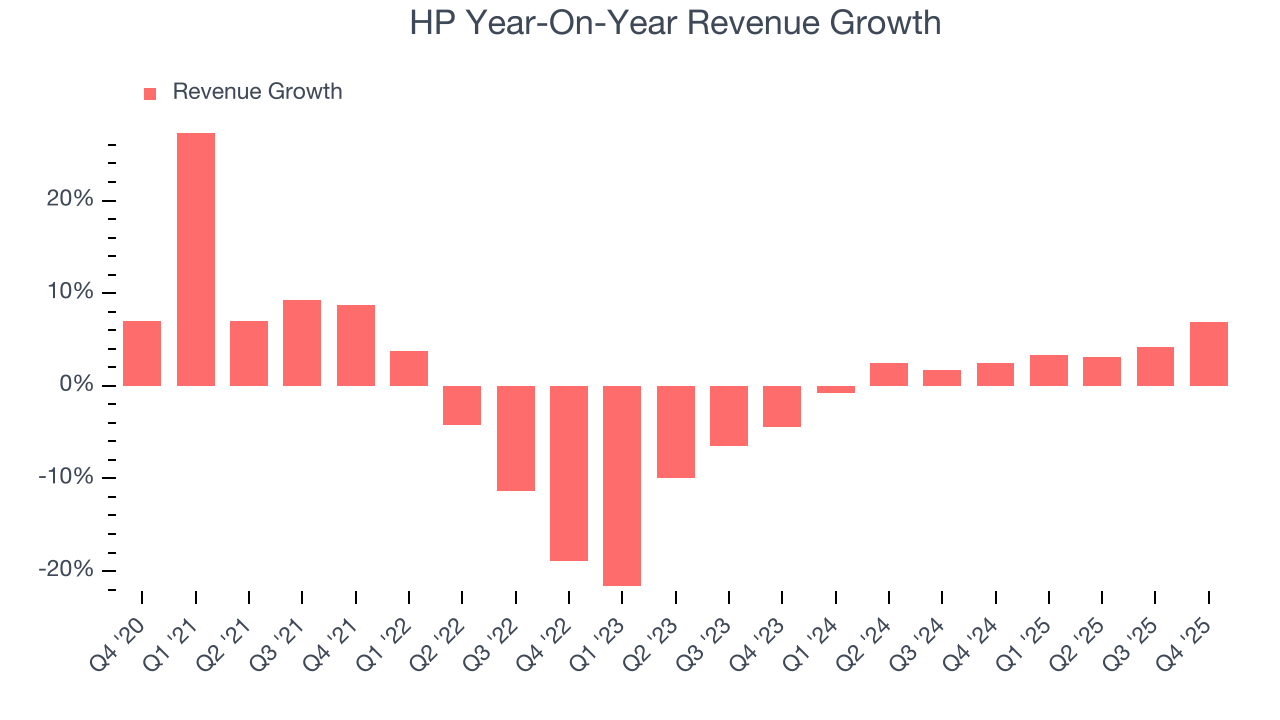
We can better understand the company’s revenue dynamics by analyzing its most important segments, Commercial Personal Systems and Commercial Printing, which are 50.2% and 29% of revenue. Over the last two years, HP’s Commercial Personal Systems revenue (desktops, laptops, etc.) averaged 8% year-on-year growth. On the other hand, its Commercial Printing revenue (commercial or industrial printers) averaged 3.3% declines. 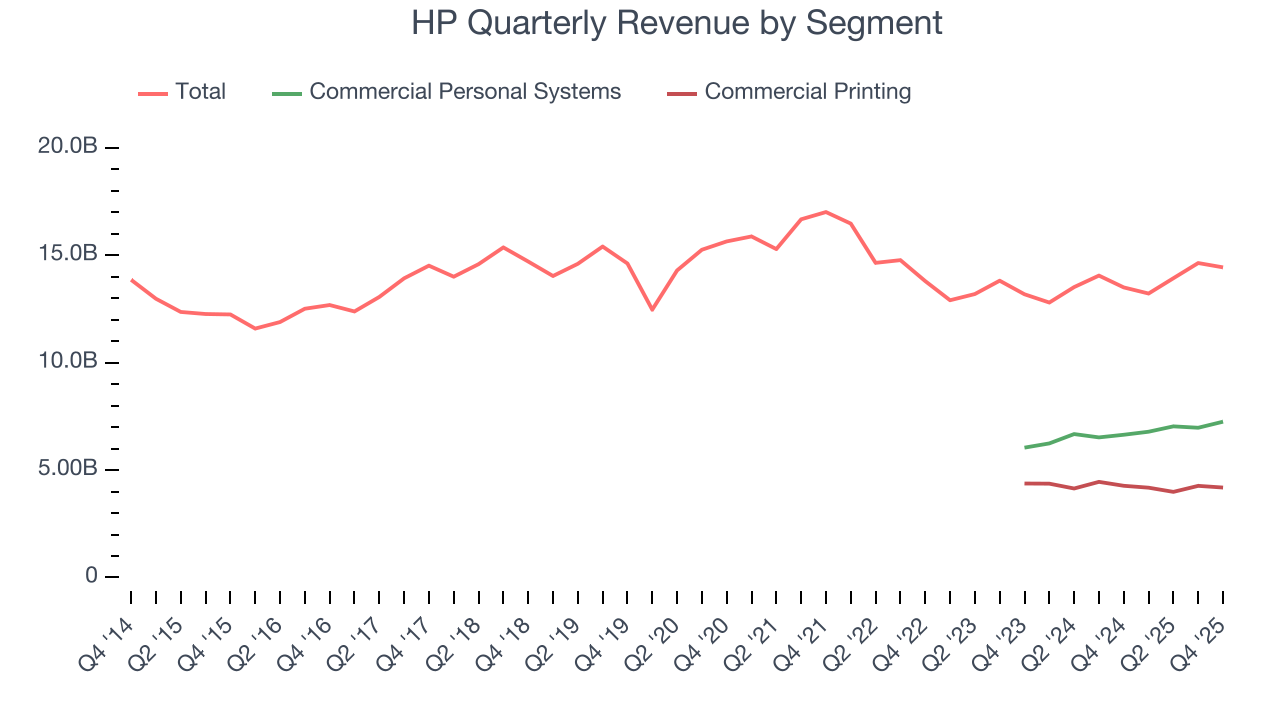
This quarter, HP reported year-on-year revenue growth of 6.9%, and its $14.44 billion of revenue exceeded Wall Street’s estimates by 3.2%.
Looking ahead, sell-side analysts expect revenue to decline by 2.1% over the next 12 months, a deceleration versus the last two years. This projection doesn't excite us and indicates its products and services will see some demand headwinds.
6. Operating Margin
HP was profitable over the last five years but held back by its large cost base. Its average operating margin of 6.9% was weak for a business services business.
Analyzing the trend in its profitability, HP’s operating margin decreased by 2.7 percentage points over the last five years. HP’s performance was poor no matter how you look at it - it shows that costs were rising and it couldn’t pass them onto its customers.
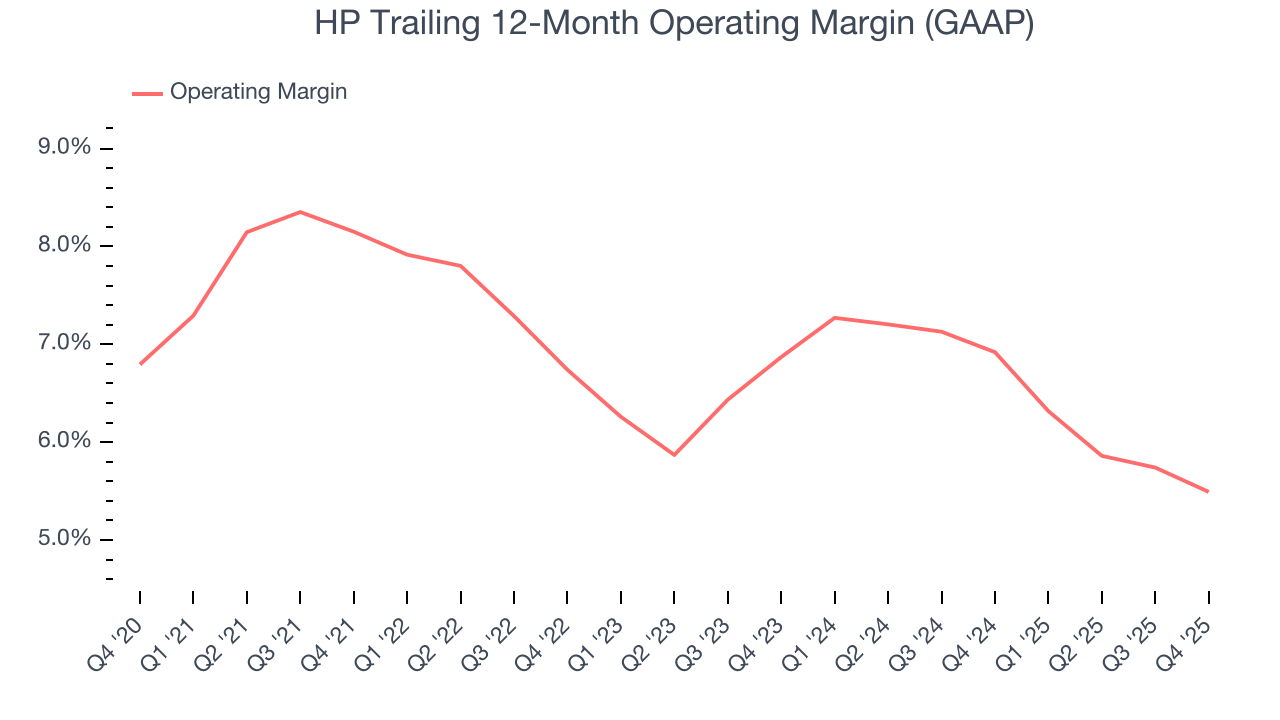
This quarter, HP generated an operating margin profit margin of 5.3%, down 1 percentage points year on year. This reduction is quite minuscule and indicates the company’s overall cost structure has been relatively stable.
7. Earnings Per Share
We track the long-term change in earnings per share (EPS) for the same reason as long-term revenue growth. Compared to revenue, however, EPS highlights whether a company’s growth is profitable.
HP’s EPS grew at an unimpressive 4.7% compounded annual growth rate over the last five years. This performance was better than its flat revenue but doesn’t tell us much about its business quality because its operating margin didn’t improve.
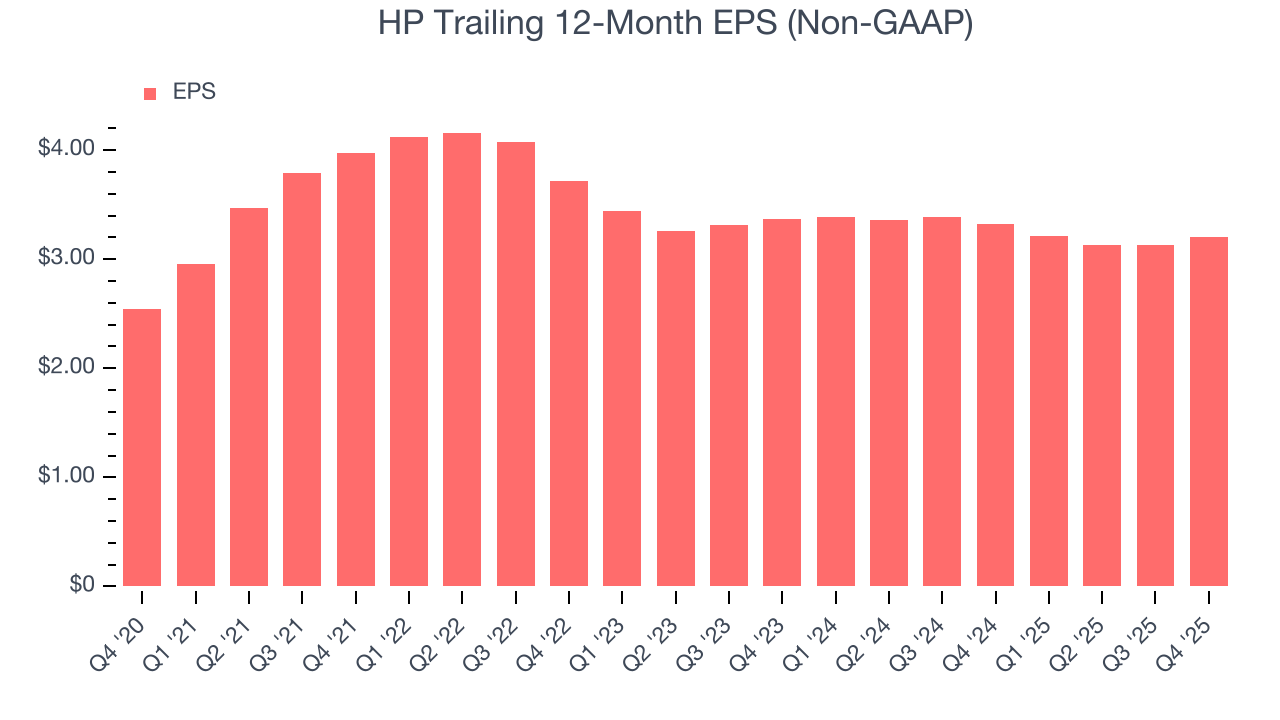
Diving into the nuances of HP’s earnings can give us a better understanding of its performance. A five-year view shows that HP has repurchased its stock, shrinking its share count by 27.9%. This tells us its EPS outperformed its revenue not because of increased operational efficiency but financial engineering, as buybacks boost per share earnings. 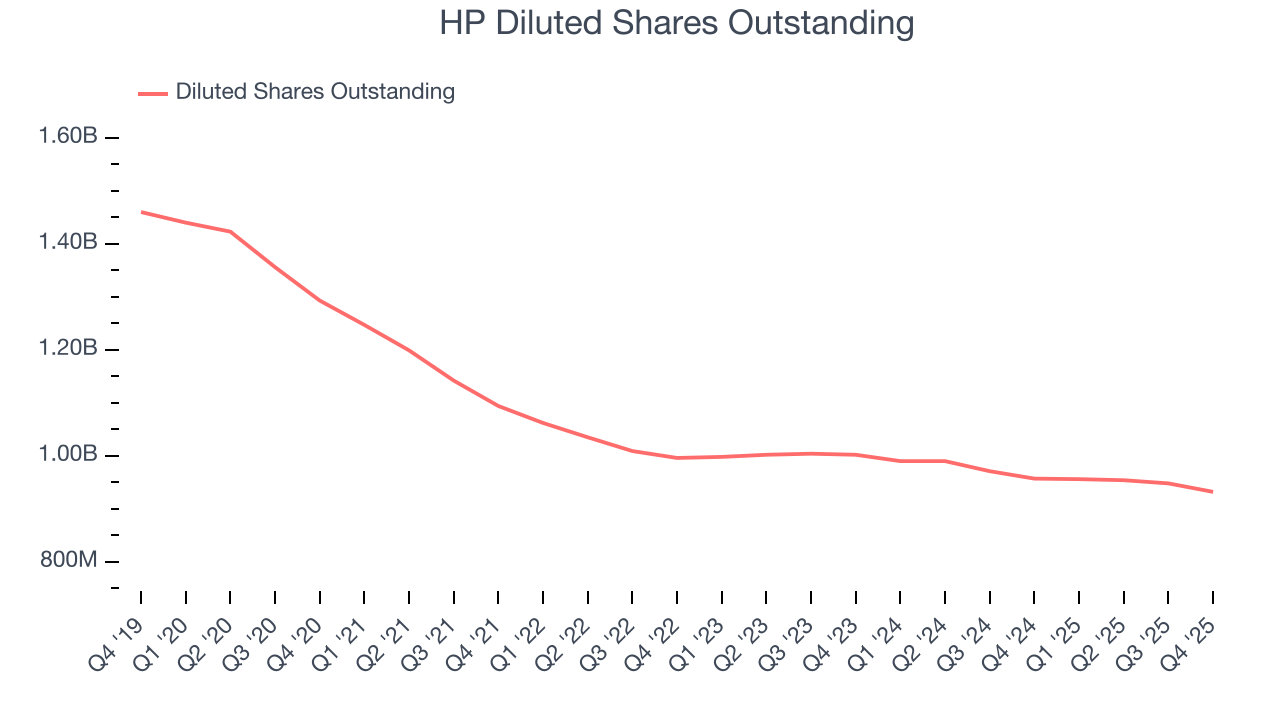
Like with revenue, we analyze EPS over a shorter period to see if we are missing a change in the business.
For HP, its two-year annual EPS declines of 2.6% show it’s continued to underperform. These results were bad no matter how you slice the data.
In Q4, HP reported adjusted EPS of $0.81, up from $0.74 in the same quarter last year. This print beat analysts’ estimates by 5.3%. Over the next 12 months, Wall Street expects HP’s full-year EPS of $3.20 to shrink by 9.4%.
8. Cash Is King
Free cash flow isn't a prominently featured metric in company financials and earnings releases, but we think it's telling because it accounts for all operating and capital expenses, making it tough to manipulate. Cash is king.
HP has shown decent cash profitability, giving it some flexibility to reinvest or return capital to investors. The company’s free cash flow margin averaged 6.2% over the last five years, slightly better than the broader business services sector.
Taking a step back, we can see that HP’s margin dropped by 4.6 percentage points during that time. If its declines continue, it could signal increasing investment needs and capital intensity.
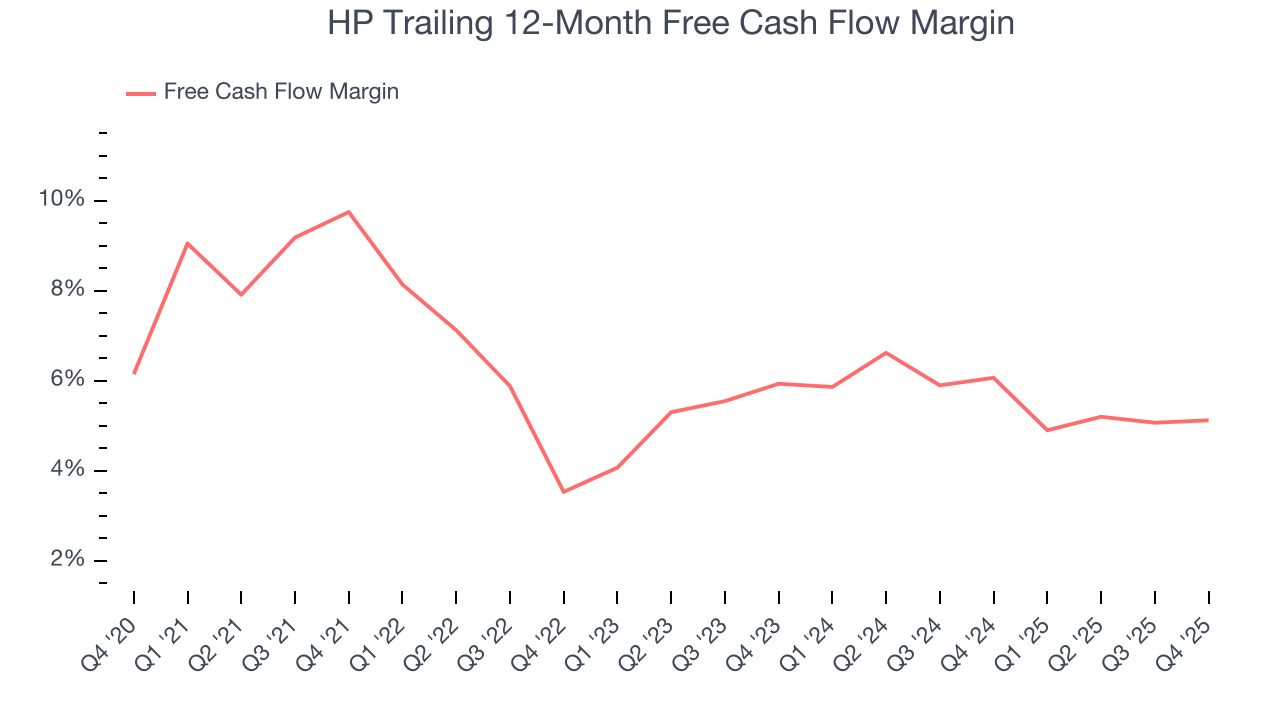
HP’s free cash flow clocked in at $150 million in Q4, equivalent to a 1% margin. This cash profitability was in line with the comparable period last year but below its five-year average. In a silo, this isn’t a big deal because investment needs can be seasonal, but we’ll be watching to see if the trend extrapolates into future quarters.
9. Return on Invested Capital (ROIC)
EPS and free cash flow tell us whether a company was profitable while growing its revenue. But was it capital-efficient? Enter ROIC, a metric showing how much operating profit a company generates relative to the money it has raised (debt and equity).
Although HP hasn’t been the highest-quality company lately because of its poor top-line performance, it found a few growth initiatives in the past that worked out wonderfully. Its four-year average ROIC was 61.3%, splendid for a business services business.
We like to invest in businesses with high returns, but the trend in a company’s ROIC is what often surprises the market and moves the stock price. Unfortunately, HP’s ROIC has decreased over the last few years. We like what management has done in the past, but its declining returns are perhaps a symptom of fewer profitable growth opportunities.
10. Balance Sheet Assessment
HP reported $3.15 billion of cash and $9.70 billion of debt on its balance sheet in the most recent quarter. As investors in high-quality companies, we primarily focus on two things: 1) that a company’s debt level isn’t too high and 2) that its interest payments are not excessively burdening the business.
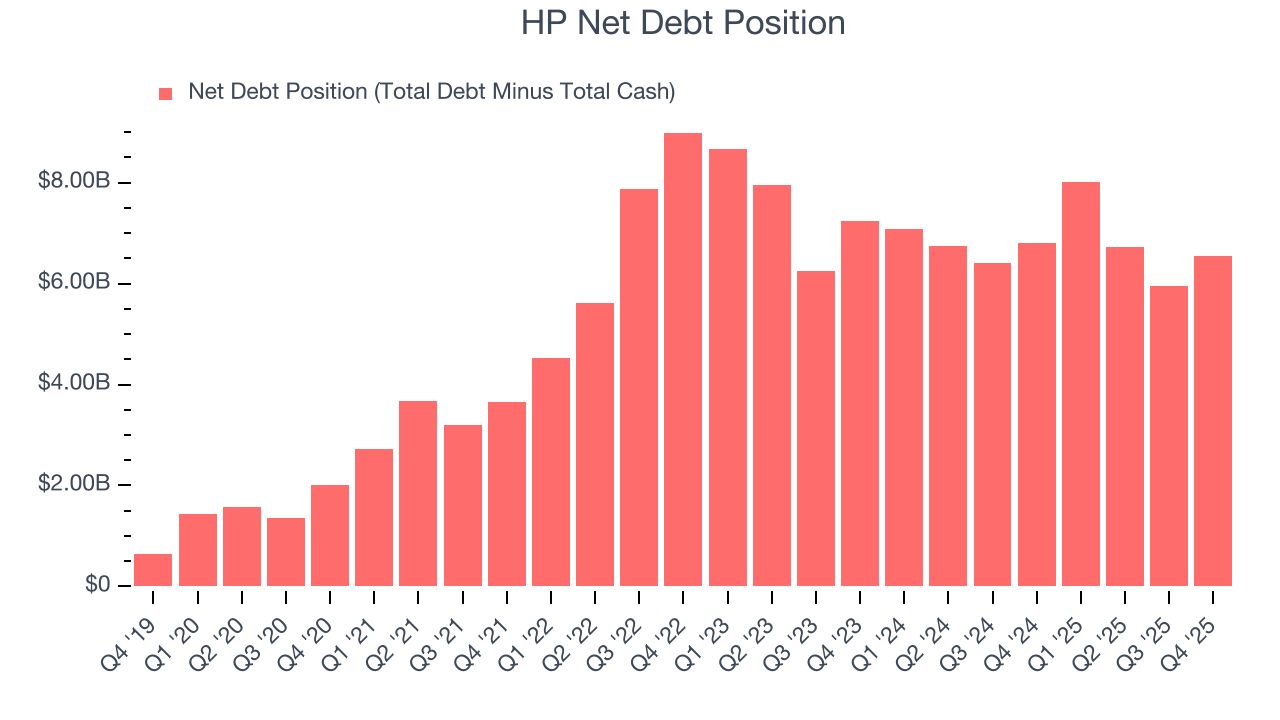
With $4.72 billion of EBITDA over the last 12 months, we view HP’s 1.4× net-debt-to-EBITDA ratio as safe. We also see its $325 million of annual interest expenses as appropriate. The company’s profits give it plenty of breathing room, allowing it to continue investing in growth initiatives.
11. Key Takeaways from HP’s Q4 Results
We enjoyed seeing HP beat analysts’ revenue expectations this quarter. We were also glad its EPS outperformed Wall Street’s estimates. On the other hand, its EPS guidance for next quarter missed. Overall, this print had some key positives. Investors were likely hoping for more, and shares traded down 5.4% to $17.21 immediately following the results.
12. Is Now The Time To Buy HP?
Updated: March 15, 2026 at 11:40 PM EDT
Before making an investment decision, investors should account for HP’s business fundamentals and valuation in addition to what happened in the latest quarter.
We see the value of companies helping their customers, but in the case of HP, we’re out. First off, its revenue growth was weak over the last five years, and analysts don’t see anything changing over the next 12 months. While its scale makes it a trusted partner with negotiating leverage, the downside is its diminishing returns show management's prior bets haven't worked out. On top of that, its projected EPS for the next year is lacking.
HP’s P/E ratio based on the next 12 months is 7x. While this valuation is optically cheap, the potential downside is huge given its shaky fundamentals. There are superior stocks to buy right now.
Wall Street analysts have a consensus one-year price target of $19.43 on the company (compared to the current share price of $18.92).