
Winnebago (WGO)
Winnebago keeps us up at night. Not only is its demand weak but also its falling returns on capital suggest it’s becoming less profitable.― StockStory Analyst Team
1. News
2. Summary
Why We Think Winnebago Will Underperform
Created to provide high-quality, affordable RVs to the post-war American family, Winnebago (NYSE:WGO) is a manufacturer of recreational vehicles, providing a range of motorhomes, travel trailers, and fifth-wheel products for outdoor and adventure lifestyles.
- Sales tumbled by 3.7% annually over the last two years, showing market trends are working against its favor during this cycle
- Falling earnings per share over the last five years has some investors worried as stock prices ultimately follow EPS over the long term
- High input costs result in an inferior gross margin of 16.2% that must be offset through higher volumes


Winnebago doesn’t meet our quality criteria. We’ve identified better opportunities elsewhere.
Why There Are Better Opportunities Than Winnebago


Winnebago is trading at $32.63 per share, or 13.3x forward P/E. Yes, this valuation multiple is lower than that of other industrials peers, but we’ll remind you that you often get what you pay for.
We’d rather pay up for companies with elite fundamentals than get a bargain on weak ones. Cheap stocks can be value traps, and as their performance deteriorates, they will stay cheap or get even cheaper.
3. Winnebago (WGO) Research Report: Q1 CY2026 Update
RV Manufacturer Winnebago (NYSE:WGO) announced better-than-expected revenue in Q1 CY2026, with sales up 6% year on year to $657.4 million. On the other hand, the company’s full-year revenue guidance of $2.9 billion at the midpoint came in 0.7% below analysts’ estimates. Its non-GAAP profit of $0.27 per share was 11.3% above analysts’ consensus estimates.
Winnebago (WGO) Q1 CY2026 Highlights:
- Revenue: $657.4 million vs analyst estimates of $627.2 million (6% year-on-year growth, 4.8% beat)
- Adjusted EPS: $0.27 vs analyst estimates of $0.24 (11.3% beat)
- The company reconfirmed its revenue guidance for the full year of $2.9 billion at the midpoint
- Management reiterated its full-year Adjusted EPS guidance of $2.45 at the midpoint
- Operating Margin: 1.8%, in line with the same quarter last year
- Free Cash Flow was -$29.1 million compared to -$18.9 million in the same quarter last year
- Market Capitalization: $990 million
Company Overview
Created to provide high-quality, affordable RVs to the post-war American family, Winnebago (NYSE:WGO) is a manufacturer of recreational vehicles, providing a range of motorhomes, travel trailers, and fifth-wheel products for outdoor and adventure lifestyles.
Winnebago is a leading North American manufacturer of recreational vehicles (RVs) and marine products, with a diverse portfolio catering to leisure travel and outdoor recreational activities.
The company operates through three main segments: Towable RV, Motorhome RV, and Marine. In the Towable RV segment, Winnebago produces conventional travel trailers and fifth wheels under the Winnebago and Grand Design brand names. The Motorhome RV segment manufactures Class A, Class B, and Class C motorhomes under the Winnebago and Newmar brands. Winnebago's Marine segment produces premium quality recreational boats under the Chris-Craft and Barletta brands.
The company also manufactures specialty vehicles, including accessibility-enhanced motorhomes and custom commercial vehicles. Recently, Winnebago acquired Lithionics, a lithium-ion battery solutions provider, expanding its offerings in advanced power systems for RVs and other applications.
Winnebago Industries primarily generates revenue through wholesale sales of RVs and marine products to independent dealers. The company focuses on manufacturing, transferring inventory risk to dealers who handle retail sales. Revenue is recognized upon product shipment to dealers. Winnebago also earns additional revenue from parts sales, service work, specialty vehicles, and battery solutions, but these are secondary to its main wholesale business model.
4. Automobile Manufacturing
Much capital investment and technical know-how are needed to manufacture functional, safe, and aesthetically pleasing automobiles for the mass market. Barriers to entry are therefore high, and auto manufacturers with economies of scale can boast strong economic moats. However, this doesn’t insulate them from new entrants, as electric vehicles (EVs) have entered the market and are upending it. This has forced established manufacturers to not only contend with emerging EV-first competitors but also decide how much they want to invest in these disruptive technologies, which will likely cannibalize their legacy offerings.
Winnebago's competitors in the recreational vehicle market include THOR Industries (NYSE:THO), Forest River (a subsidiary of Berkshire Hathaway NYSE:BKH.B), and REV Group (NYSE:REVG).
5. Revenue Growth
Examining a company’s long-term performance can provide clues about its quality. Any business can experience short-term success, but top-performing ones enjoy sustained growth for years. Unfortunately, Winnebago struggled to consistently increase demand as its $2.91 billion of sales for the trailing 12 months was close to its revenue five years ago. This was below our standards and is a sign of poor business quality.
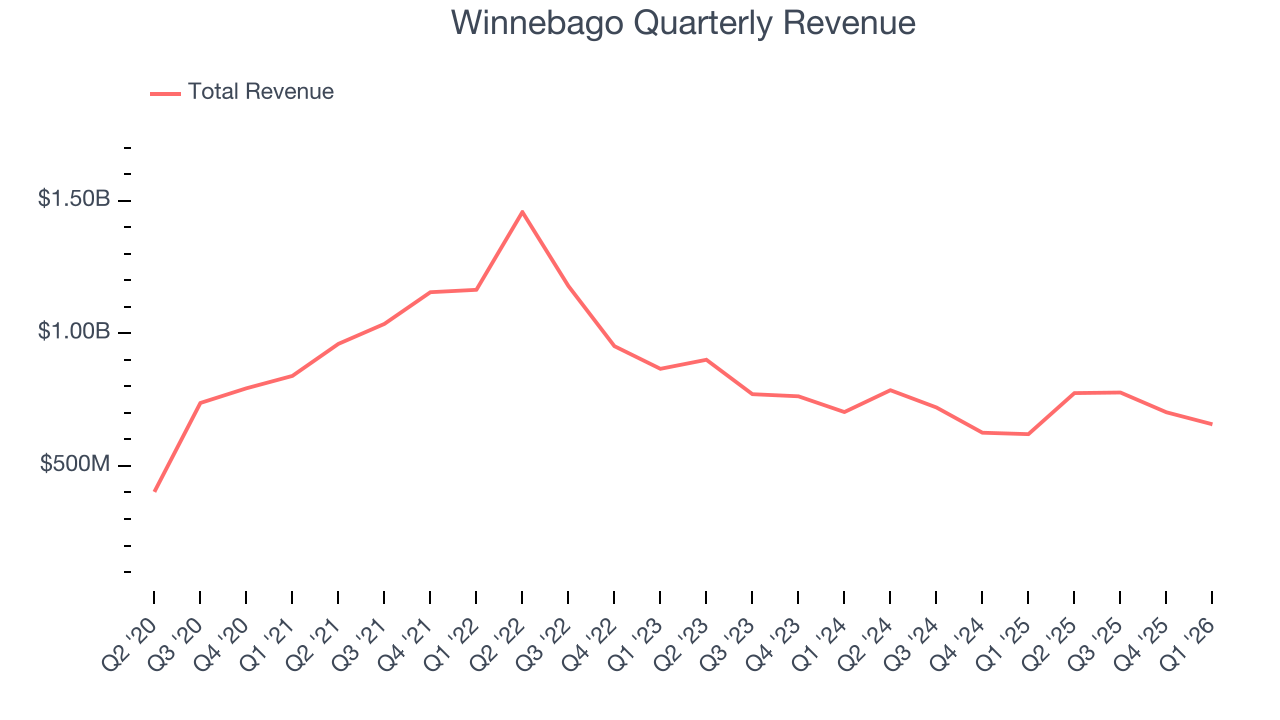
Long-term growth is the most important, but within industrials, a half-decade historical view may miss new industry trends or demand cycles. Winnebago’s recent performance shows its demand remained suppressed as its revenue has declined by 3.7% annually over the last two years. 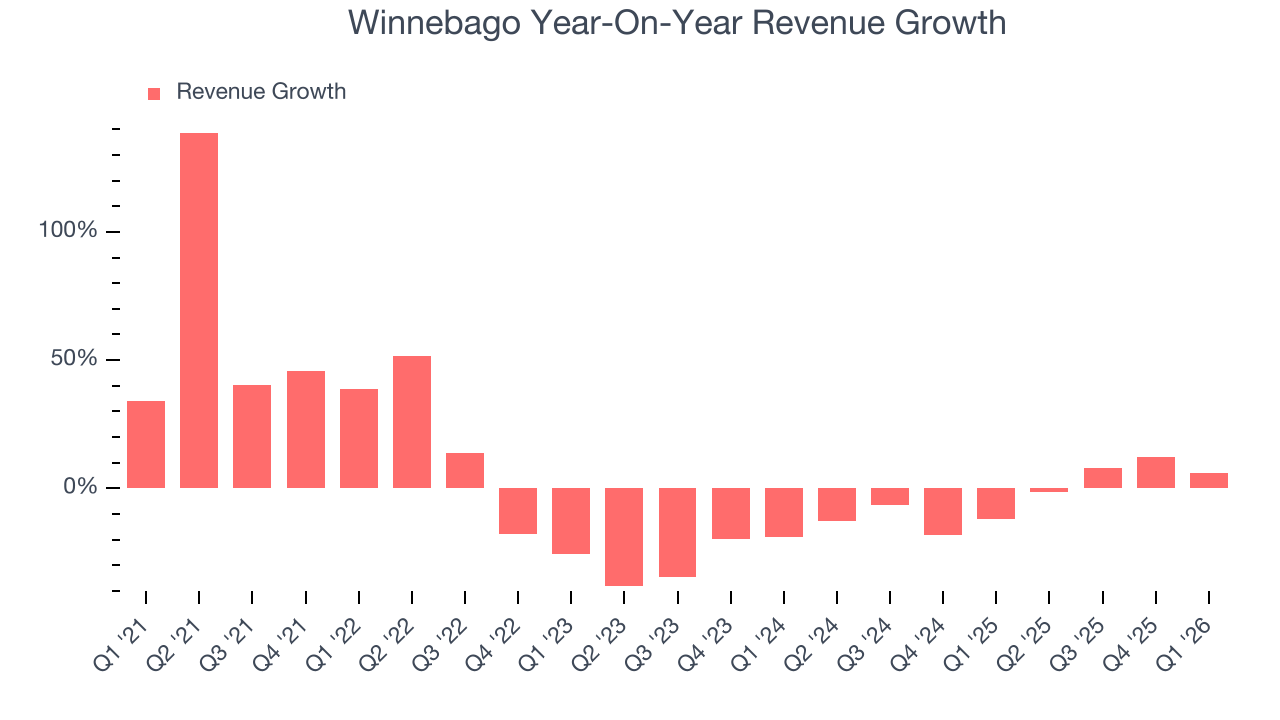
We can dig further into the company’s revenue dynamics by analyzing its most important segments, Motorhomes and Towables, which are 46.3% and 39.9% of revenue. Over the last two years, Winnebago’s Motorhomes revenue (homes on wheels) averaged 5.4% year-on-year growth while its Towables revenue (non-motorized vehicles) was flat. 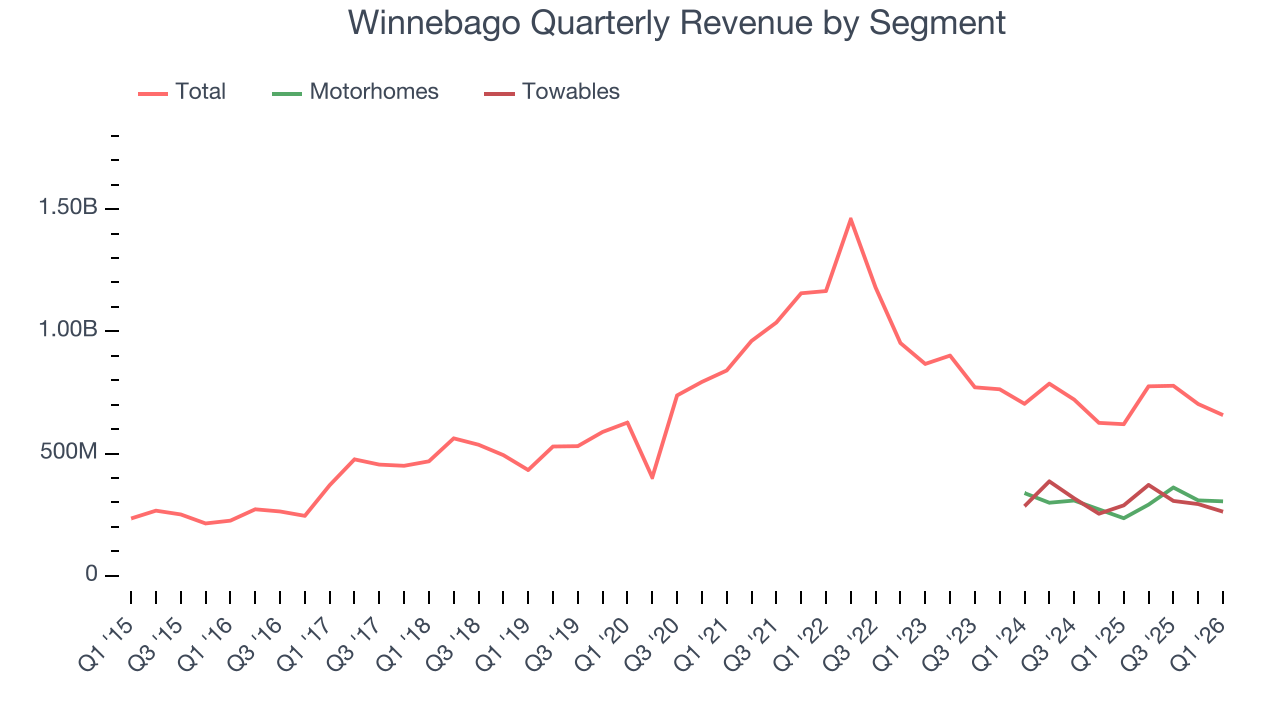
This quarter, Winnebago reported year-on-year revenue growth of 6%, and its $657.4 million of revenue exceeded Wall Street’s estimates by 4.8%.
Looking ahead, sell-side analysts expect revenue to grow 1.3% over the next 12 months. While this projection implies its newer products and services will spur better top-line performance, it is still below average for the sector.
6. Gross Margin & Pricing Power
Winnebago has bad unit economics for an industrials business, signaling it operates in a competitive market. This is also because it’s an automobile manufacturer.
Automobile manufacturers have structurally lower profitability as they often break even on the initial sale of vehicles and instead make money on parts and servicing, which come many years later - this explains why new entrants such as Rivian, Lucid, and Nikola have negative gross margins. As you can see below, these dynamics culminated in an average 16.2% gross margin for Winnebago over the last five years.
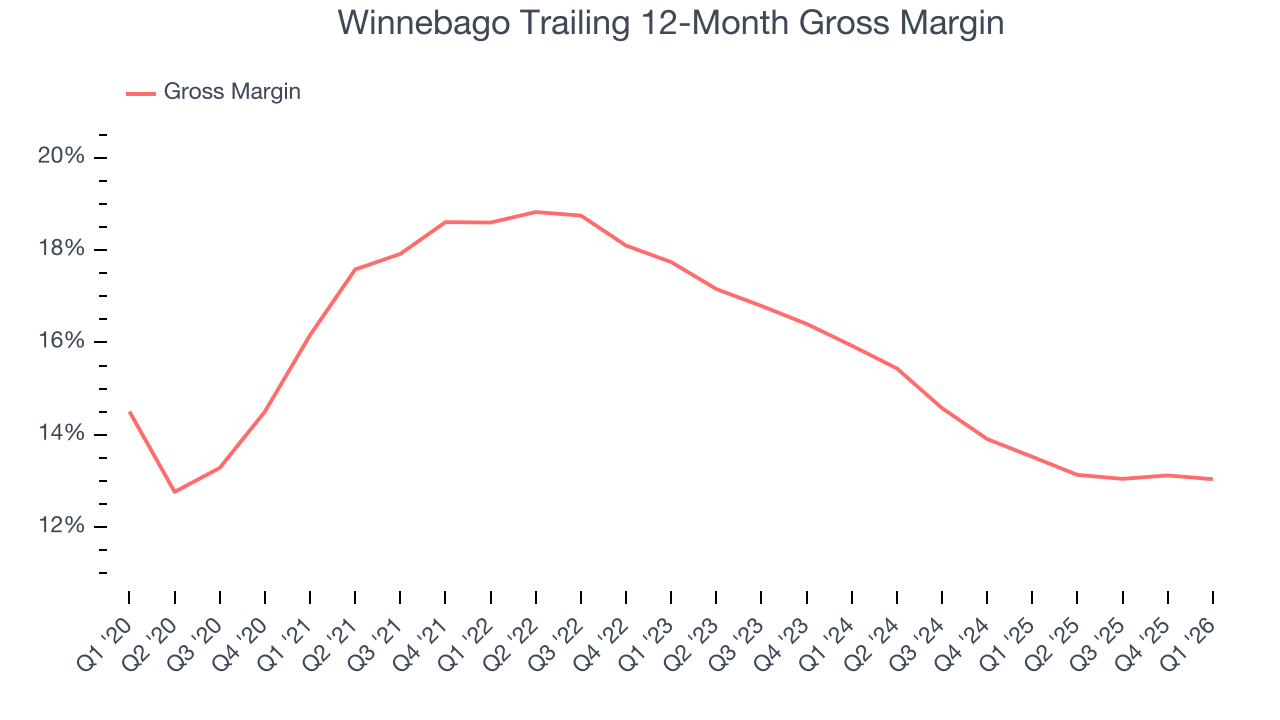
In Q1, Winnebago produced a 13% gross profit margin, in line with the same quarter last year. On a wider time horizon, the company’s full-year margin has remained steady over the past four quarters, suggesting its input costs (such as raw materials and manufacturing expenses) have been stable and it isn’t under pressure to lower prices.
7. Operating Margin
Operating margin is a key measure of profitability. Think of it as net income - the bottom line - excluding the impact of taxes and interest on debt, which are less connected to business fundamentals.
Winnebago was profitable over the last five years but held back by its large cost base. Its average operating margin of 7.3% was weak for an industrials business. This result isn’t too surprising given its low gross margin as a starting point.
Analyzing the trend in its profitability, Winnebago’s operating margin decreased by 9.1 percentage points over the last five years. Winnebago’s performance was poor no matter how you look at it - it shows that costs were rising and it couldn’t pass them onto its customers.
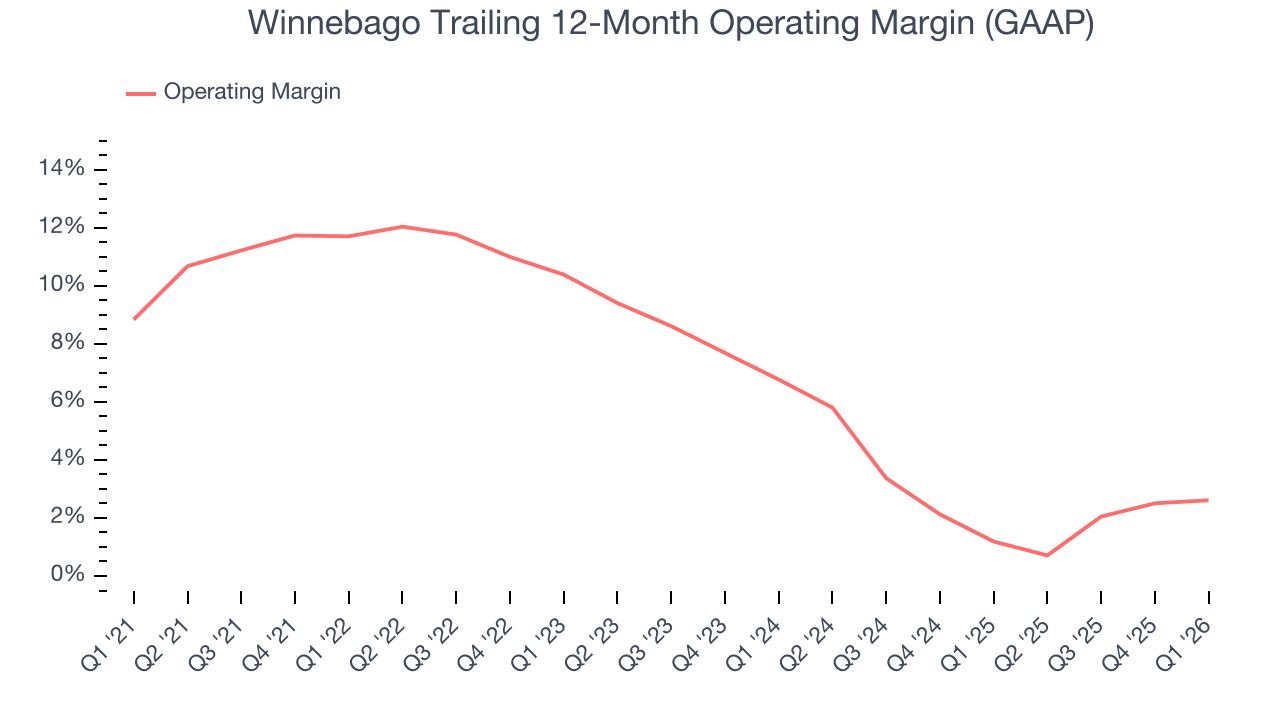
In Q1, Winnebago generated an operating margin profit margin of 1.8%, in line with the same quarter last year. This indicates the company’s cost structure has recently been stable.
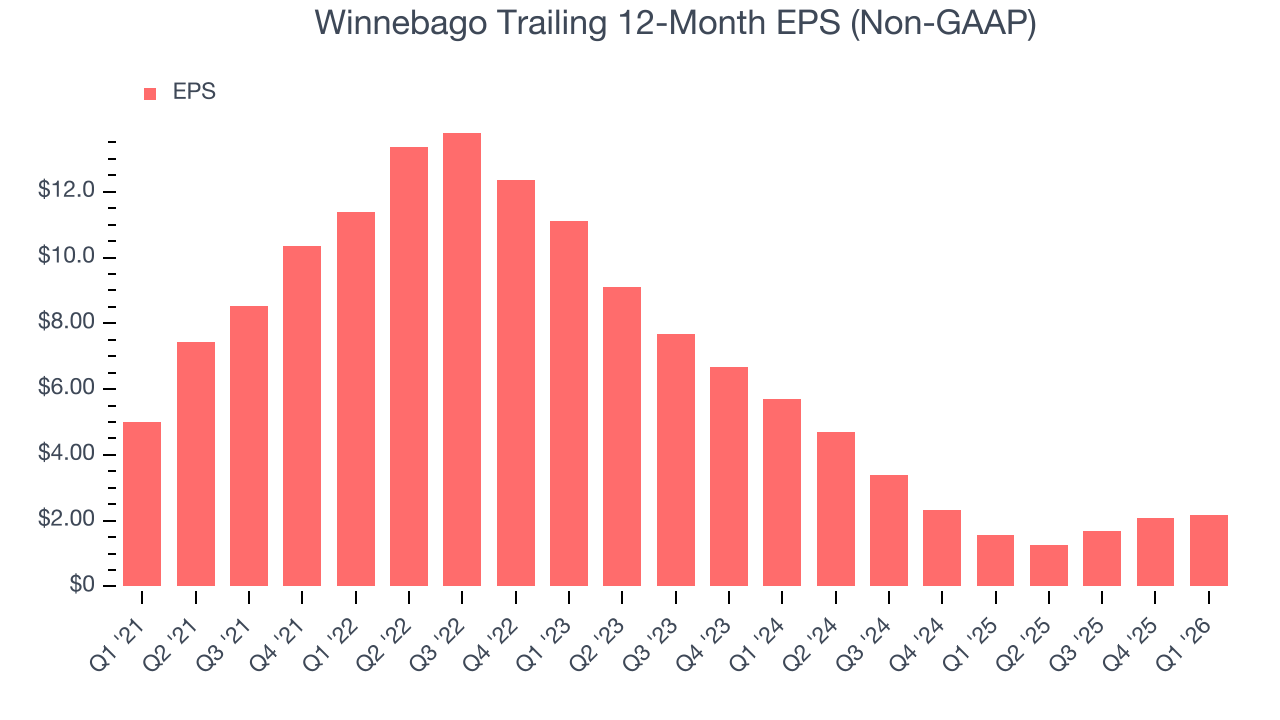
8. Earnings Per Share
Revenue trends explain a company’s historical growth, but the long-term change in earnings per share (EPS) points to the profitability of that growth – for example, a company could inflate its sales through excessive spending on advertising and promotions.
Sadly for Winnebago, its EPS declined by 15.4% annually over the last five years while its revenue was flat. This tells us the company struggled because its fixed cost base made it difficult to adjust to choppy demand.
We can take a deeper look into Winnebago’s earnings to better understand the drivers of its performance. As we mentioned earlier, Winnebago’s operating margin was flat this quarter but declined by 9.1 percentage points over the last five years. This was the most relevant factor (aside from the revenue impact) behind its lower earnings; interest expenses and taxes can also affect EPS but don’t tell us as much about a company’s fundamentals.
Like with revenue, we analyze EPS over a more recent period because it can provide insight into an emerging theme or development for the business.
For Winnebago, its two-year annual EPS declines of 38.4% show it’s continued to underperform. These results were bad no matter how you slice the data.
In Q1, Winnebago reported adjusted EPS of $0.27, up from $0.19 in the same quarter last year. This print easily cleared analysts’ estimates, and shareholders should be content with the results. Over the next 12 months, Wall Street expects Winnebago’s full-year EPS of $2.17 to grow 23.7%.
9. Cash Is King
Although earnings are undoubtedly valuable for assessing company performance, we believe cash is king because you can’t use accounting profits to pay the bills.
Winnebago has shown weak cash profitability relative to peers over the last five years, giving the company fewer opportunities to return capital to shareholders. Its free cash flow margin averaged 4.8%, below what we’d expect for an industrials business.
Taking a step back, an encouraging sign is that Winnebago’s margin expanded by 1 percentage points during that time. The company’s improvement shows it’s heading in the right direction, and we can see it became a less capital-intensive business because its free cash flow profitability rose while its operating profitability fell.
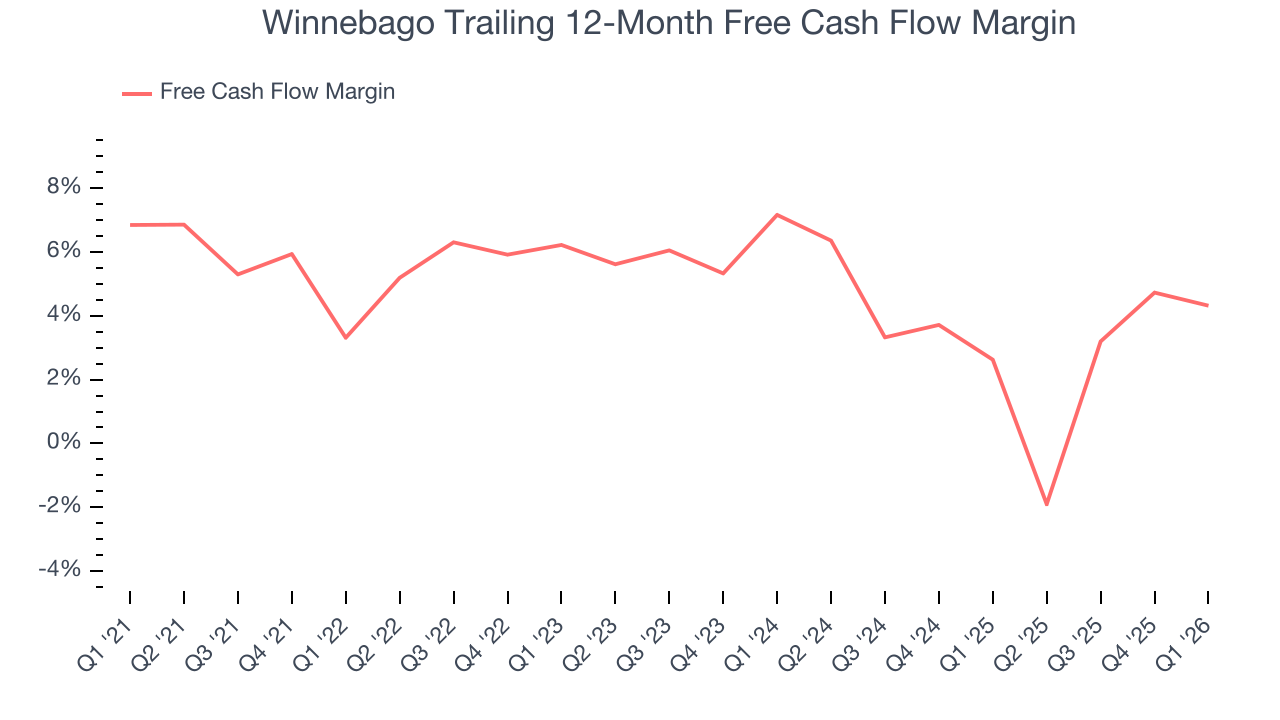
Winnebago burned through $29.1 million of cash in Q1, equivalent to a negative 4.4% margin. The company’s cash burn was similar to its $18.9 million of lost cash in the same quarter last year. These numbers deviate from its longer-term margin, indicating it is a seasonal business that must build up inventory during certain quarters.
10. Return on Invested Capital (ROIC)
EPS and free cash flow tell us whether a company was profitable while growing its revenue. But was it capital-efficient? A company’s ROIC explains this by showing how much operating profit it makes compared to the money it has raised (debt and equity).
Although Winnebago hasn’t been the highest-quality company lately because of its poor revenue and EPS performance, it historically found a few growth initiatives that worked. Its five-year average ROIC was 12.9%, higher than most industrials businesses.
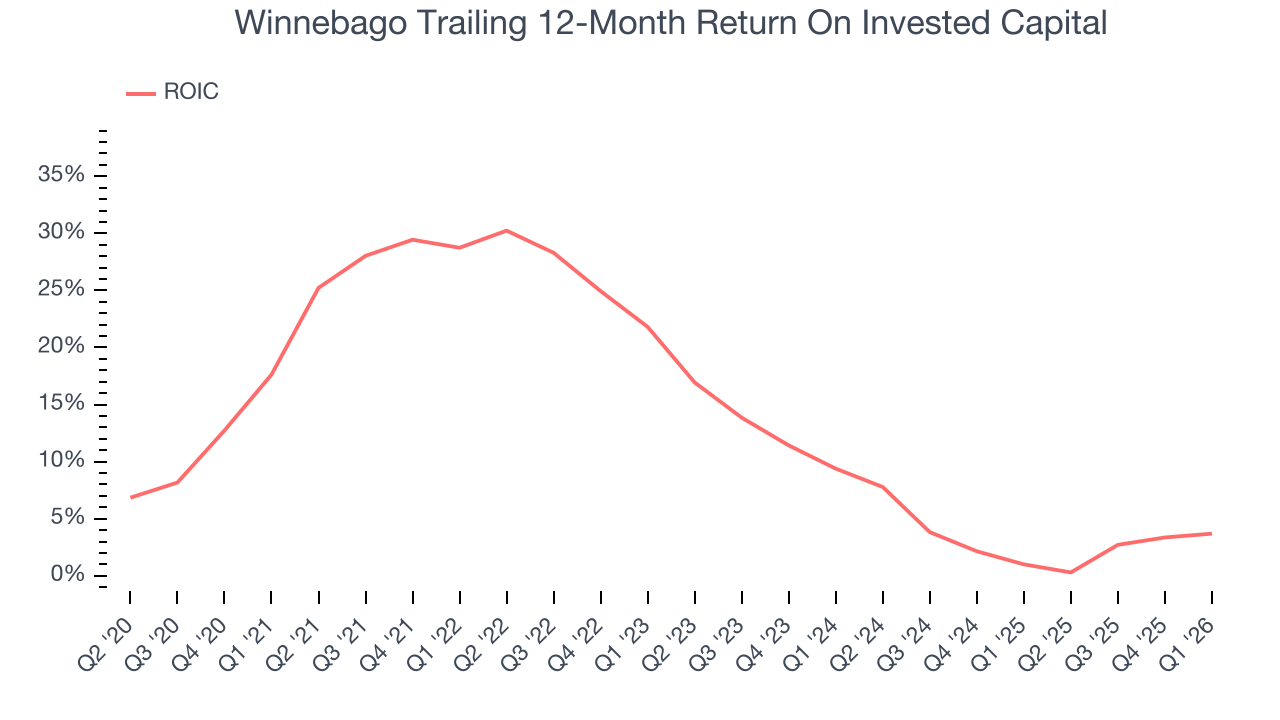
We like to invest in businesses with high returns, but the trend in a company’s ROIC is what often surprises the market and moves the stock price. Unfortunately, Winnebago’s ROIC has decreased significantly over the last few years. We like what management has done in the past, but its declining returns are perhaps a symptom of fewer profitable growth opportunities.
11. Balance Sheet Assessment
Winnebago reported $47.4 million of cash and $478.2 million of debt on its balance sheet in the most recent quarter. As investors in high-quality companies, we primarily focus on two things: 1) that a company’s debt level isn’t too high and 2) that its interest payments are not excessively burdening the business.
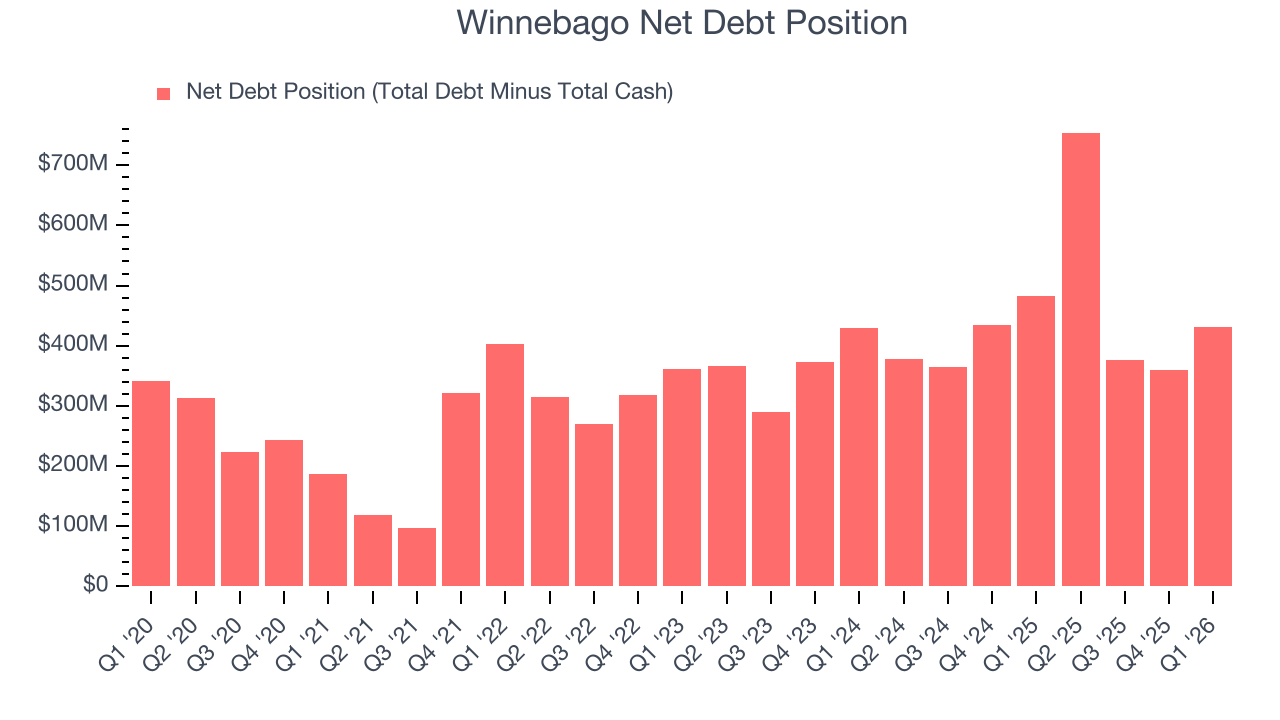
With $139.3 million of EBITDA over the last 12 months, we view Winnebago’s 3.1× net-debt-to-EBITDA ratio as safe. We also see its $13 million of annual interest expenses as appropriate. The company’s profits give it plenty of breathing room, allowing it to continue investing in growth initiatives.
12. Key Takeaways from Winnebago’s Q1 Results
We were impressed by how significantly Winnebago blew past analysts’ revenue expectations this quarter. We were also glad its EPS outperformed Wall Street’s estimates. On the other hand, its full-year EPS guidance fell slightly short of Wall Street’s estimates. Zooming out, we think this was a mixed quarter. Investors were likely hoping for more, and shares traded down 2.2% to $34.32 immediately following the results.
13. Is Now The Time To Buy Winnebago?
Updated: March 25, 2026 at 11:53 PM EDT
Are you wondering whether to buy Winnebago or pass? We urge investors to not only consider the latest earnings results but also longer-term business quality and valuation as well.
We cheer for all companies making their customers lives easier, but in the case of Winnebago, we’ll be cheering from the sidelines. To kick things off, its revenue growth was weak over the last five years, and analysts don’t see anything changing over the next 12 months. While its projected EPS for the next year implies the company’s fundamentals will improve, the downside is its diminishing returns show management's prior bets haven't worked out. On top of that, its declining EPS over the last five years makes it a less attractive asset to the public markets.
Winnebago’s P/E ratio based on the next 12 months is 13.3x. This valuation multiple is fair, but we don’t have much confidence in the company. There are more exciting stocks to buy at the moment.
Wall Street analysts have a consensus one-year price target of $48.75 on the company (compared to the current share price of $32.63).
Although the price target is bullish, readers should exercise caution because analysts tend to be overly optimistic. The firms they work for, often big banks, have relationships with companies that extend into fundraising, M&A advisory, and other rewarding business lines. As a result, they typically hesitate to say bad things for fear they will lose out. We at StockStory do not suffer from such conflicts of interest, so we’ll always tell it like it is.