
Goodyear (GT)
We’re skeptical of Goodyear. Its weak sales growth and low returns on capital show it struggled to generate demand and profits.― StockStory Analyst Team
1. News


2. Summary
Why We Think Goodyear Will Underperform
With its iconic blimp floating above major sporting events since 1925, Goodyear (NYSE:GT) is one of the world's largest tire manufacturers, producing and selling tires for automobiles, trucks, aircraft, and other vehicles, along with related services.
- Projected sales decline of 4.7% over the next 12 months indicates demand will continue deteriorating
- Cash burn makes us question whether it can achieve sustainable long-term growth
- The good news is that its earnings growth has outpaced its peers over the last five years as its EPS has compounded at 17.5% annually


Goodyear falls below our quality standards. We believe there are better opportunities elsewhere.
Why There Are Better Opportunities Than Goodyear


At $6.19 per share, Goodyear trades at 12.7x forward P/E. This multiple is cheaper than most industrials peers, but we think this is justified.
Cheap stocks can look like a great deal at first glance, but they can be value traps. They often have less earnings power, meaning there is more reliance on a re-rating to generate good returns - an unlikely scenario for low-quality companies.
3. Goodyear (GT) Research Report: Q4 CY2025 Update
Global tire manufacturer Goodyear (NYSE:GT) reported Q4 CY2025 results beating Wall Street’s revenue expectations, but sales were flat year on year at $4.92 billion. Its GAAP profit of $0.36 per share was 41% below analysts’ consensus estimates.
Goodyear (GT) Q4 CY2025 Highlights:
- Revenue: $4.92 billion vs analyst estimates of $4.86 billion (flat year on year, 1.3% beat)
- EPS (GAAP): $0.36 vs analyst expectations of $0.61 (41% miss)
- Operating Margin: 6.6%, up from 5.3% in the same quarter last year
- Free Cash Flow Margin: 27.2%, up from 20.5% in the same quarter last year
- Market Capitalization: $3.02 billion
Company Overview
With its iconic blimp floating above major sporting events since 1925, Goodyear (NYSE:GT) is one of the world's largest tire manufacturers, producing and selling tires for automobiles, trucks, aircraft, and other vehicles, along with related services.
The company's business is divided into three geographic segments: Americas (its largest by revenue), Europe/Middle East/Africa (EMEA), and Asia Pacific. Each region manufactures and distributes tires under various brands including Goodyear, Cooper, Dunlop, Kelly, and others. Beyond manufacturing, Goodyear operates approximately 800 retail outlets providing automotive services, and runs about 230 commercial tire and service centers supporting trucking fleets.
Goodyear's product lineup is extensive, covering virtually every tire application from everyday passenger cars to specialized mining equipment. For consumer vehicles, the company offers multiple product families like Assurance for everyday drivers, Eagle for performance, and Wrangler for SUVs and trucks. Each product line targets specific performance characteristics such as all-weather grip, fuel efficiency, or durability in tough conditions.
The company also provides commercial services including truck tire retreading, which extends tire life by replacing worn tread while reusing the tire casing. This creates cost savings for fleet operators while reducing environmental impact. Goodyear manufactures its products in 53 facilities across 20 countries, with a distribution network that spans most countries worldwide, selling through independent dealers, company-owned stores, and wholesale distributors.
4. Automobile Manufacturing
Much capital investment and technical know-how are needed to manufacture functional, safe, and aesthetically pleasing automobiles for the mass market. Barriers to entry are therefore high, and auto manufacturers with economies of scale can boast strong economic moats. However, this doesn’t insulate them from new entrants, as electric vehicles (EVs) have entered the market and are upending it. This has forced established manufacturers to not only contend with emerging EV-first competitors but also decide how much they want to invest in these disruptive technologies, which will likely cannibalize their legacy offerings.
Goodyear's primary global competitors are Bridgestone (based in Japan) and Michelin (based in France). Other significant competitors include Continental, Pirelli, Hankook, Kumho, Yokohama, and numerous regional tire manufacturers, along with low-cost imports primarily from Asia.
5. Revenue Growth
A company’s long-term performance is an indicator of its overall quality. Any business can put up a good quarter or two, but the best consistently grow over the long haul. Thankfully, Goodyear’s 8.2% annualized revenue growth over the last five years was decent. Its growth was slightly above the average industrials company and shows its offerings resonate with customers.
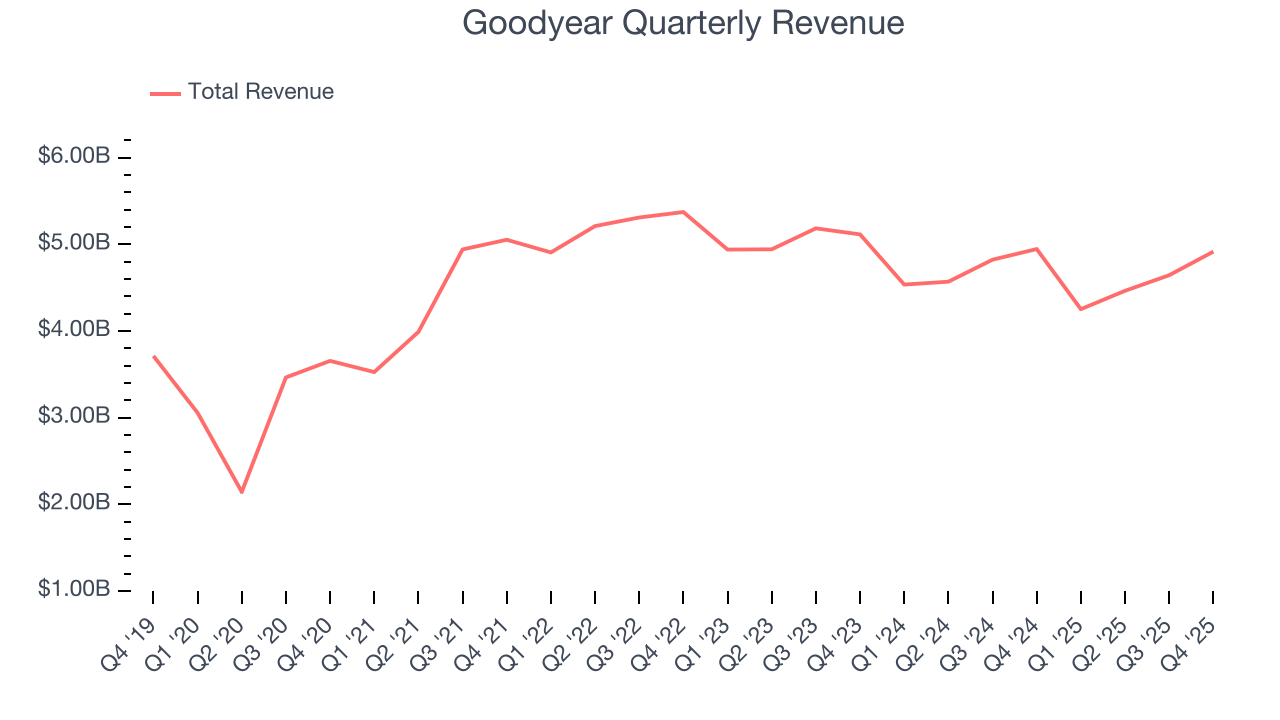
We at StockStory place the most emphasis on long-term growth, but within industrials, a half-decade historical view may miss cycles, industry trends, or a company capitalizing on catalysts such as a new contract win or a successful product line. Goodyear’s recent performance marks a sharp pivot from its five-year trend as its revenue has shown annualized declines of 4.8% over the last two years. Goodyear isn’t alone in its struggles as the Automobile Manufacturing industry experienced a cyclical downturn, with many similar businesses observing lower sales at this time. 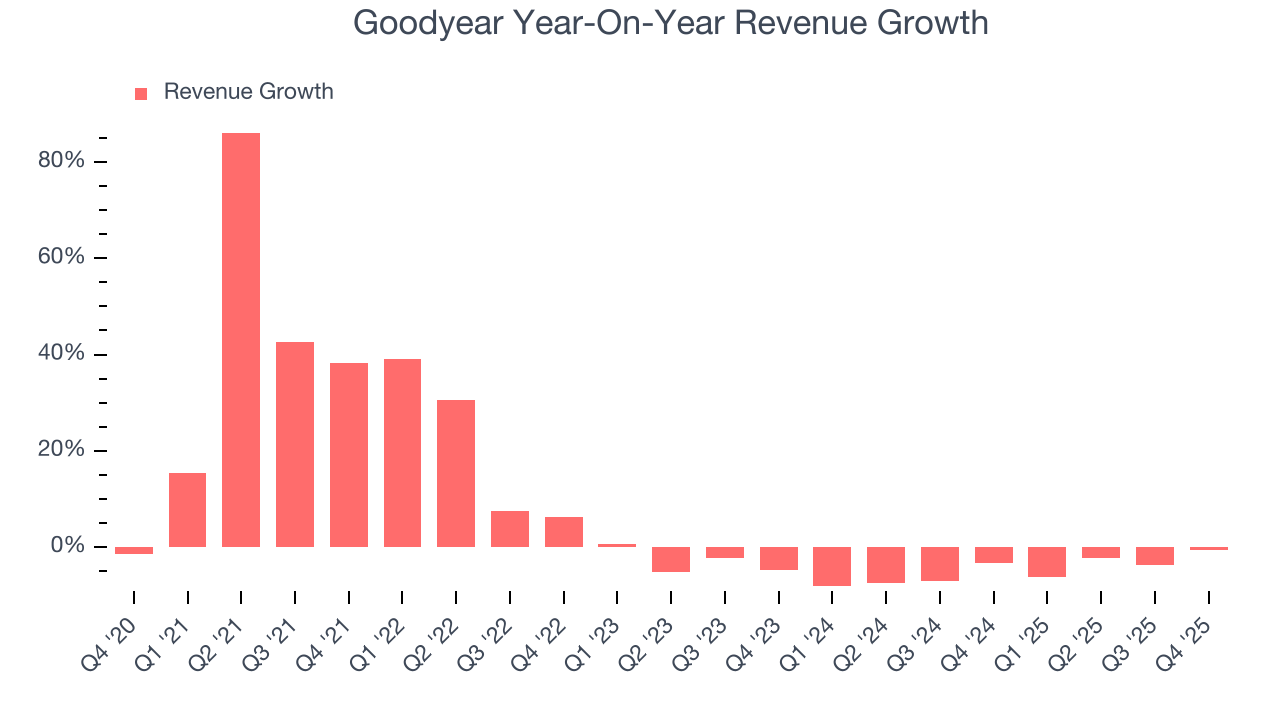
This quarter, Goodyear’s $4.92 billion of revenue was flat year on year but beat Wall Street’s estimates by 1.3%.
Looking ahead, sell-side analysts expect revenue to grow 2% over the next 12 months. While this projection indicates its newer products and services will spur better top-line performance, it is still below the sector average.
6. Gross Margin & Pricing Power
Goodyear has bad unit economics for an industrials business, signaling it operates in a competitive market. This is also because it’s an automobile manufacturer.
Automobile manufacturers have structurally lower profitability as they often break even on the initial sale of vehicles and instead make money on parts and servicing, which come many years later - this explains why new entrants such as Rivian, Lucid, and Nikola have negative gross margins. As you can see below, these dynamics culminated in an average 19.1% gross margin for Goodyear over the last five years.
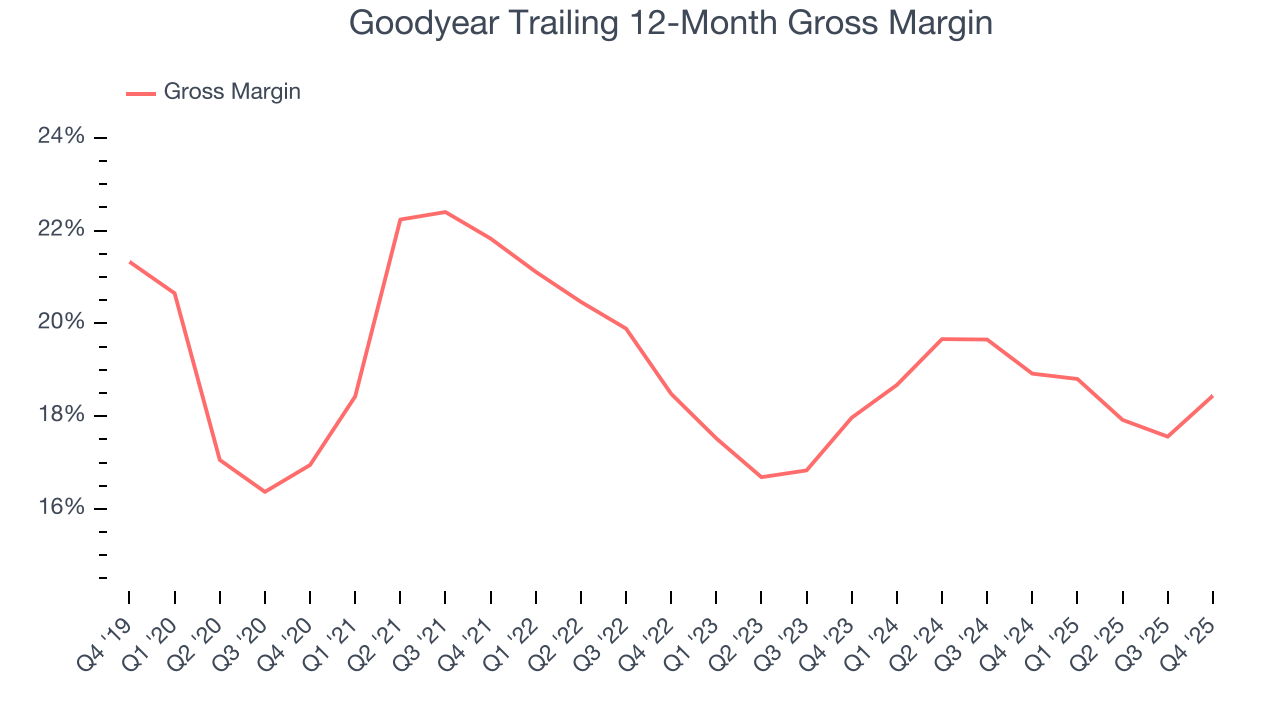
Goodyear produced a 20.9% gross profit margin in Q4, up 3.3 percentage points year on year. On a wider time horizon, the company’s full-year margin has remained steady over the past four quarters, suggesting its input costs (such as raw materials and manufacturing expenses) have been stable and it isn’t under pressure to lower prices.
7. Operating Margin
Goodyear was profitable over the last five years but held back by its large cost base. Its average operating margin of 3.6% was weak for an industrials business. This result isn’t too surprising given its low gross margin as a starting point.
Looking at the trend in its profitability, Goodyear’s operating margin decreased by 3 percentage points over the last five years. This raises questions about the company’s expense base because its revenue growth should have given it leverage on its fixed costs, resulting in better economies of scale and profitability. We’ve noticed many Automobile Manufacturing companies also saw their margins fall (along with revenue, as mentioned above) because the cycle turned in the wrong direction, but Goodyear’s performance was poor no matter how you look at it. It shows that costs were rising and it couldn’t pass them onto its customers.
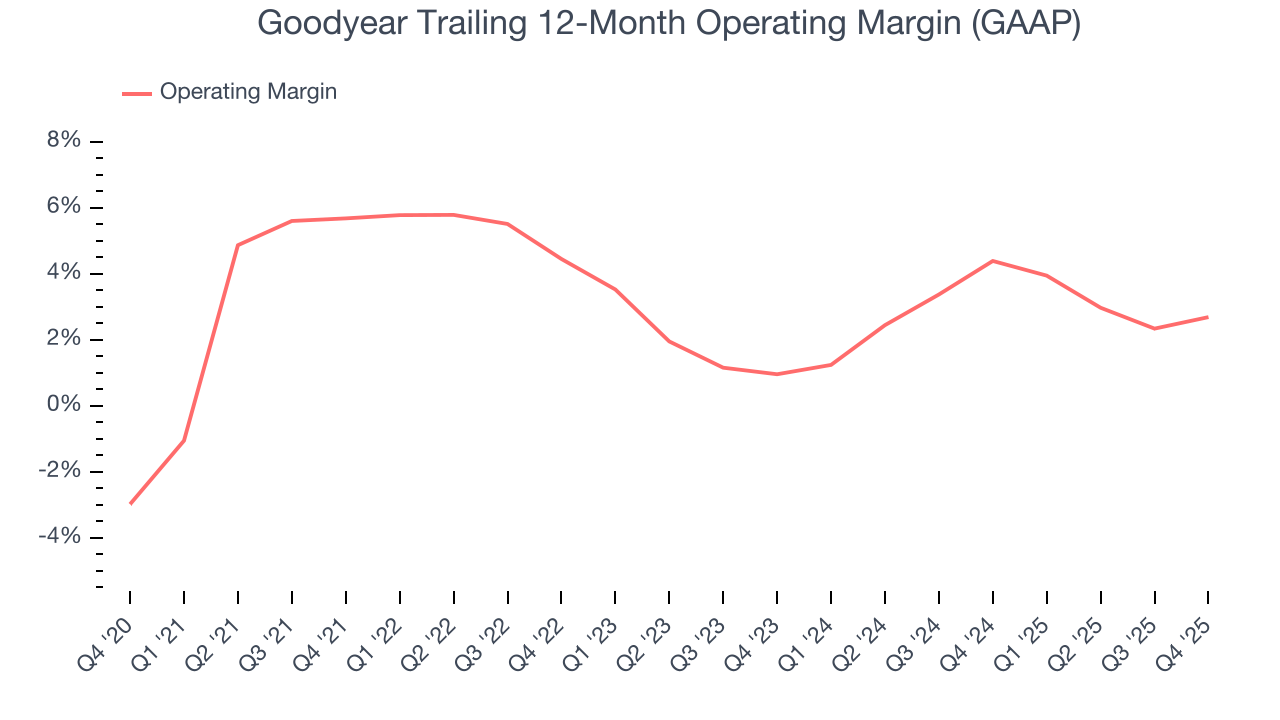
In Q4, Goodyear generated an operating margin profit margin of 6.6%, up 1.3 percentage points year on year. Since its gross margin expanded more than its operating margin, we can infer that leverage on its cost of sales was the primary driver behind the recently higher efficiency.
8. Earnings Per Share
We track the long-term change in earnings per share (EPS) for the same reason as long-term revenue growth. Compared to revenue, however, EPS highlights whether a company’s growth is profitable.
Goodyear’s earnings losses deepened over the last five years as its EPS dropped 2.3% annually. We tend to steer our readers away from companies with falling EPS, where diminishing earnings could imply changing secular trends and preferences. If the tide turns unexpectedly, Goodyear’s low margin of safety could leave its stock price susceptible to large downswings.
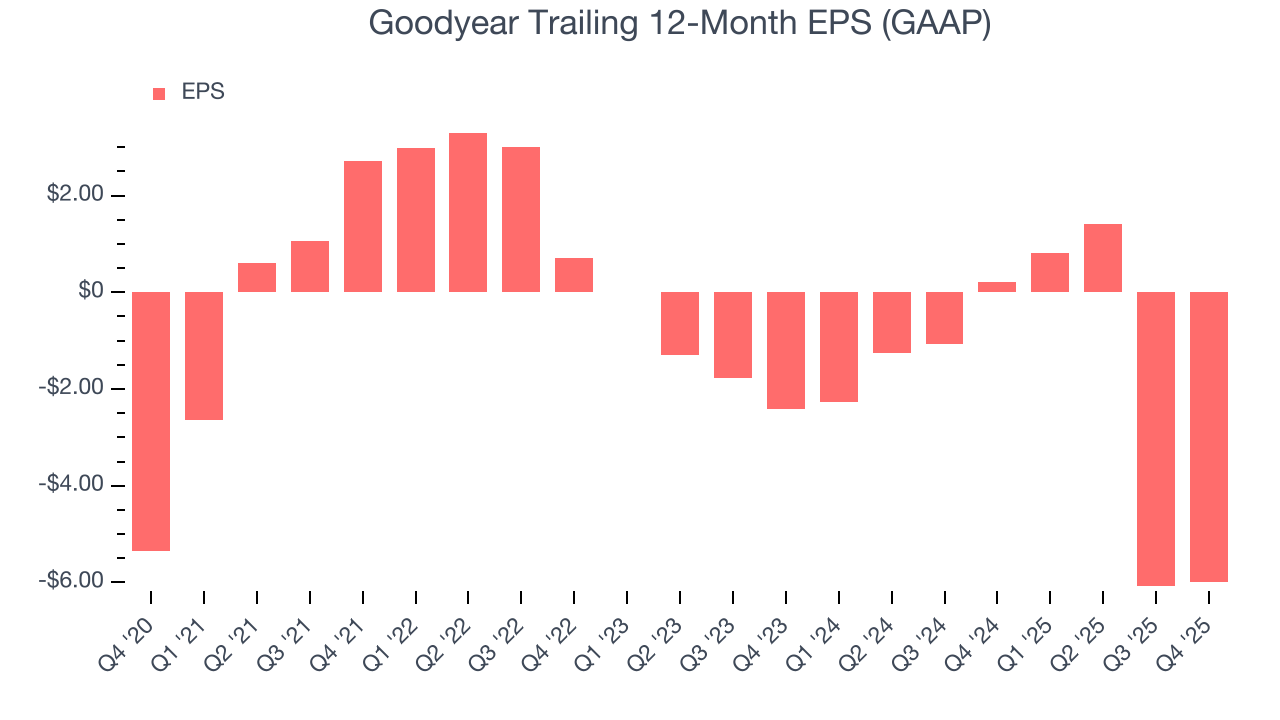
Like with revenue, we analyze EPS over a shorter period to see if we are missing a change in the business.
For Goodyear, its two-year annual EPS declines of 57.4% show it’s continued to underperform. These results were bad no matter how you slice the data.
In Q4, Goodyear reported EPS of $0.36, up from $0.26 in the same quarter last year. Despite growing year on year, this print missed analysts’ estimates. Over the next 12 months, Wall Street is optimistic. Analysts forecast Goodyear’s full-year EPS of negative $5.99 will flip to positive $1.02.
9. Cash Is King
Free cash flow isn't a prominently featured metric in company financials and earnings releases, but we think it's telling because it accounts for all operating and capital expenses, making it tough to manipulate. Cash is king.
While Goodyear posted positive free cash flow this quarter, the broader story hasn’t been so clean. Goodyear’s demanding reinvestments have drained its resources over the last five years, putting it in a pinch and limiting its ability to return capital to investors. Its free cash flow margin averaged negative 1%, meaning it lit $1.04 of cash on fire for every $100 in revenue.
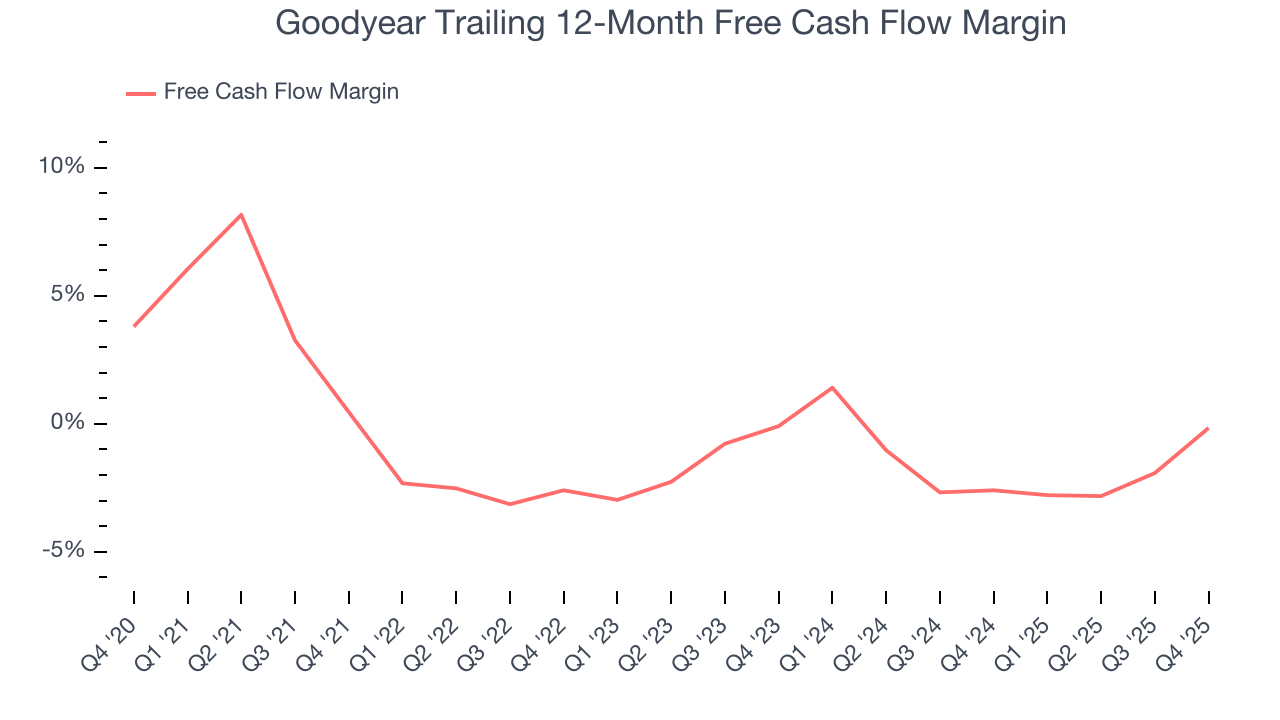
Goodyear’s free cash flow clocked in at $1.34 billion in Q4, equivalent to a 27.2% margin. This result was good as its margin was 6.7 percentage points higher than in the same quarter last year, but we wouldn’t put too much weight on the short term because investment needs can be seasonal, causing temporary swings. Long-term trends are more important.
10. Return on Invested Capital (ROIC)
EPS and free cash flow tell us whether a company was profitable while growing its revenue. But was it capital-efficient? Enter ROIC, a metric showing how much operating profit a company generates relative to the money it has raised (debt and equity).
Goodyear historically did a mediocre job investing in profitable growth initiatives. Its five-year average ROIC was 5%, lower than the typical cost of capital (how much it costs to raise money) for industrials companies.
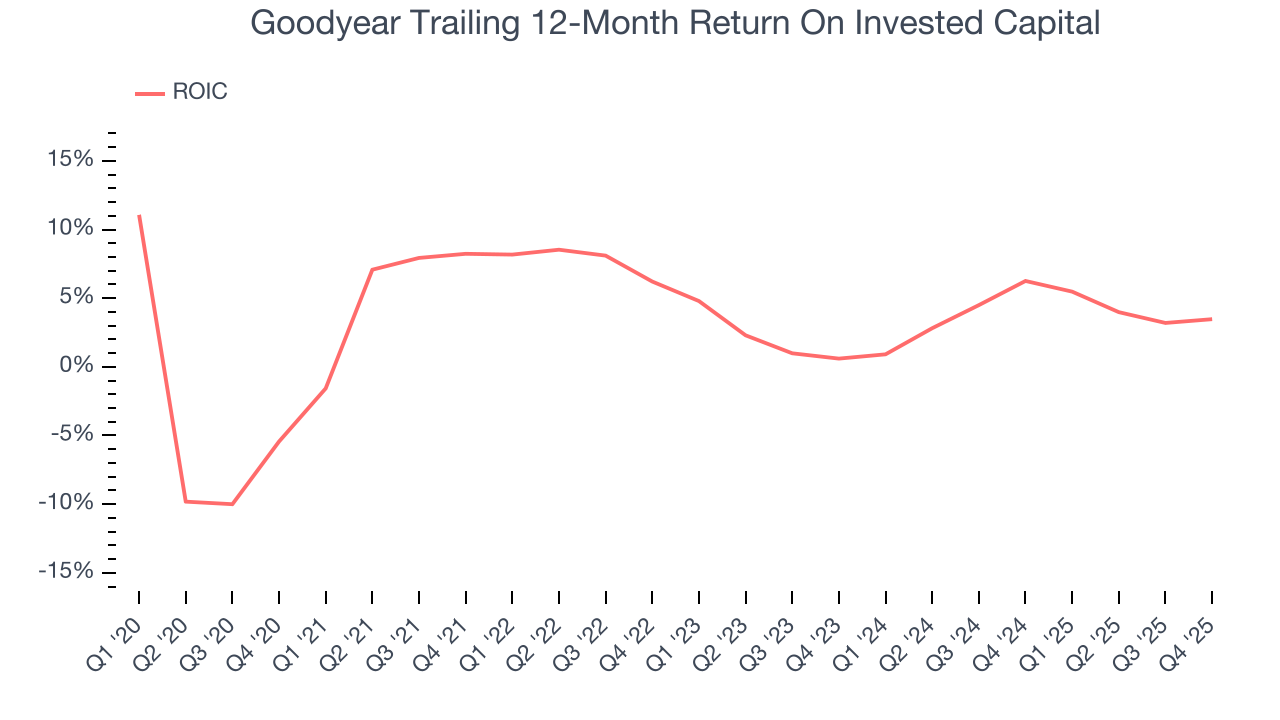
We like to invest in businesses with high returns, but the trend in a company’s ROIC is what often surprises the market and moves the stock price. Over the last few years, Goodyear’s ROIC averaged 2.4 percentage point decreases each year. Paired with its already low returns, these declines suggest its profitable growth opportunities are few and far between.
11. Balance Sheet Assessment
Goodyear reported $801 million of cash and $6.20 billion of debt on its balance sheet in the most recent quarter. As investors in high-quality companies, we primarily focus on two things: 1) that a company’s debt level isn’t too high and 2) that its interest payments are not excessively burdening the business.
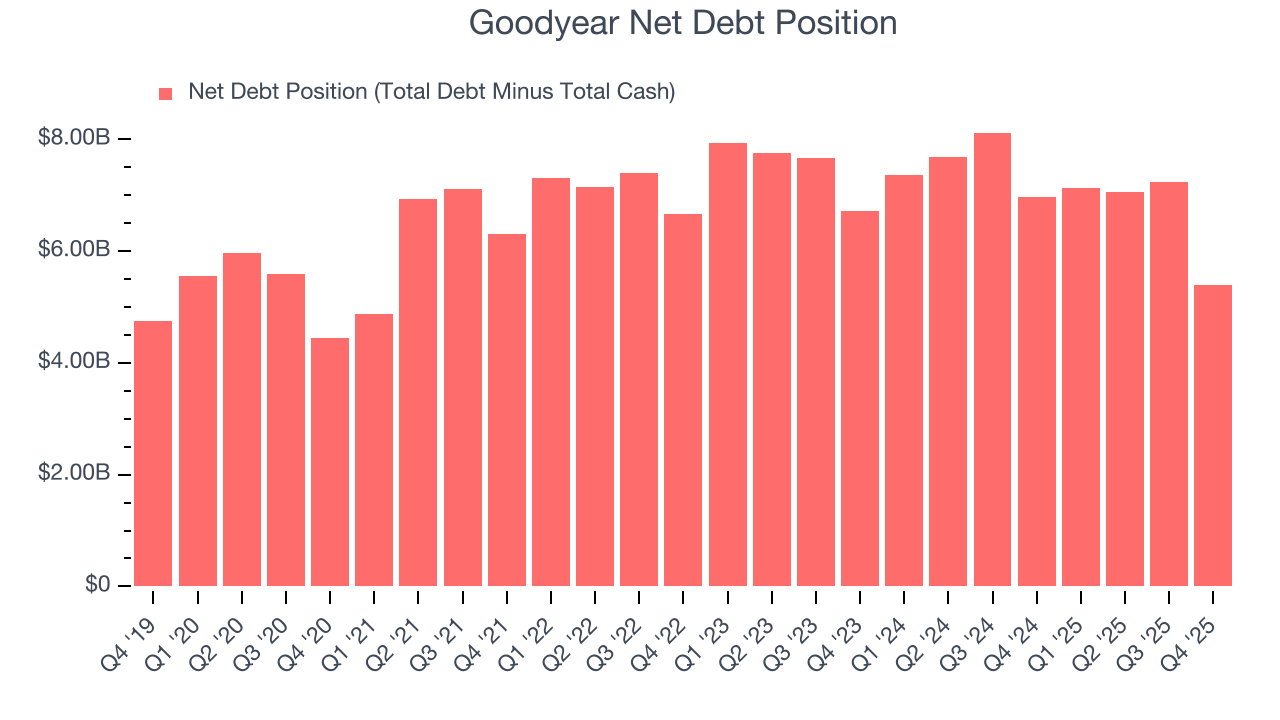
With $1.76 billion of EBITDA over the last 12 months, we view Goodyear’s 3.1× net-debt-to-EBITDA ratio as safe. We also see its $210 million of annual interest expenses as appropriate. The company’s profits give it plenty of breathing room, allowing it to continue investing in growth initiatives.
12. Key Takeaways from Goodyear’s Q4 Results
It was good to see Goodyear narrowly top analysts’ revenue expectations this quarter. On the other hand, its EPS missed. Overall, this was a weaker quarter. The stock traded down 2.1% to $10.29 immediately after reporting.
13. Is Now The Time To Buy Goodyear?
Updated: March 24, 2026 at 12:59 AM EDT
When considering an investment in Goodyear, investors should account for its valuation and business qualities as well as what’s happened in the latest quarter.
Goodyear isn’t a terrible business, but it doesn’t pass our quality test. Although its revenue growth was decent over the last five years, it’s expected to deteriorate over the next 12 months and its relatively low ROIC suggests management has struggled to find compelling investment opportunities. And while the company’s spectacular EPS growth over the last five years shows its profits are trickling down to shareholders, the downside is its cash burn raises the question of whether it can sustainably maintain growth.
Goodyear’s P/E ratio based on the next 12 months is 12.3x. While this valuation is fair, the upside isn’t great compared to the potential downside. We're pretty confident there are more exciting stocks to buy at the moment.
Wall Street analysts have a consensus one-year price target of $9.76 on the company (compared to the current share price of $6.41).
Although the price target is bullish, readers should exercise caution because analysts tend to be overly optimistic. The firms they work for, often big banks, have relationships with companies that extend into fundraising, M&A advisory, and other rewarding business lines. As a result, they typically hesitate to say bad things for fear they will lose out. We at StockStory do not suffer from such conflicts of interest, so we’ll always tell it like it is.