
American Airlines (AAL)
American Airlines faces an uphill battle. Its weak sales growth and low returns on capital show it struggled to generate demand and profits.― StockStory Analyst Team
1. News


2. Summary
Why We Think American Airlines Will Underperform
One of the ‘Big Four’ airlines in the US, American Airlines (NASDAQ:AAL) is a major global air carrier that serves both business and leisure travelers through its domestic and international flights.
- Scale is a double-edged sword because it limits the company’s growth potential compared to its smaller competitors, as reflected in its below-average annual revenue increases of 1.7% for the last two years
- Operating margin falls short of the industry average, and the smaller profit dollars make it harder to react to unexpected market developments
- High net-debt-to-EBITDA ratio of 9× could force the company to raise capital at unfavorable terms if market conditions deteriorate


American Airlines’s quality doesn’t meet our expectations. We’d rather invest in businesses with stronger moats.
Why There Are Better Opportunities Than American Airlines


At $10.25 per share, American Airlines trades at 5.7x forward P/E. This sure is a cheap multiple, but you get what you pay for.
It’s better to pay up for high-quality businesses with higher long-term earnings potential rather than to buy lower-quality stocks because they appear cheap. These challenged businesses often don’t re-rate, a phenomenon known as a “value trap”.
3. American Airlines (AAL) Research Report: Q4 CY2025 Update
Global airline American Airlines (NASDAQ:AAL) met Wall Streets revenue expectations in Q4 CY2025, with sales up 2.5% year on year to $14 billion. Its non-GAAP profit of $0.16 per share was 54.6% below analysts’ consensus estimates.
American Airlines (AAL) Q4 CY2025 Highlights:
- Revenue: $14 billion vs analyst estimates of $14.04 billion (2.5% year-on-year growth, in line)
- Adjusted EPS: $0.16 vs analyst expectations of $0.35 (54.6% miss)
- Adjusted EPS guidance for the upcoming financial year 2026 is $2.20 at the midpoint, beating analyst estimates by 12.1%
- Operating Margin: 3.2%, down from 8.3% in the same quarter last year
- Free Cash Flow was -$1.90 billion compared to -$342 million in the same quarter last year
- Revenue Passenger Miles: 61.6 billion, up 920 million year on year
- Market Capitalization: $9.62 billion
Company Overview
One of the ‘Big Four’ airlines in the US, American Airlines (NASDAQ:AAL) is a major global air carrier that serves both business and leisure travelers through its domestic and international flights.
The company was founded in 1930, started as a consolidation of several smaller airlines. Over the following decades, American Airlines grew through mergers and acquisitions, notably its 2001 acquisition of Trans World Airlines (TWA) and its 2013 merger with US Airways.
Today, American Airlines’ primary product offering is air travel, which generates the bulk of its revenue. The company offers a variety of fare classes, from basic economy to first-class. Ancillary services, such as checked baggage, in-flight food, and priority boarding, are also revenue streams although these depend on air travel ticket sales. Beyond passenger services, American Airlines provides cargo services, transporting goods across its global network.
4. Travel and Vacation Providers
Airlines, hotels, resorts, and cruise line companies often sell experiences rather than tangible products, and in the last decade-plus, consumers have slowly shifted from buying "things" (wasteful) to buying "experiences" (memorable). In addition, the internet has introduced new ways of approaching leisure and lodging such as booking homes and longer-term accommodations. Traditional airlines, hotel, resorts, and cruise line companies must innovate to stay relevant in a market rife with innovation.
Competitors in the air carrier space include Delta Air Lines (NYSE:DAL), JetBlue Airways (NASDAQ:JBLU), and Southwest Airlines (NYSE:LUV).
5. Revenue Growth
A company’s long-term sales performance can indicate its overall quality. Any business can have short-term success, but a top-tier one grows for years. Over the last five years, American Airlines grew its sales at a 25.8% annual rate. Although this growth is acceptable on an absolute basis, it fell slightly short of our standards for the consumer discretionary sector, which enjoys a number of secular tailwinds.
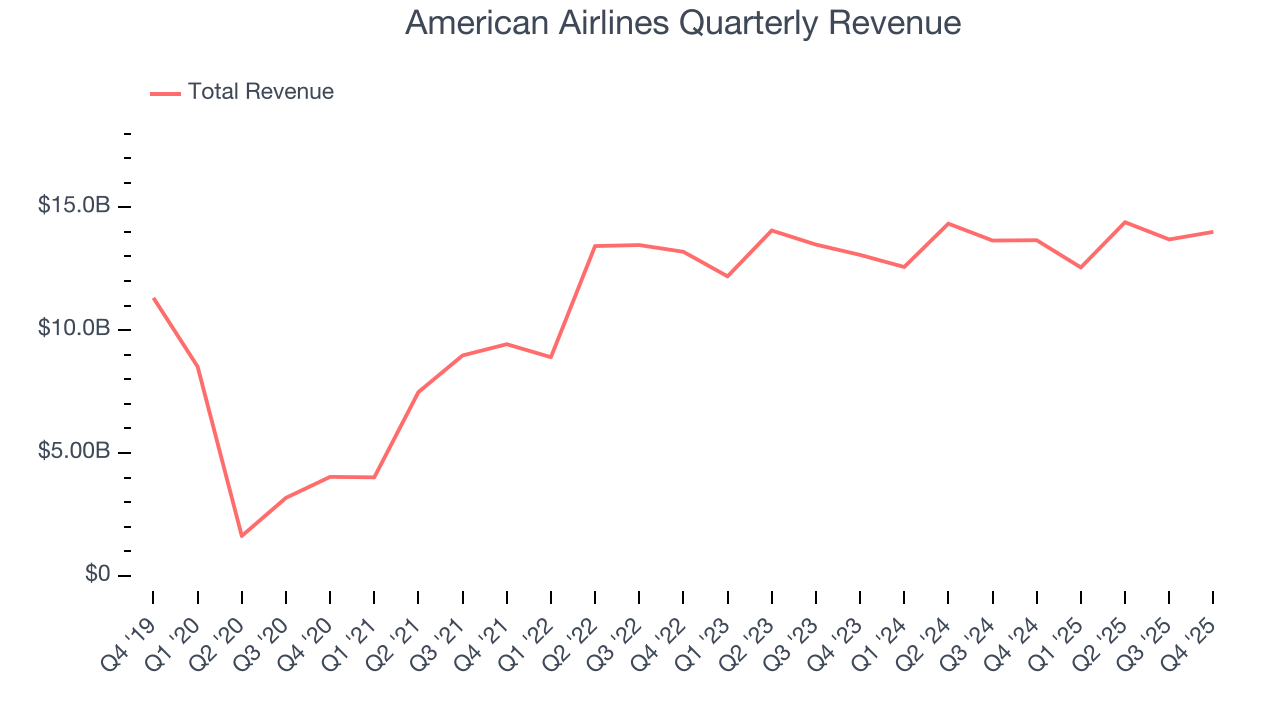
We at StockStory place the most emphasis on long-term growth, but within consumer discretionary, a stretched historical view may miss a company riding a successful new property or trend. American Airlines’s recent performance shows its demand has slowed as its annualized revenue growth of 1.7% over the last two years was below its five-year trend. 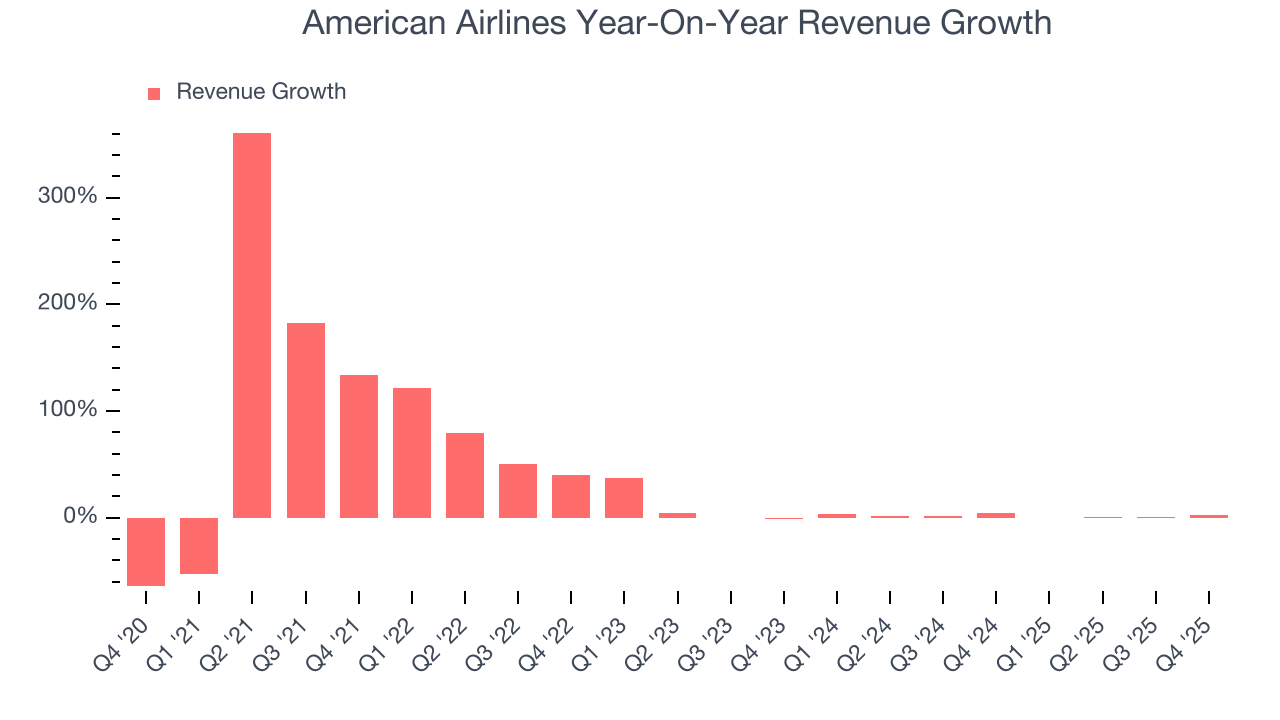
We can dig further into the company’s revenue dynamics by analyzing its number of revenue passenger miles, which reached 61.6 billion in the latest quarter. Over the last two years, American Airlines’s revenue passenger miles averaged 4% year-on-year growth. Because this number is higher than its revenue growth during the same period, we can see the company’s monetization has fallen. 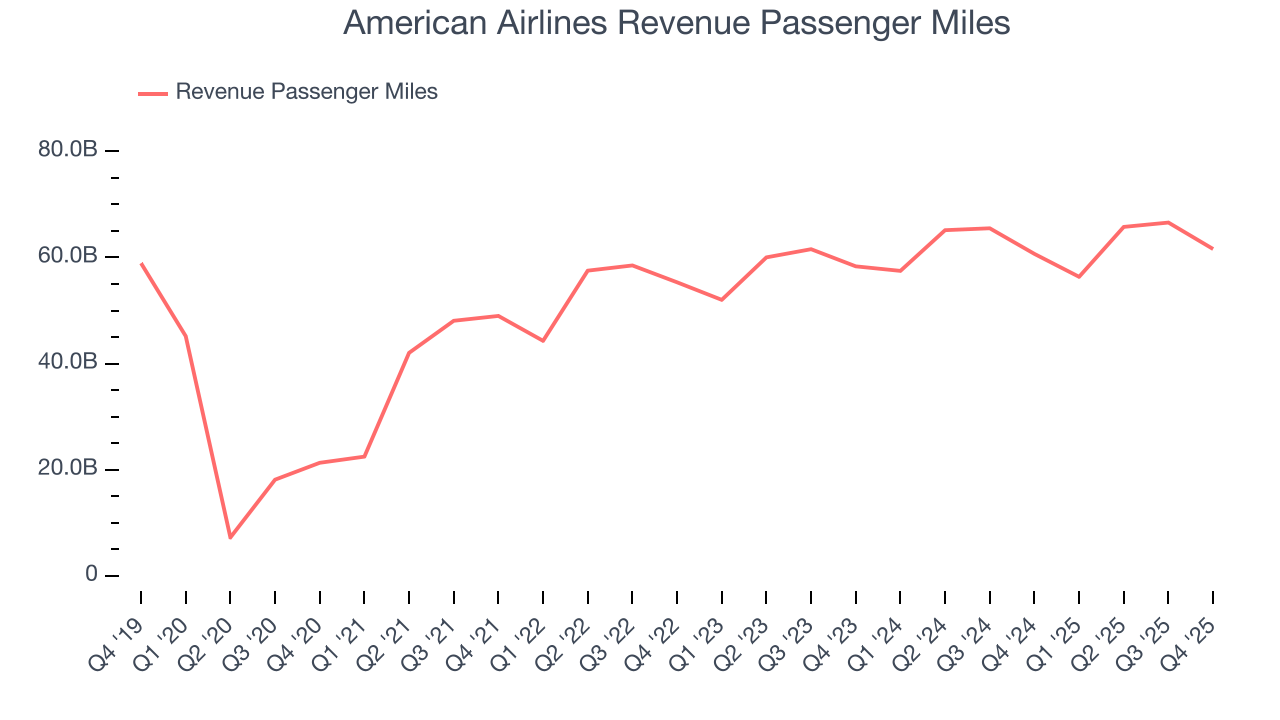
This quarter, American Airlines grew its revenue by 2.5% year on year, and its $14 billion of revenue was in line with Wall Street’s estimates.
Looking ahead, sell-side analysts expect revenue to grow 7.7% over the next 12 months. While this projection implies its newer products and services will spur better top-line performance, it is still below average for the sector.
6. Operating Margin
American Airlines’s operating margin has shrunk over the last 12 months and averaged 3.7% over the last two years. The company’s profitability was mediocre for a consumer discretionary business and shows it couldn’t pass its higher operating expenses onto its customers.
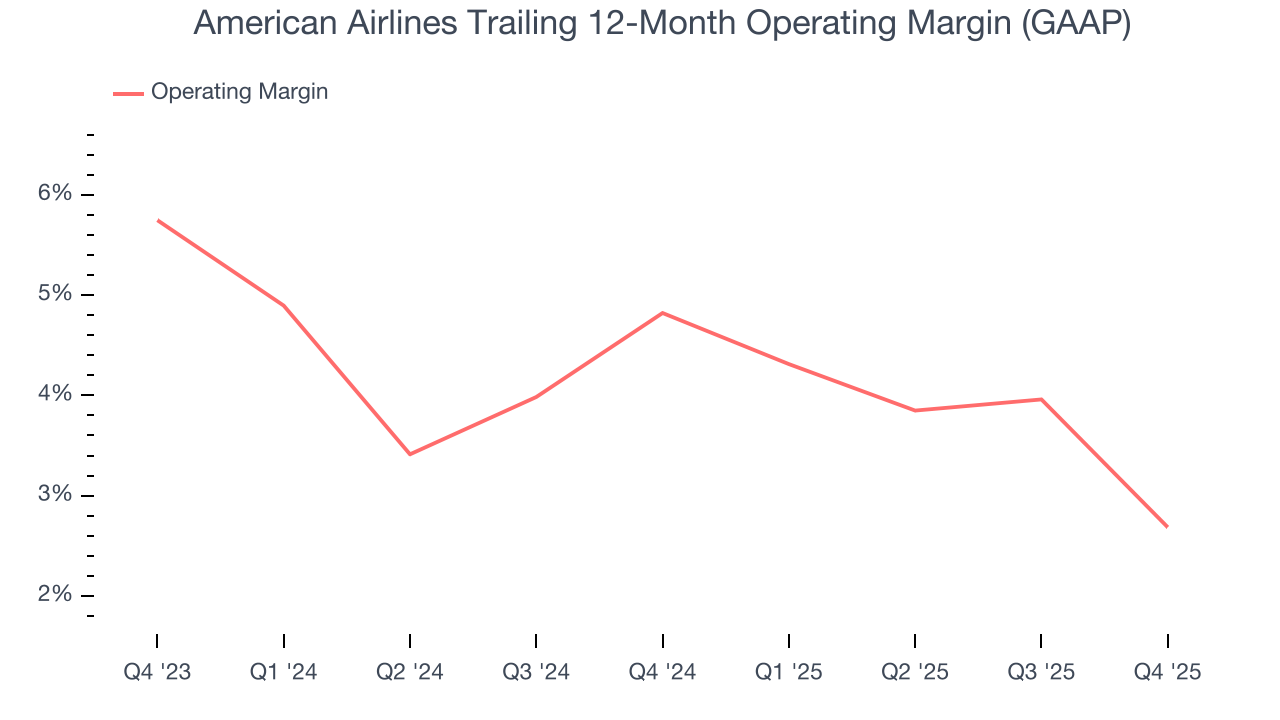
In Q4, American Airlines generated an operating margin profit margin of 3.2%, down 5.1 percentage points year on year. This contraction shows it was less efficient because its expenses grew faster than its revenue.
In the coming year, Wall Street expects American Airlines to become more profitable. Analysts are expecting the company’s trailing 12-month operating margin of 2.7% to rise to 5.2%.
7. Earnings Per Share
We track the long-term change in earnings per share (EPS) for the same reason as long-term revenue growth. Compared to revenue, however, EPS highlights whether a company’s growth is profitable.
American Airlines’s full-year EPS flipped from negative to positive over the last five years. This is encouraging and shows it’s at a critical moment in its life.
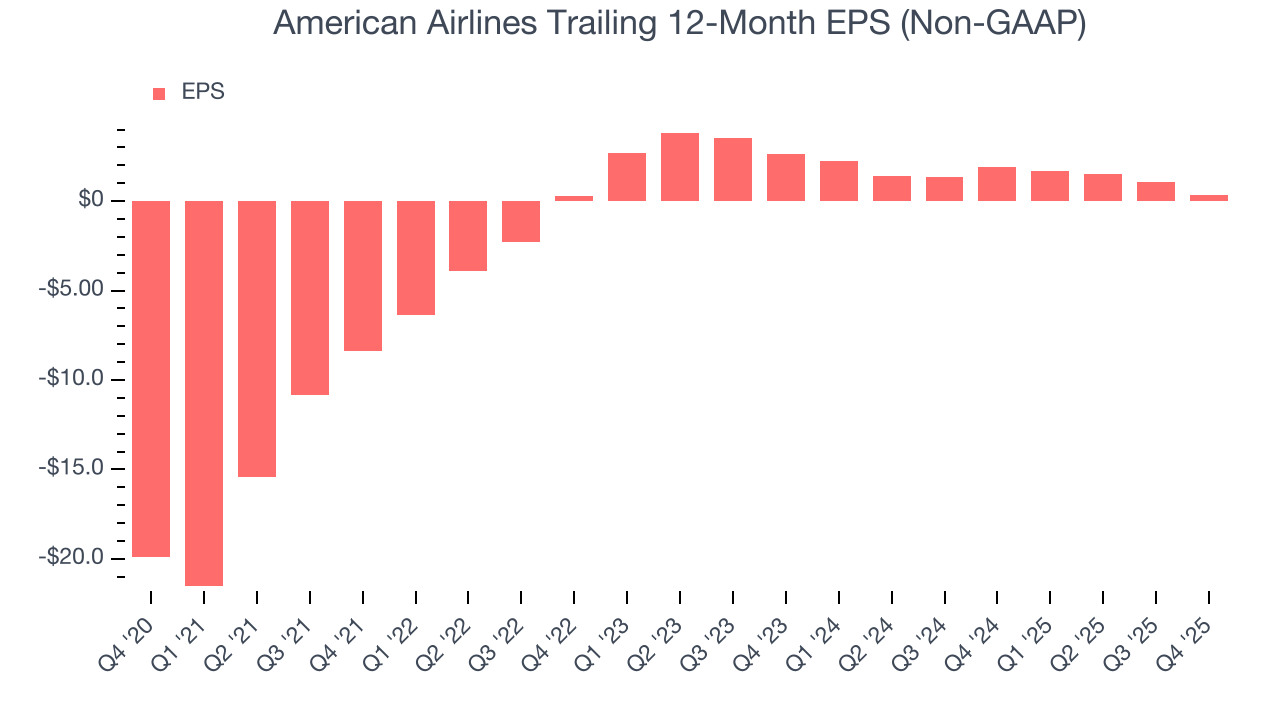
In Q4, American Airlines reported adjusted EPS of $0.16, down from $0.86 in the same quarter last year. This print missed analysts’ estimates. Over the next 12 months, Wall Street expects American Airlines’s full-year EPS of $0.35 to grow 481%.
8. Cash Is King
Free cash flow isn't a prominently featured metric in company financials and earnings releases, but we think it's telling because it accounts for all operating and capital expenses, making it tough to manipulate. Cash is king.
American Airlines broke even from a free cash flow perspective over the last two years, giving the company limited opportunities to return capital to shareholders.
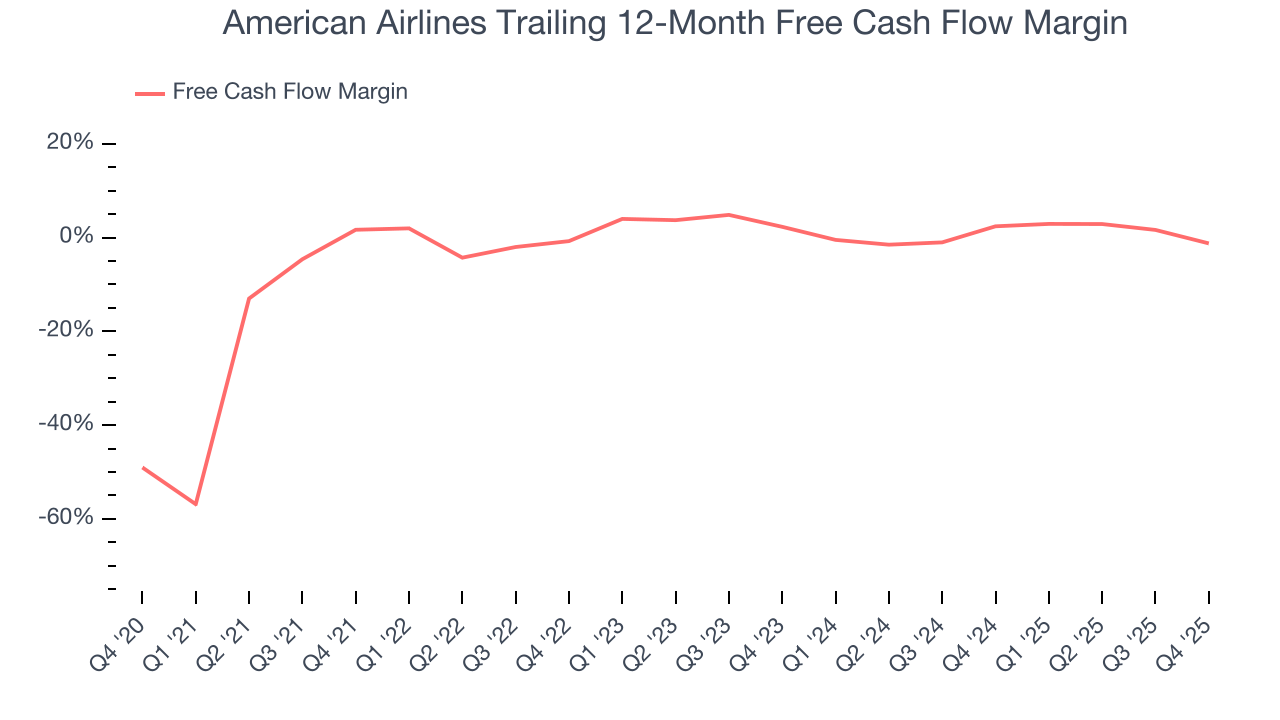
American Airlines burned through $1.90 billion of cash in Q4, equivalent to a negative 13.6% margin. The company’s cash burn increased from $342 million of lost cash in the same quarter last year.
Over the next year, analysts predict American Airlines will continue burning cash, albeit to a lesser extent. Their consensus estimates imply its free cash flow margin of negative 1.2% for the last 12 months will increase to negative 1.9%.
9. Return on Invested Capital (ROIC)
EPS and free cash flow tell us whether a company was profitable while growing its revenue. But was it capital-efficient? A company’s ROIC explains this by showing how much operating profit it makes compared to the money it has raised (debt and equity).
American Airlines historically did a mediocre job investing in profitable growth initiatives. Its five-year average ROIC was 8.7%, somewhat low compared to the best consumer discretionary companies that consistently pump out 25%+.
We like to invest in businesses with high returns, but the trend in a company’s ROIC is what often surprises the market and moves the stock price. On average, American Airlines’s ROIC increased by 1.7 percentage points annually over the last few years. This is a good sign, and we hope the company can continue improving.
10. Balance Sheet Risk
Debt is a tool that can boost company returns but presents risks if used irresponsibly. As long-term investors, we aim to avoid companies taking excessive advantage of this instrument because it could lead to insolvency.
American Airlines’s $35.97 billion of debt exceeds the $5.84 billion of cash on its balance sheet. Furthermore, its 9× net-debt-to-EBITDA ratio (based on its EBITDA of $3.52 billion over the last 12 months) shows the company is overleveraged.
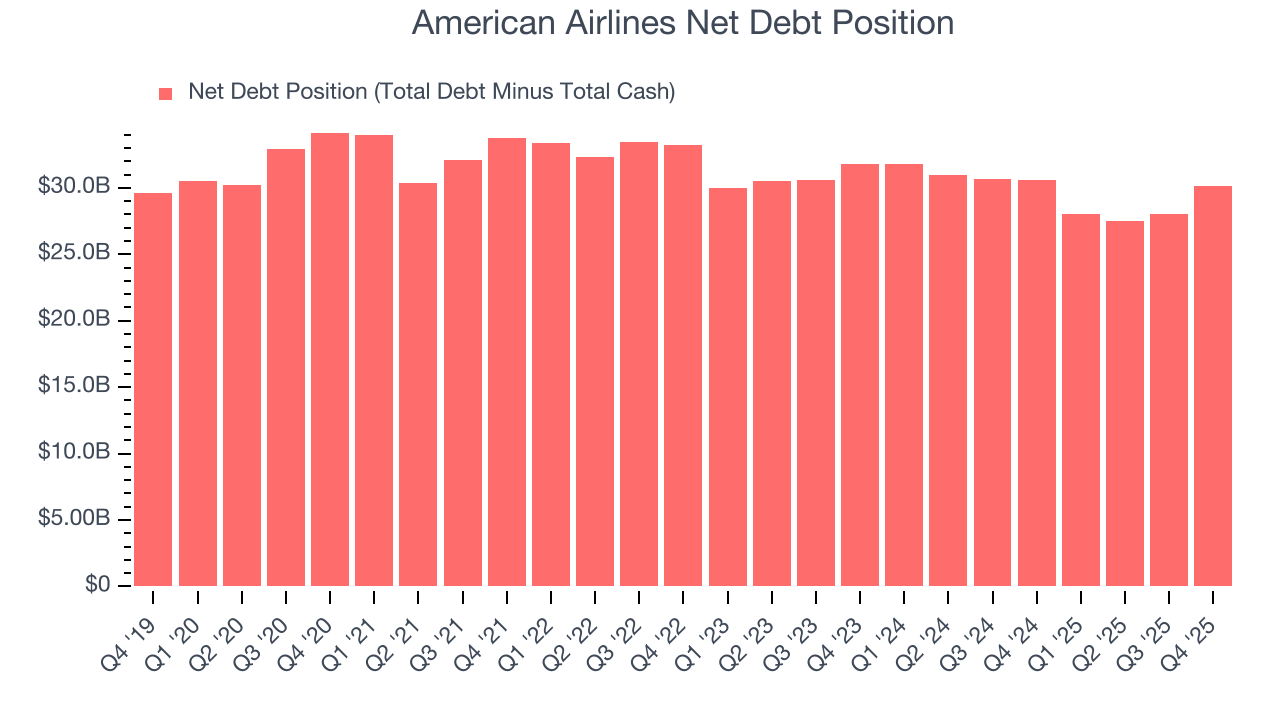
At this level of debt, incremental borrowing becomes increasingly expensive and credit agencies could downgrade the company’s rating if profitability falls. American Airlines could also be backed into a corner if the market turns unexpectedly – a situation we seek to avoid as investors in high-quality companies.
We hope American Airlines can improve its balance sheet and remain cautious until it increases its profitability or pays down its debt.
11. Key Takeaways from American Airlines’s Q4 Results
We were impressed by American Airlines’s optimistic full-year EPS guidance, which blew past analysts’ expectations. On the other hand, its EPS missed and its number of revenue passenger miles fell short of Wall Street’s estimates. Zooming out, we think this was a mixed quarter. The stock traded up 3.3% to $15.04 immediately following the results.
12. Is Now The Time To Buy American Airlines?
Updated: March 15, 2026 at 11:40 PM EDT
The latest quarterly earnings matters, sure, but we actually think longer-term fundamentals and valuation matter more. Investors should consider all these pieces before deciding whether or not to invest in American Airlines.
We see the value of companies helping consumers, but in the case of American Airlines, we’re out. While its projected EPS for the next year implies the company’s fundamentals will improve, the downside is its number of revenue passenger miles has disappointed. On top of that, its relatively low ROIC suggests management has struggled to find compelling investment opportunities.
American Airlines’s P/E ratio based on the next 12 months is 5.7x. While this valuation is optically cheap, the potential downside is huge given its shaky fundamentals. There are superior stocks to buy right now.
Wall Street analysts have a consensus one-year price target of $16.66 on the company (compared to the current share price of $10.25).
Although the price target is bullish, readers should exercise caution because analysts tend to be overly optimistic. The firms they work for, often big banks, have relationships with companies that extend into fundraising, M&A advisory, and other rewarding business lines. As a result, they typically hesitate to say bad things for fear they will lose out. We at StockStory do not suffer from such conflicts of interest, so we’ll always tell it like it is.