Fastenal (FAST)
We aren’t fans of Fastenal. Its decelerating revenue growth and even worse EPS performance give us little confidence it can beat the market.― StockStory Analyst Team
1. News


2. Summary
Why Fastenal Is Not Exciting
Founded in 1967, Fastenal (NASDAQ:FAST) provides industrial and construction supplies, including fasteners, tools, safety products, and many other product categories to businesses globally.
- A silver lining is that its offerings are difficult to replicate at scale and result in a best-in-class gross margin of 45.6%


Fastenal is in the penalty box. We believe there are better opportunities elsewhere.
Why There Are Better Opportunities Than Fastenal


At $44.97 per share, Fastenal trades at 36.9x forward P/E. This multiple is higher than most industrials companies, and we think it’s quite expensive for the quality you get.
There are stocks out there featuring similar valuation multiples with better fundamentals. We prefer to invest in those.
3. Fastenal (FAST) Research Report: Q4 CY2025 Update
Industrial supplier Fastenal (NASDAQ:FAST) met Wall Streets revenue expectations in Q4 CY2025, with sales up 11.1% year on year to $2.03 billion. Its GAAP profit of $0.26 per share was in line with analysts’ consensus estimates.
Fastenal (FAST) Q4 CY2025 Highlights:
- Revenue: $2.03 billion vs analyst estimates of $2.03 billion (11.1% year-on-year growth, in line)
- EPS (GAAP): $0.26 vs analyst estimates of $0.26 (in line)
- Adjusted EBITDA: $428.2 million vs analyst estimates of $441.2 million (21.1% margin, 2.9% miss)
- Operating Margin: 19%, in line with the same quarter last year
- Free Cash Flow Margin: 15.2%, up from 12.2% in the same quarter last year
- Sales Volumes rose 7.6% year on year (12.2% in the same quarter last year)
- Market Capitalization: $50.22 billion
Company Overview
Founded in 1967, Fastenal (NASDAQ:FAST) provides industrial and construction supplies, including fasteners, tools, safety products, and many other product categories to businesses globally.
When it was started, the company first sold mostly fasteners such as screws, threaded rods, and nuts used in construction. Fastenal's offerings initially include both purchased and manufactured products. As the company expanded its product offering into more diverse areas of industrial and construction components, materials, tools, and services, Fastenal ceased manufacturing product and became solely a distributor.
Today, Fastenal’s product portfolio spans fasteners, motors, paints and painting supplies, hand and power tools, and many other categories. For customers such as manufacturing plants and contractors, time is money; the last thing they want is to buy different product categories from multiple suppliers and wait for those products. Fastenal addresses this pain point by carrying broad and reliable inventory as well as the capabilities to get those goods to their destination quickly. This maintains smooth operations by supplying essential components and tools, ensuring minimal downtime and optimal performance.
The primary revenue sources for Fastenal come from the sale of its products. To a smaller extent, the company also provides services such as inventory management that are more steady and predictable in nature. Fastenal goes to market through direct sales, an extensive branch network, and e-commerce capabilities.
4. Maintenance and Repair Distributors
Supply chain and inventory management are themes that grew in focus after COVID wreaked havoc on the global movement of raw materials and components. Maintenance and repair distributors that boast reliable selection and quickly deliver products to customers can benefit from this theme. While e-commerce hasn’t disrupted industrial distribution as much as consumer retail, it is still a real threat, forcing investment in omnichannel capabilities to serve customers everywhere. Additionally, maintenance and repair distributors are at the whim of economic cycles that impact the capital spending and construction projects that can juice demand.
Competitors in the operating (MRO) supplies industry include W.W. Grainger (NYSE:GWW), MSC Industrial Direct (NYSE:MSM), and HD Supply (NASDAQ:HDS).
5. Revenue Growth
A company’s long-term sales performance is one signal of its overall quality. Any business can experience short-term success, but top-performing ones enjoy sustained growth for years. Over the last five years, Fastenal grew its sales at a decent 7.7% compounded annual growth rate. Its growth was slightly above the average industrials company and shows its offerings resonate with customers.
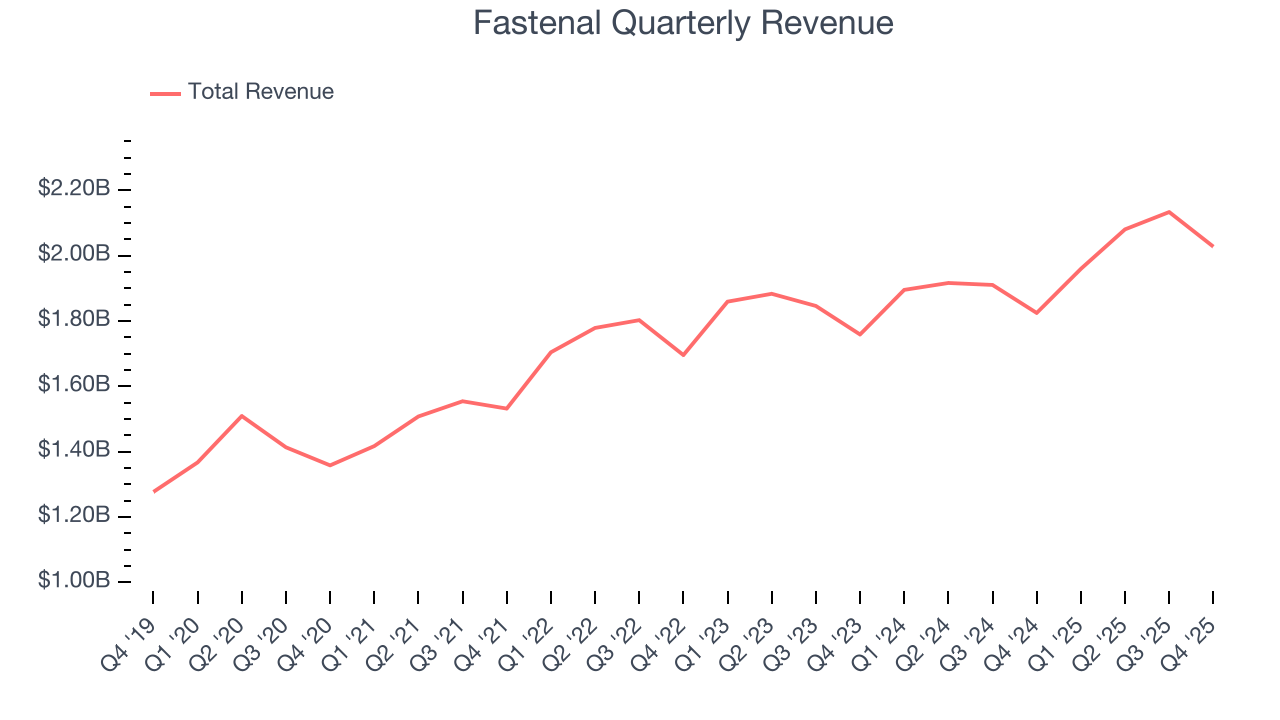
We at StockStory place the most emphasis on long-term growth, but within industrials, a half-decade historical view may miss cycles, industry trends, or a company capitalizing on catalysts such as a new contract win or a successful product line. Fastenal’s recent performance shows its demand has slowed as its annualized revenue growth of 5.7% over the last two years was below its five-year trend. 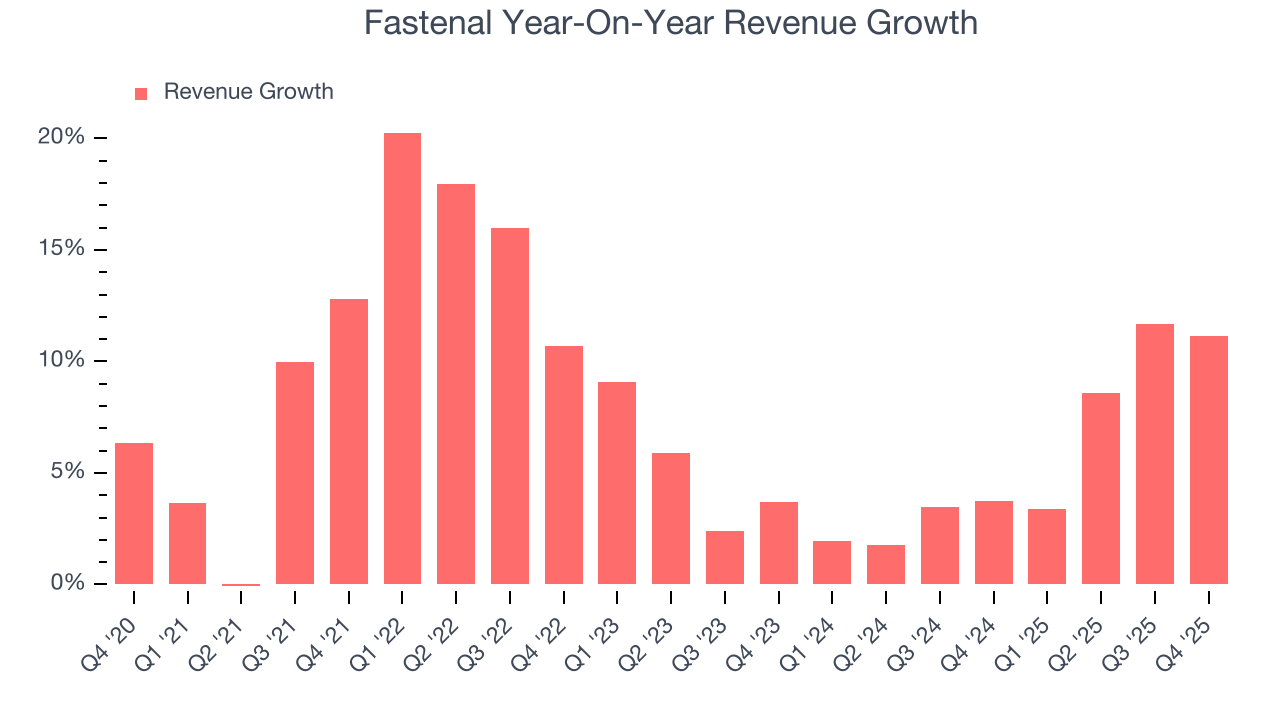
We can dig further into the company’s revenue dynamics by analyzing its number of units sold, which reached 136,638 in the latest quarter. Over the last two years, Fastenal’s units sold averaged 10.7% year-on-year growth. Because this number is better than its revenue growth, we can see the company’s average selling price decreased. 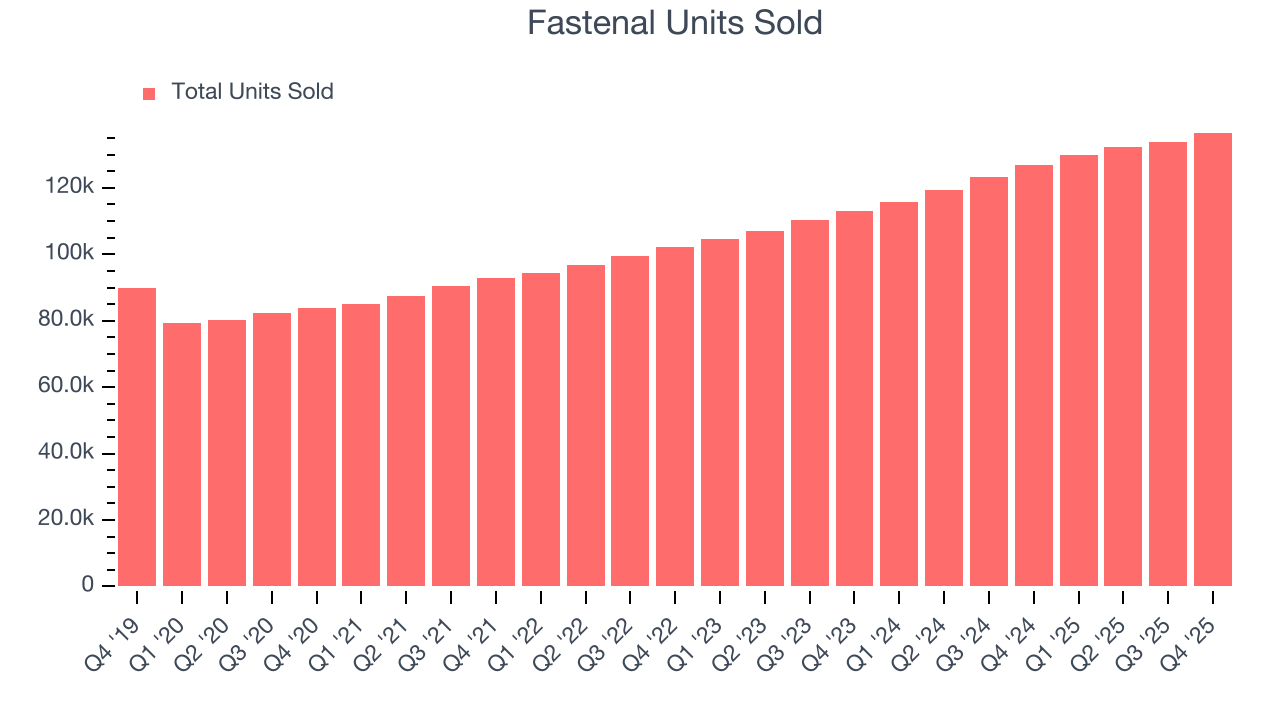
This quarter, Fastenal’s year-on-year revenue growth was 11.1%, and its $2.03 billion of revenue was in line with Wall Street’s estimates.
Looking ahead, sell-side analysts expect revenue to grow 9.2% over the next 12 months, an improvement versus the last two years. This projection is noteworthy and implies its newer products and services will catalyze better top-line performance.
6. Gross Margin & Pricing Power
Fastenal has best-in-class unit economics for an industrials company, enabling it to invest in areas such as research and development. Its margin also signals it sells differentiated products, not commodities. As you can see below, it averaged an elite 45.6% gross margin over the last five years. That means Fastenal only paid its suppliers $54.44 for every $100 in revenue. 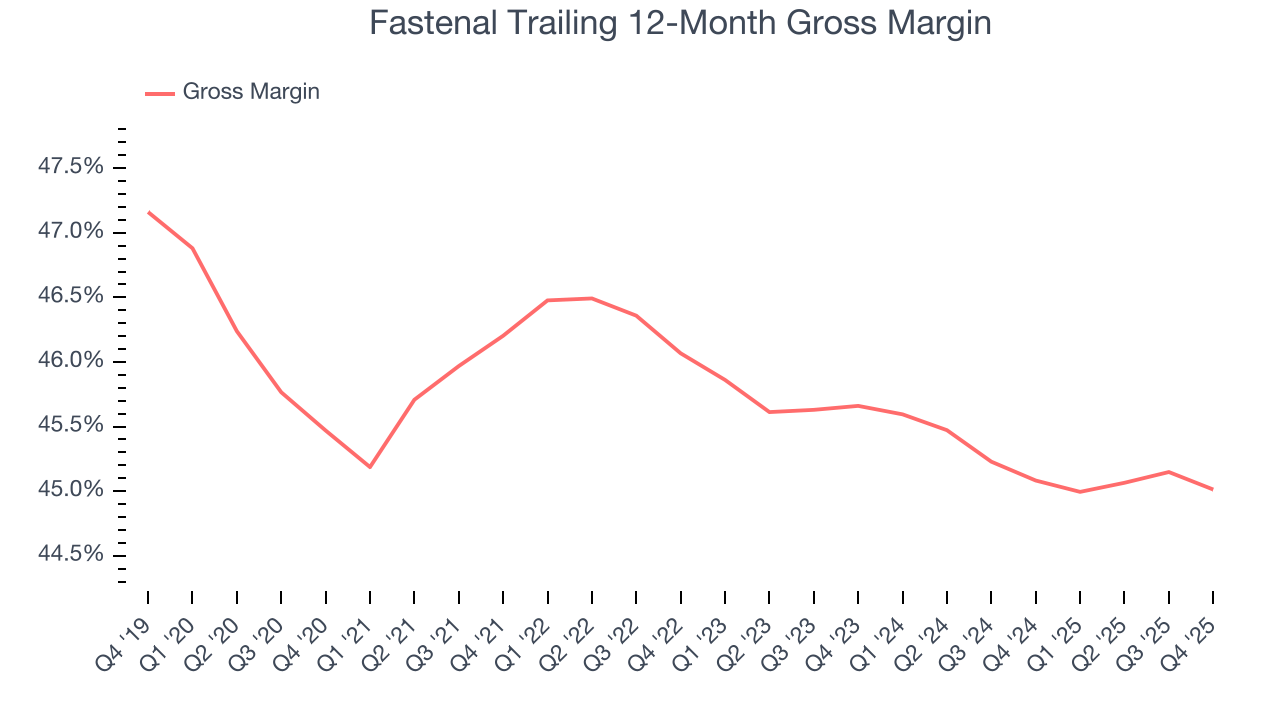
In Q4, Fastenal produced a 44.3% gross profit margin, in line with the same quarter last year. Zooming out, the company’s full-year margin has remained steady over the past 12 months, suggesting its input costs (such as raw materials and manufacturing expenses) have been stable and it isn’t under pressure to lower prices.
7. Operating Margin
Fastenal’s operating margin might fluctuated slightly over the last 12 months but has generally stayed the same, averaging 20.4% over the last five years. This profitability was elite for an industrials business thanks to its efficient cost structure and economies of scale. This result isn’t surprising as its high gross margin gives it a favorable starting point.
Looking at the trend in its profitability, Fastenal’s operating margin might fluctuated slightly but has generally stayed the same over the last five years. This raises questions about the company’s expense base because its revenue growth should have given it leverage on its fixed costs, resulting in better economies of scale and profitability.
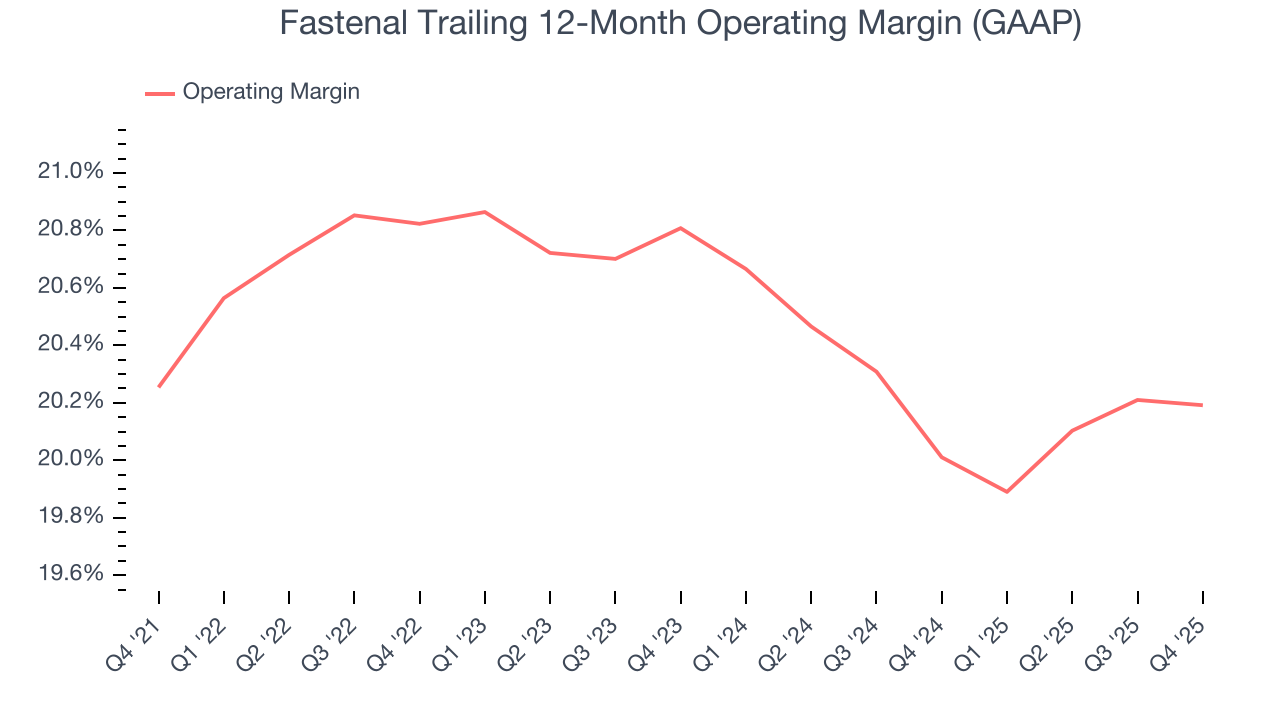
This quarter, Fastenal generated an operating margin profit margin of 19%, in line with the same quarter last year. This indicates the company’s cost structure has recently been stable.
8. Earnings Per Share
We track the long-term change in earnings per share (EPS) for the same reason as long-term revenue growth. Compared to revenue, however, EPS highlights whether a company’s growth is profitable.
Fastenal’s decent 8% annual EPS growth over the last five years aligns with its revenue performance. This tells us it maintained its per-share profitability as it expanded.
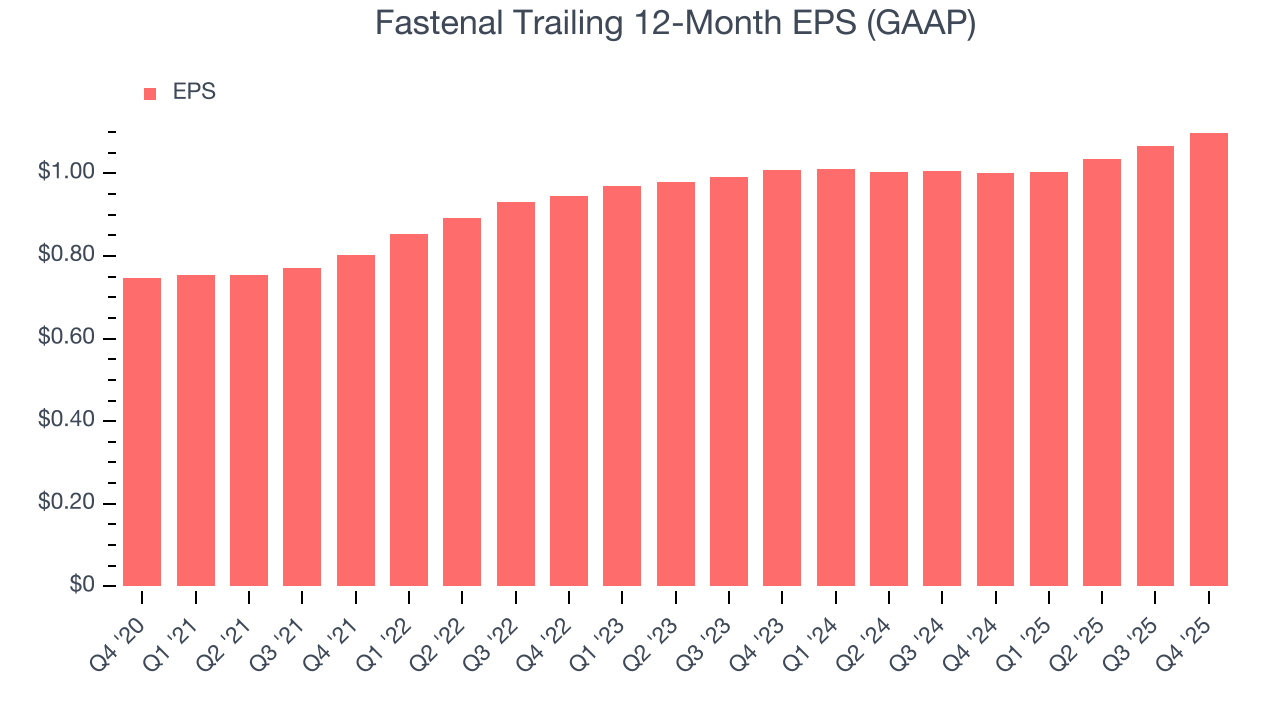
Like with revenue, we analyze EPS over a shorter period to see if we are missing a change in the business.
For Fastenal, its two-year annual EPS growth of 4.4% was lower than its five-year trend. We hope its growth can accelerate in the future.
In Q4, Fastenal reported EPS of $0.26, up from $0.23 in the same quarter last year. This print was close to analysts’ estimates. Over the next 12 months, Wall Street expects Fastenal’s full-year EPS of $1.10 to grow 10.6%.
9. Cash Is King
Free cash flow isn't a prominently featured metric in company financials and earnings releases, but we think it's telling because it accounts for all operating and capital expenses, making it tough to manipulate. Cash is king.
Fastenal has shown robust cash profitability, enabling it to comfortably ride out cyclical downturns while investing in plenty of new offerings and returning capital to investors. The company’s free cash flow margin averaged 12.9% over the last five years, quite impressive for an industrials business.
Taking a step back, we can see that Fastenal’s margin expanded by 2.6 percentage points during that time. This shows the company is heading in the right direction, and we can see it became a less capital-intensive business because its free cash flow profitability rose while its operating profitability was flat.
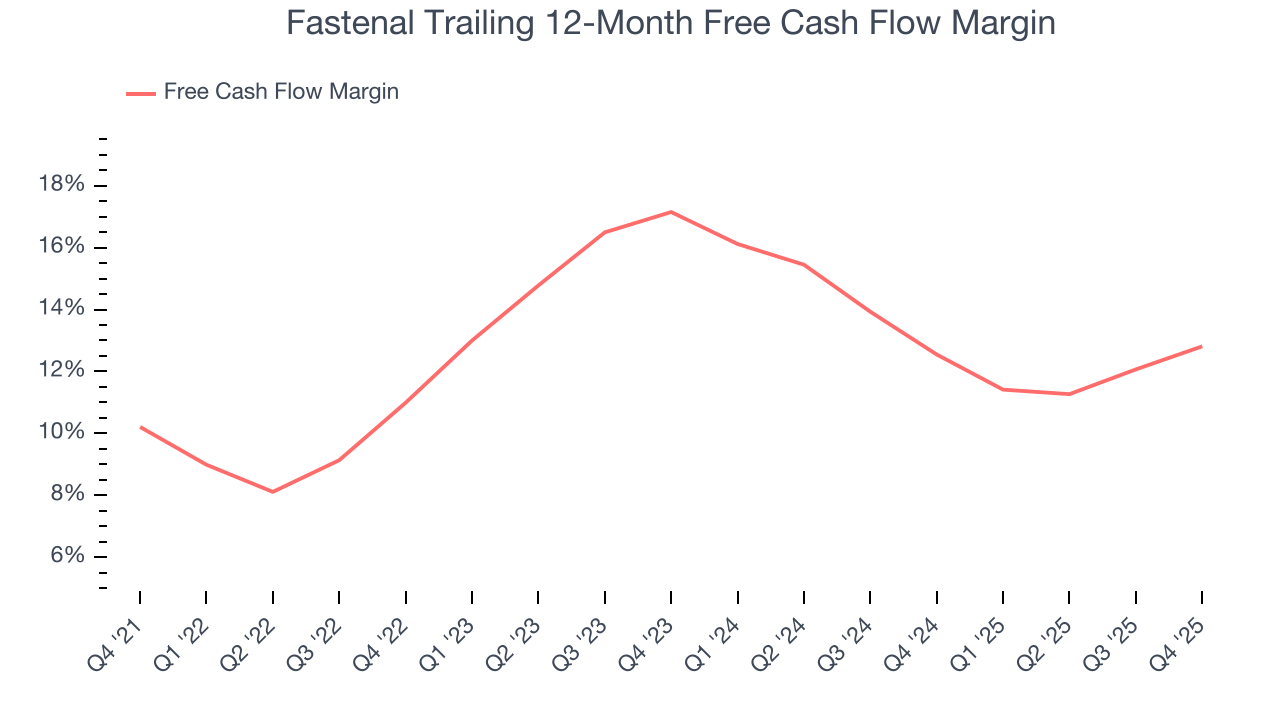
Fastenal’s free cash flow clocked in at $308.1 million in Q4, equivalent to a 15.2% margin. This result was good as its margin was 3 percentage points higher than in the same quarter last year, building on its favorable historical trend.
10. Return on Invested Capital (ROIC)
EPS and free cash flow tell us whether a company was profitable while growing its revenue. But was it capital-efficient? A company’s ROIC explains this by showing how much operating profit it makes compared to the money it has raised (debt and equity).
Although Fastenal hasn’t been the highest-quality company lately, it found a few growth initiatives in the past that worked out wonderfully. Its five-year average ROIC was 31.7%, splendid for an industrials business.
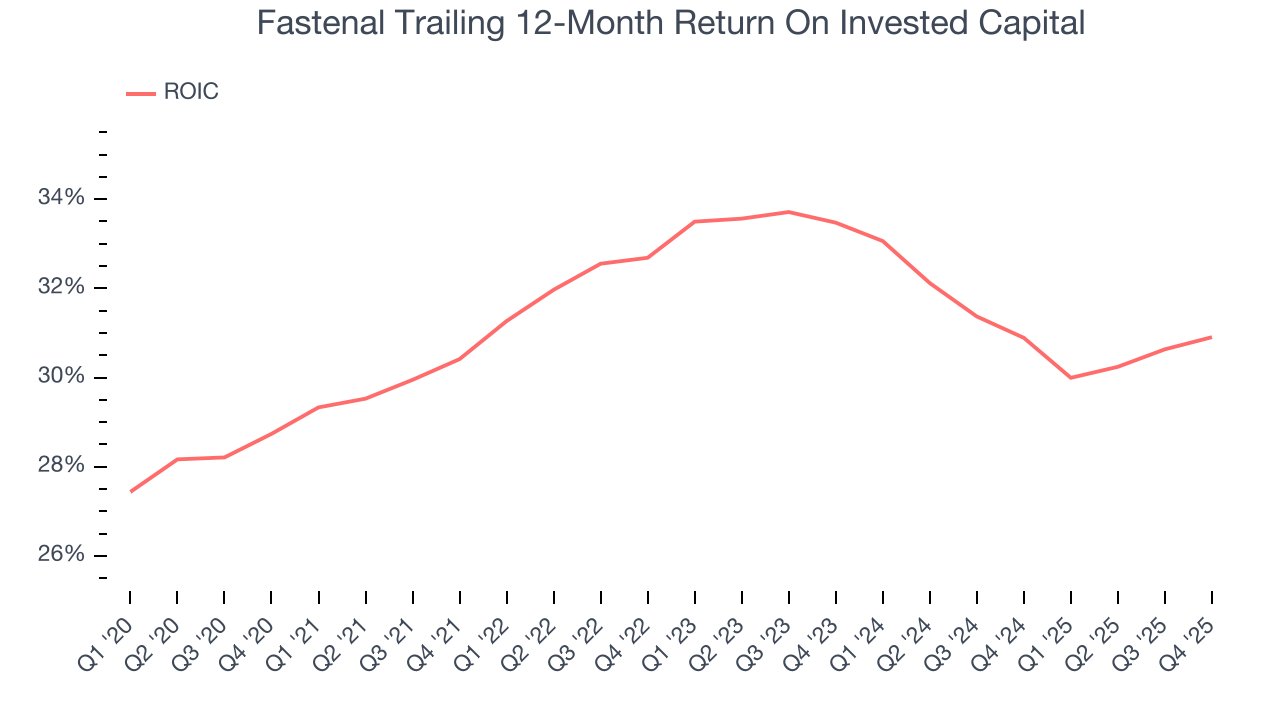
We like to invest in businesses with high returns, but the trend in a company’s ROIC is what often surprises the market and moves the stock price. Uneventfully, Fastenal’s ROIC has stayed the same over the last few years. Given the company’s underwhelming financial performance in other areas, we’d like to see its returns improve before recommending the stock.
11. Balance Sheet Assessment
Fastenal reported $276.8 million of cash and $441.9 million of debt on its balance sheet in the most recent quarter. As investors in high-quality companies, we primarily focus on two things: 1) that a company’s debt level isn’t too high and 2) that its interest payments are not excessively burdening the business.
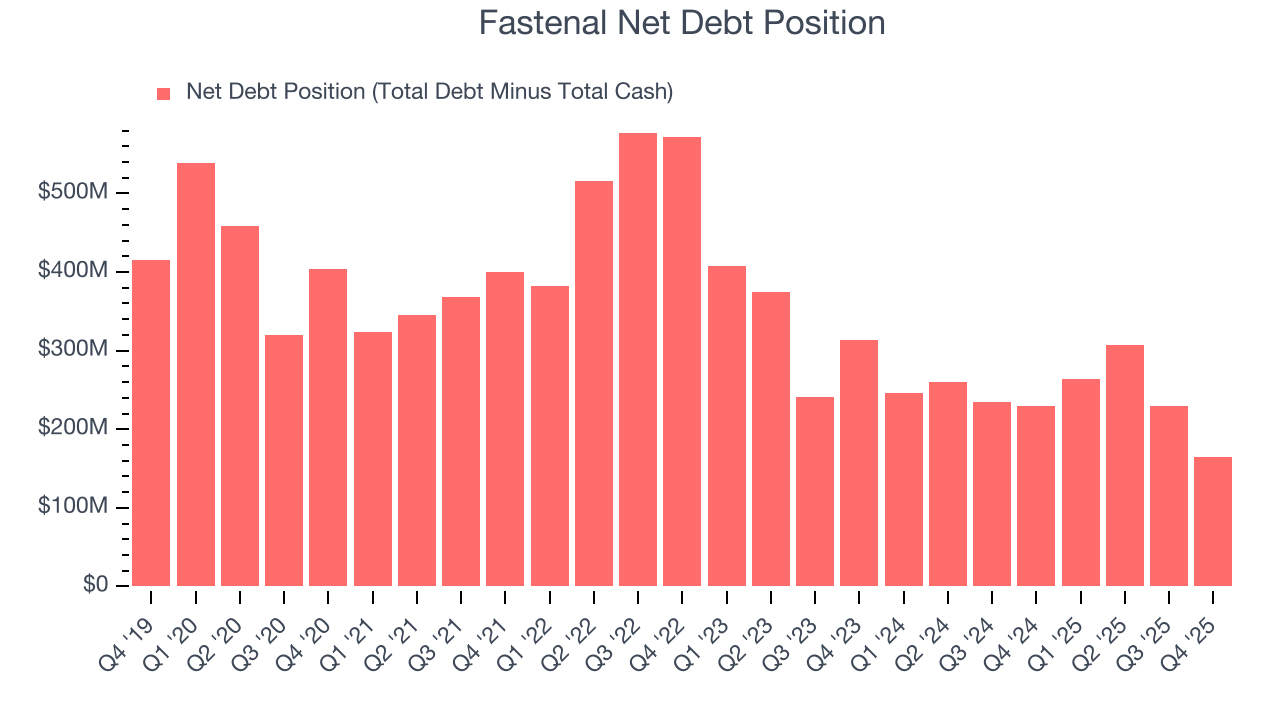
With $1.83 billion of EBITDA over the last 12 months, we view Fastenal’s 0.1× net-debt-to-EBITDA ratio as safe. We also see its $1.5 million of annual interest expenses as appropriate. The company’s profits give it plenty of breathing room, allowing it to continue investing in growth initiatives.
12. Key Takeaways from Fastenal’s Q4 Results
We struggled to find many positives in these results. Its EBITDA missed and its revenue was in line with Wall Street’s estimates. Overall, this quarter could have been better. The stock traded down 4.6% to $41.75 immediately after reporting.
13. Is Now The Time To Buy Fastenal?
Updated: March 14, 2026 at 11:14 PM EDT
When considering an investment in Fastenal, investors should account for its valuation and business qualities as well as what’s happened in the latest quarter.
Fastenal isn’t a bad business, but we’re not clamoring to buy it here and now. First off, its revenue growth was decent over the last five years and is expected to accelerate over the next 12 months. On top of that, Fastenal’s admirable gross margins indicate the mission-critical nature of its offerings, and its impressive operating margins show it has a highly efficient business model.
Fastenal’s P/E ratio based on the next 12 months is 36.9x. This valuation tells us it’s a bit of a market darling with a lot of good news priced in - we think other companies feature superior fundamentals at the moment.
Wall Street analysts have a consensus one-year price target of $45.15 on the company (compared to the current share price of $44.97).