
LKQ (LKQ)
LKQ is in for a bumpy ride. Its sales have underperformed and its low returns on capital show it has few growth opportunities.― StockStory Analyst Team
1. News


2. Summary
Why We Think LKQ Will Underperform
A global distributor of vehicle parts and accessories, LKQ (NASDAQ:LKQ) offers its customers a comprehensive selection of high-quality, affordably priced automobile products.
- Annual sales growth of 3.7% over the last five years lagged behind its consumer discretionary peers as its large revenue base made it difficult to generate incremental demand
- Earnings growth underperformed the sector average over the last five years as its EPS grew by just 4% annually
- Estimated sales for the next 12 months are flat and imply a softer demand environment


LKQ is skating on thin ice. We see more lucrative opportunities elsewhere.
Why There Are Better Opportunities Than LKQ


LKQ’s stock price of $28.81 implies a valuation ratio of 9.4x forward P/E. LKQ’s valuation may seem like a bargain, but we think there are valid reasons why it’s so cheap.
It’s better to pay up for high-quality businesses with higher long-term earnings potential rather than to buy lower-quality stocks because they appear cheap. These challenged businesses often don’t re-rate, a phenomenon known as a “value trap”.
3. LKQ (LKQ) Research Report: Q4 CY2025 Update
Automotive parts company LKQ (NASDAQ:LKQ) reported revenue ahead of Wall Street’s expectations in Q4 CY2025, but sales were flat year on year at $3.31 billion. Its non-GAAP profit of $0.59 per share was 9.3% below analysts’ consensus estimates.
LKQ (LKQ) Q4 CY2025 Highlights:
- Revenue: $3.31 billion vs analyst estimates of $3.20 billion (flat year on year, 3.5% beat)
- Adjusted EPS: $0.59 vs analyst expectations of $0.65 (9.3% miss)
- Adjusted EBITDA: $321 million vs analyst estimates of $340.2 million (9.7% margin, 5.7% miss)
- Adjusted EPS guidance for the upcoming financial year 2026 is $3.05 at the midpoint, missing analyst estimates by 7.1%
- Operating Margin: 4.6%, down from 8.2% in the same quarter last year
- Organic Revenue fell 1.2% year on year (beat)
- Market Capitalization: $8.50 billion
Company Overview
A global distributor of vehicle parts and accessories, LKQ (NASDAQ:LKQ) offers its customers a comprehensive selection of high-quality, affordably priced automobile products.
LKQ's core business sells a wide array of vehicle replacement products, including recycled automotive parts harvested from salvaged vehicles, remanufactured parts that are restored to original specifications, and new parts sourced from OEMs (Original Equipment Manufacturers) and other suppliers.
This diverse product portfolio enables LKQ to serve a broad customer base, ranging from collision and mechanical repair shops to individual vehicle owners. Its various price points (new and used) also allow it to cater to customers looking for high-quality replacement parts as well as those looking for more affordable options.
With numerous warehouses and distribution centers strategically located across its operating regions, LKQ ensures timely and efficient delivery of parts to its customers. The company leverages modern logistics and inventory management systems to maintain high levels of customer service and satisfaction.
4. Consumer Discretionary - Specialized Consumer Services
The Consumer Discretionary sector, by definition, is made up of companies selling non-essential goods and services. When economic conditions deteriorate or tastes shift, consumers can easily cut back or eliminate these purchases. For long-term investors with five-year holding periods, this creates a structural challenge: the sector is inherently hit-driven, with low switching costs and fickle customers. As a result, only a handful of companies can reliably grow demand and compound earnings over long periods, which is why our bar is high and High Quality ratings are rare.
Some consumer discretionary companies don’t fall neatly into a category because their products or services are unique. Although their offerings may be niche, these companies have often found more efficient or technology-enabled ways of doing or selling something that has existed for a while. Technology can be a double-edged sword, though, as it may lower the barriers to entry for new competitors and allow them to do serve customers better.
LKQ's primary competitors include Advance Auto Parts (NYSE:AAP), AutoZone (NYSE:AZO), O'Reilly Automotive (NASDAQ:ORLY), and Genuine Parts Company (NYSE:GPC).
5. Revenue Growth
Examining a company’s long-term performance can provide clues about its quality. Any business can experience short-term success, but top-performing ones enjoy sustained growth for years. Over the last five years, LKQ grew its sales at a weak 3.7% compounded annual growth rate. This fell short of our benchmark for the consumer discretionary sector and is a poor baseline for our analysis.
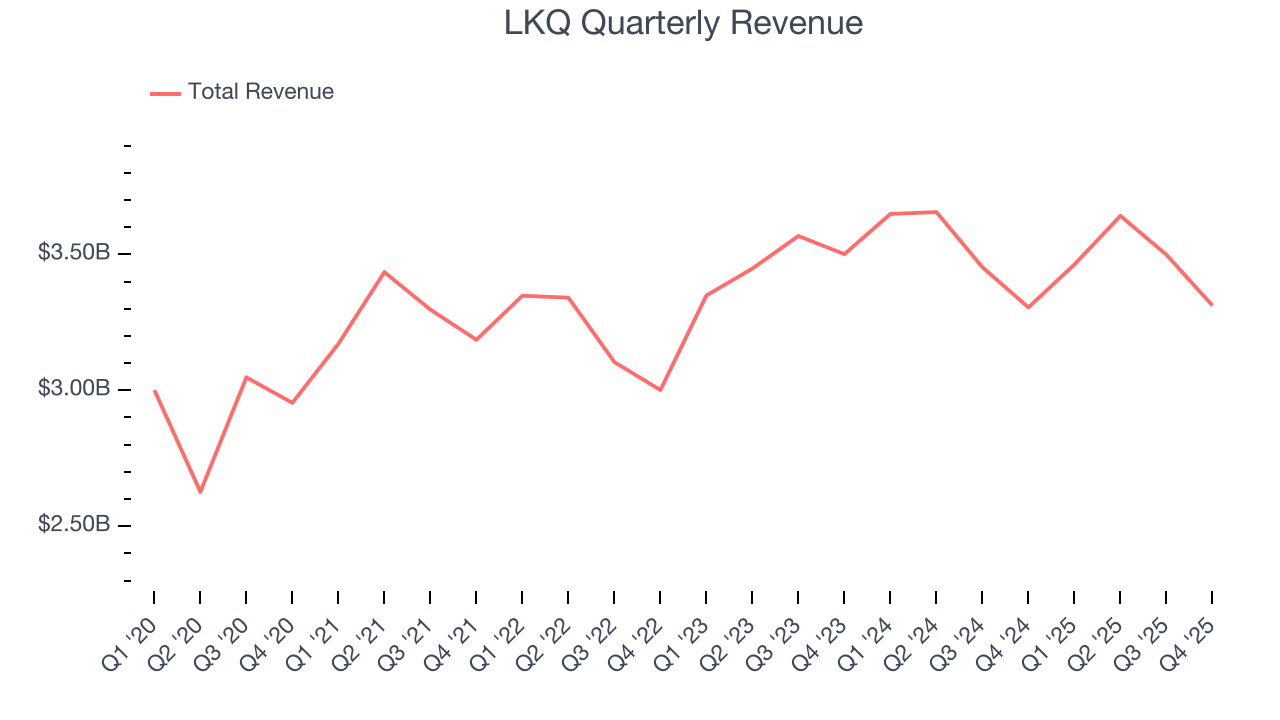
We at StockStory place the most emphasis on long-term growth, but within consumer discretionary, a stretched historical view may miss a company riding a successful new product or trend. LKQ’s recent performance shows its demand has slowed as its revenue was flat over the last two years. 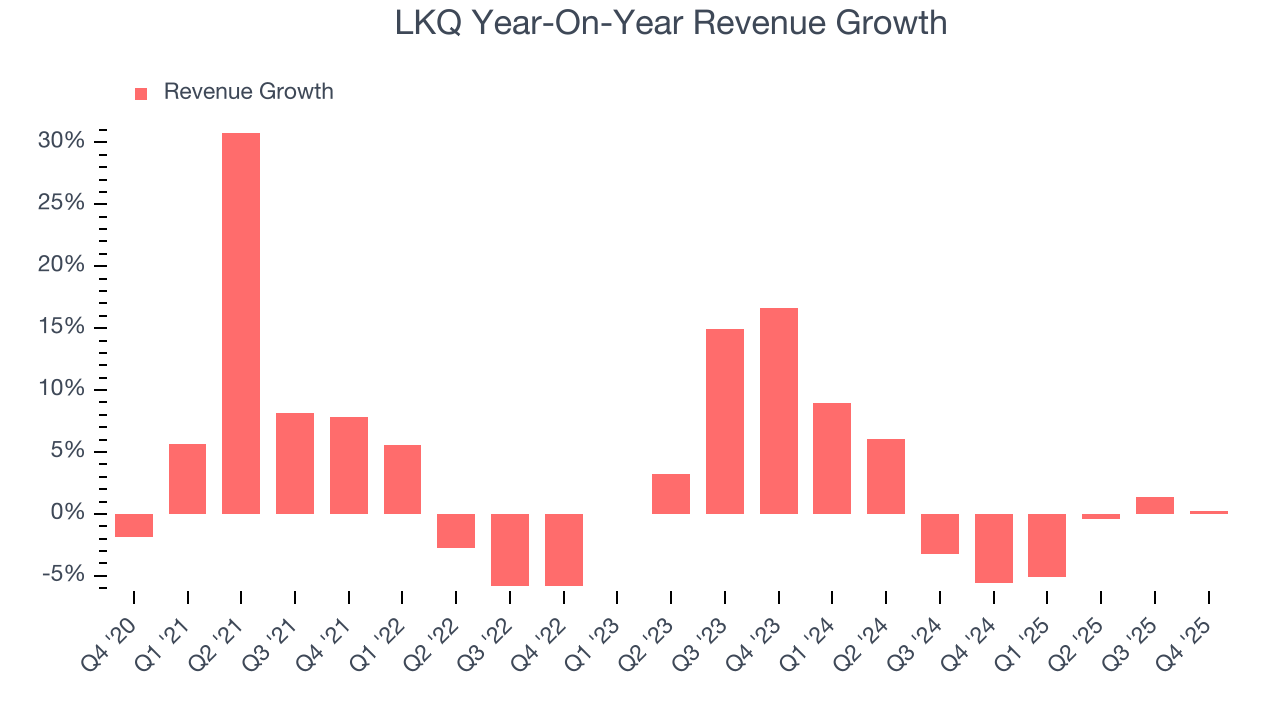
We can better understand the company’s sales dynamics by analyzing its organic revenue, which strips out one-time events like acquisitions and currency fluctuations that don’t accurately reflect its fundamentals. Over the last two years, LKQ’s organic revenue averaged 2.3% year-on-year declines. Because this number is lower than its two-year revenue growth, we can see that some mixture of acquisitions and foreign exchange rates boosted its headline results. 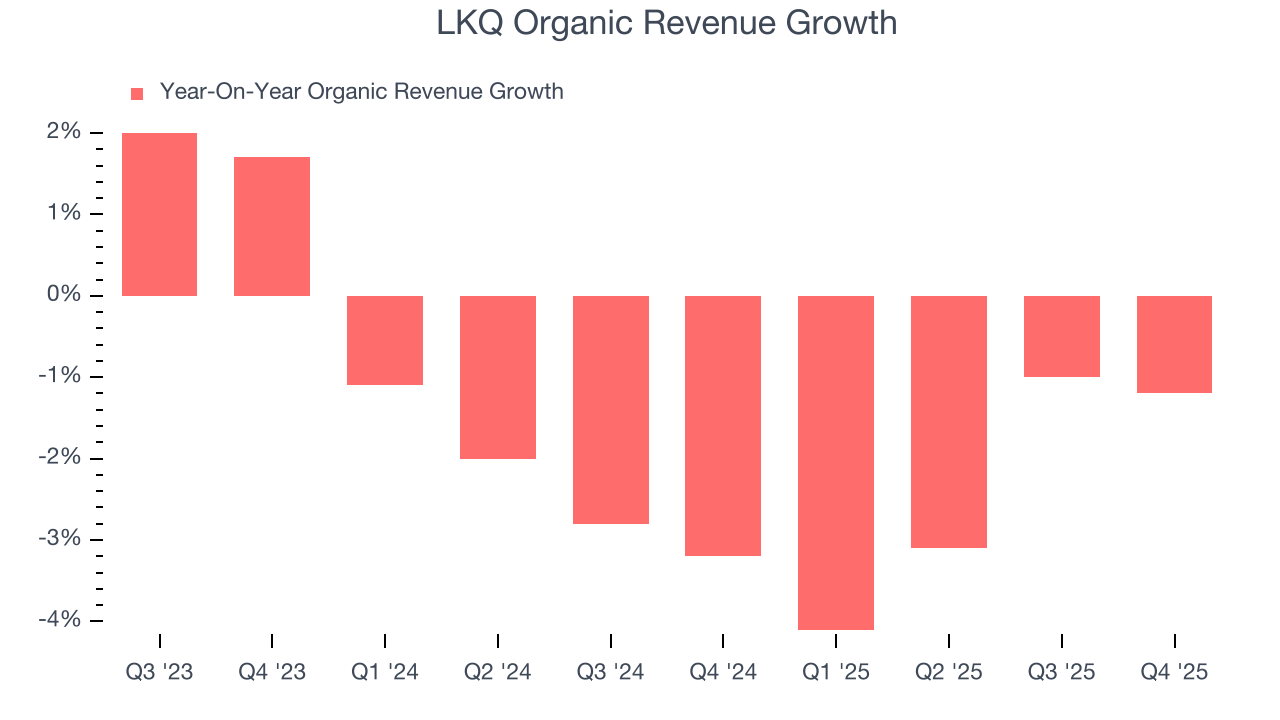
This quarter, LKQ’s $3.31 billion of revenue was flat year on year but beat Wall Street’s estimates by 3.5%.
Looking ahead, sell-side analysts expect revenue to remain flat over the next 12 months. This projection is underwhelming and suggests its newer products and services will not lead to better top-line performance yet.
6. Operating Margin
LKQ’s operating margin has been trending down over the last 12 months and averaged 7.9% over the last two years. The company’s profitability was mediocre for a consumer discretionary business and shows it couldn’t pass its higher operating expenses onto its customers.
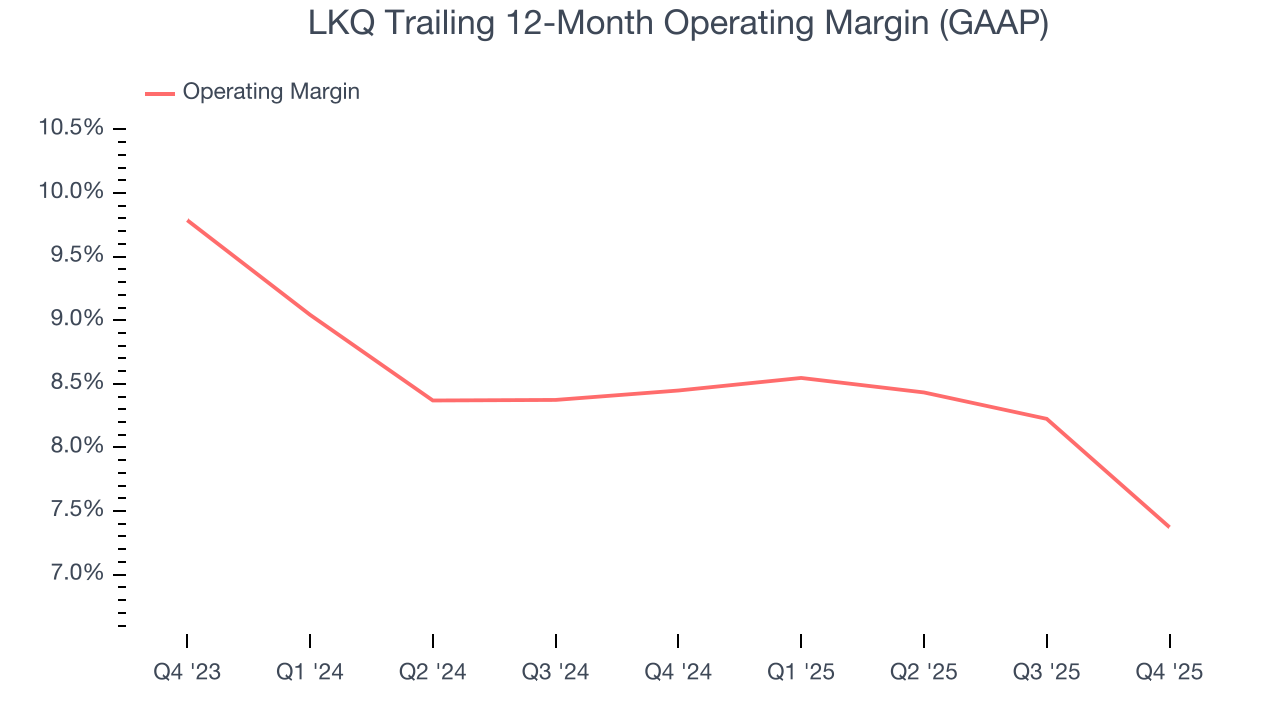
In Q4, LKQ generated an operating margin profit margin of 4.6%, down 3.6 percentage points year on year. This contraction shows it was less efficient because its expenses increased relative to its revenue.
7. Earnings Per Share
Revenue trends explain a company’s historical growth, but the long-term change in earnings per share (EPS) points to the profitability of that growth – for example, a company could inflate its sales through excessive spending on advertising and promotions.
LKQ’s weak 4% annual EPS growth over the last five years aligns with its revenue performance. This tells us it maintained its per-share profitability as it expanded.
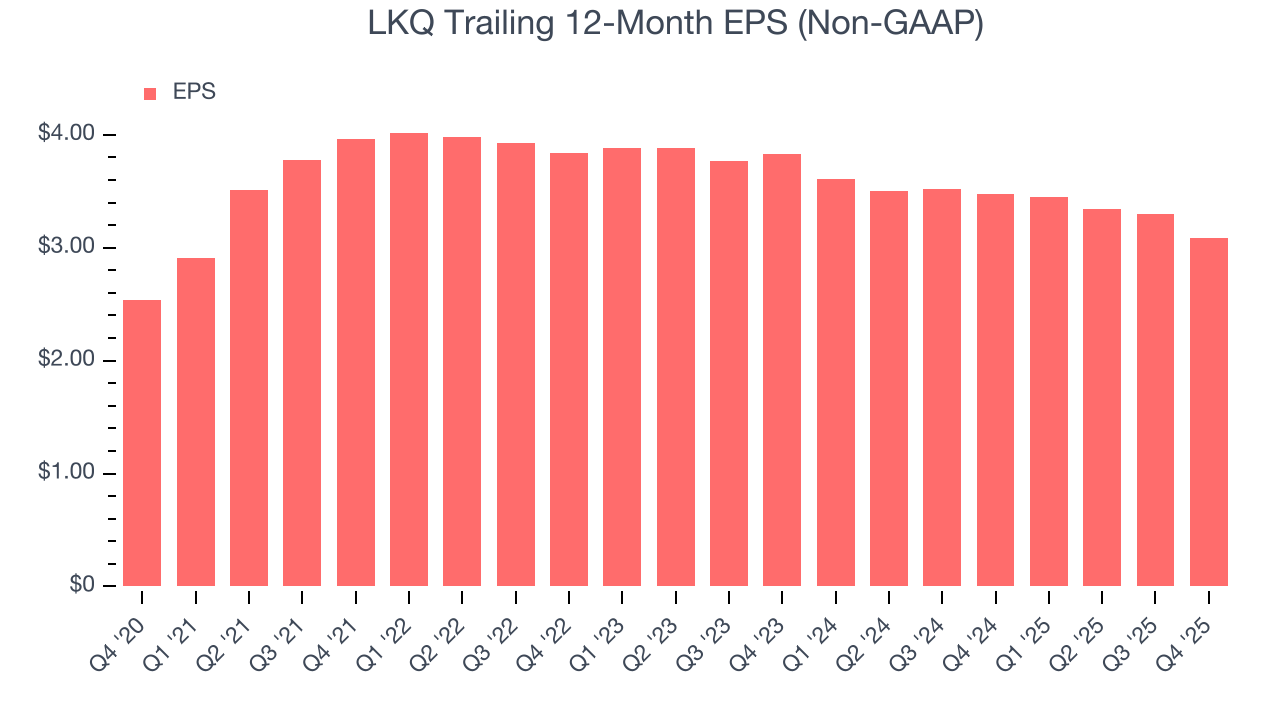
In Q4, LKQ reported adjusted EPS of $0.59, down from $0.80 in the same quarter last year. This print missed analysts’ estimates. Over the next 12 months, Wall Street expects LKQ’s full-year EPS of $3.09 to grow 6.5%.
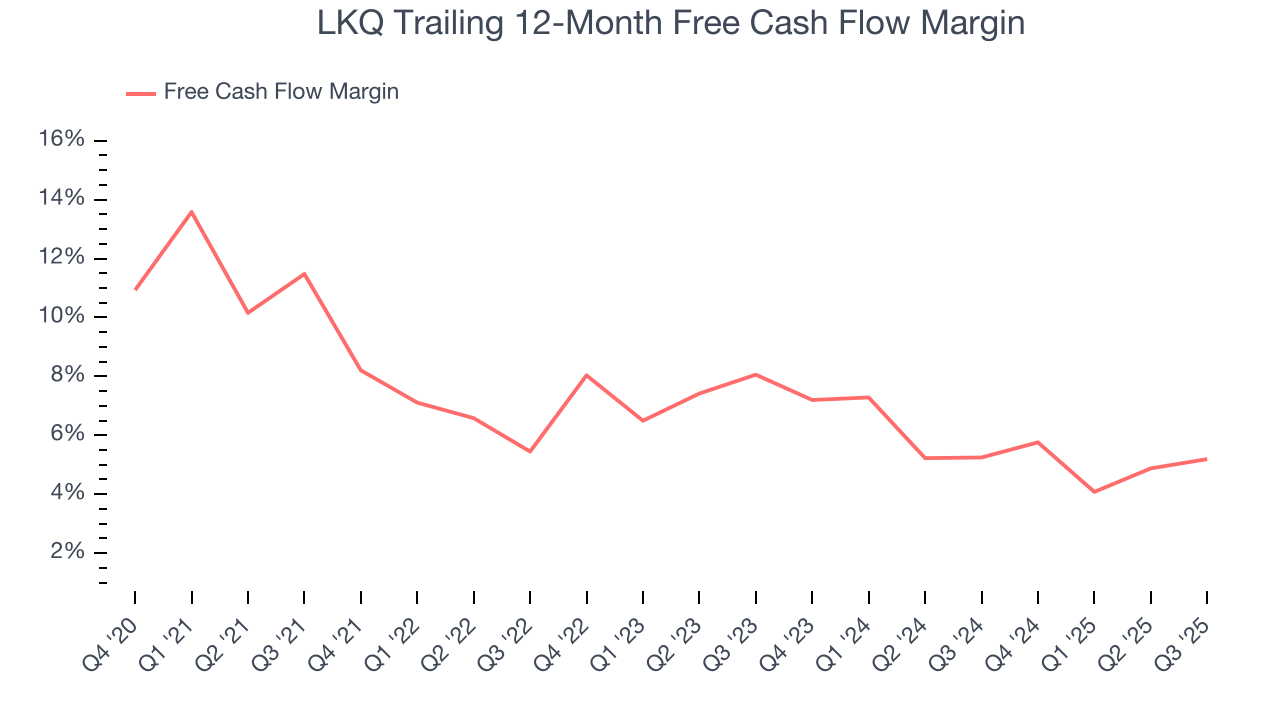
8. Cash Is King
Although earnings are undoubtedly valuable for assessing company performance, we believe cash is king because you can’t use accounting profits to pay the bills.
LKQ has shown poor cash profitability over the last two years, giving the company limited opportunities to return capital to shareholders. Its free cash flow margin averaged 5.6%, lousy for a consumer discretionary business.
9. Return on Invested Capital (ROIC)
EPS and free cash flow tell us whether a company was profitable while growing its revenue. But was it capital-efficient? Enter ROIC, a metric showing how much operating profit a company generates relative to the money it has raised (debt and equity).
LKQ historically did a mediocre job investing in profitable growth initiatives. Its five-year average ROIC was 10.7%, somewhat low compared to the best consumer discretionary companies that consistently pump out 25%+.
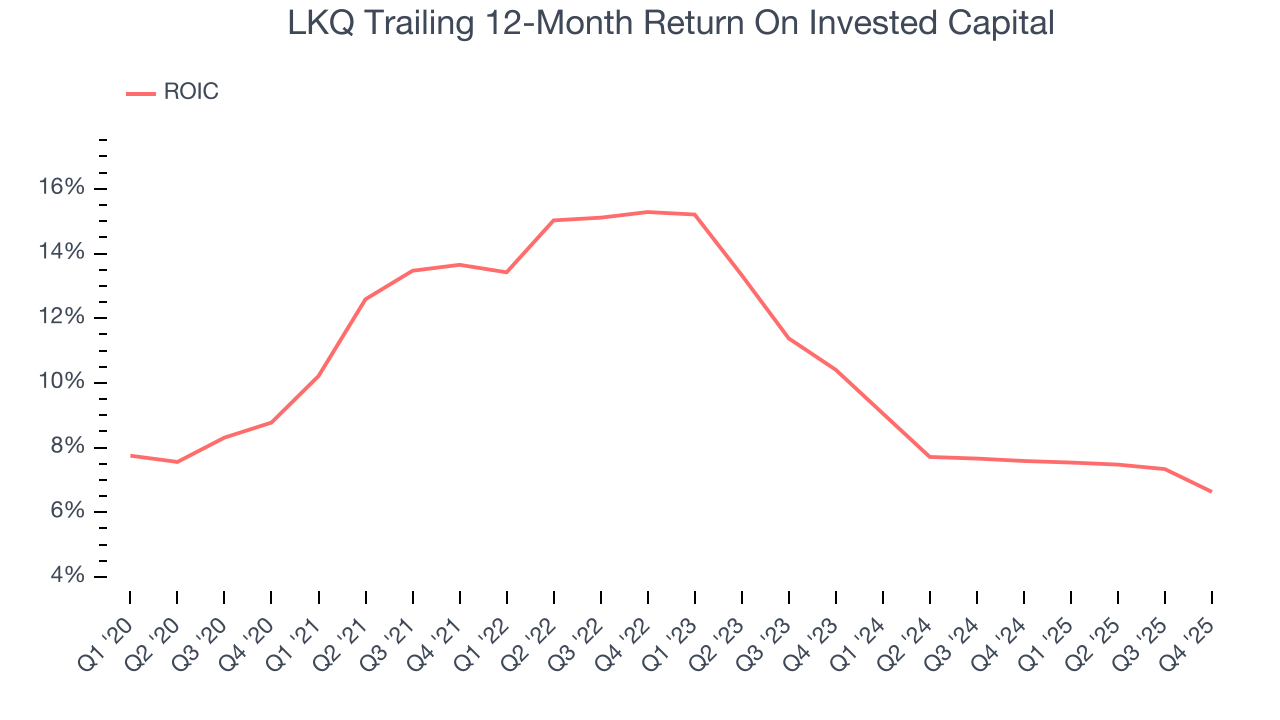
We like to invest in businesses with high returns, but the trend in a company’s ROIC is what often surprises the market and moves the stock price. Over the last few years, LKQ’s ROIC has unfortunately decreased. Paired with its already low returns, these declines suggest its profitable growth opportunities are few and far between.
10. Balance Sheet Assessment
LKQ reported $319 million of cash and $5.06 billion of debt on its balance sheet in the most recent quarter. As investors in high-quality companies, we primarily focus on two things: 1) that a company’s debt level isn’t too high and 2) that its interest payments are not excessively burdening the business.
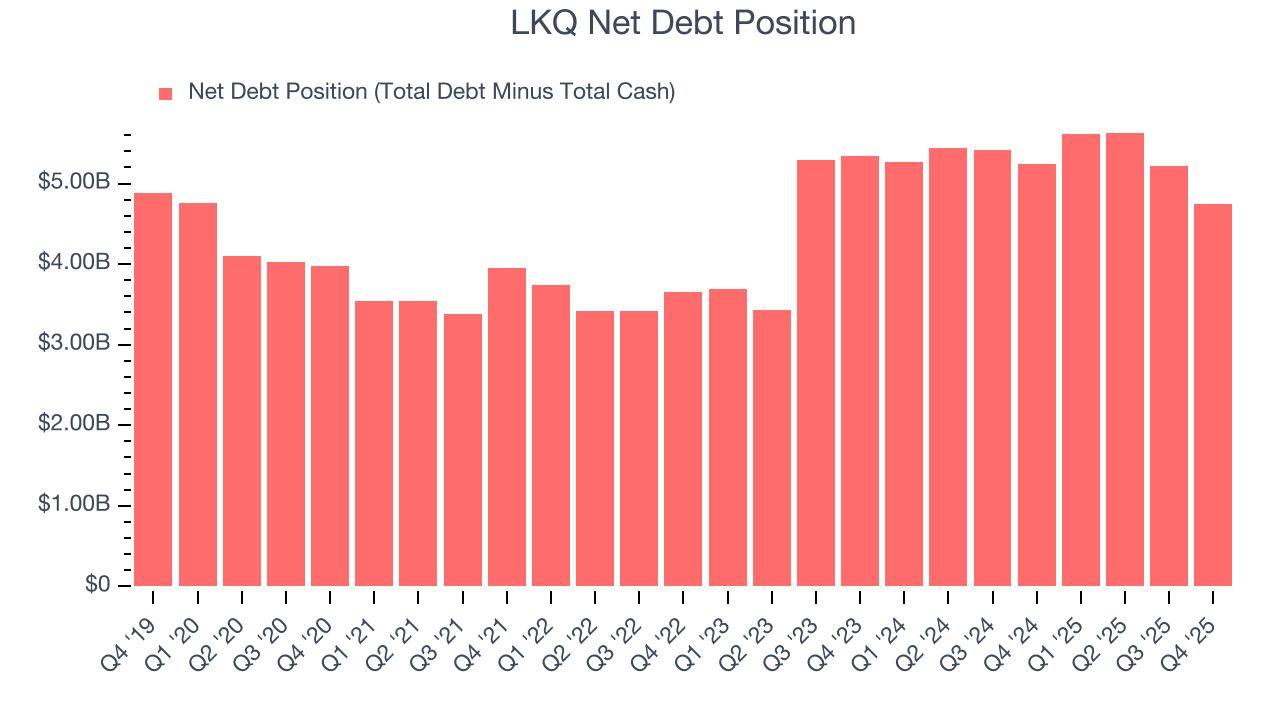
With $1.55 billion of EBITDA over the last 12 months, we view LKQ’s 3.1× net-debt-to-EBITDA ratio as safe. We also see its $100 million of annual interest expenses as appropriate. The company’s profits give it plenty of breathing room, allowing it to continue investing in growth initiatives.
11. Key Takeaways from LKQ’s Q4 Results
It was encouraging to see LKQ beat analysts’ revenue expectations this quarter. We were also happy its organic revenue was in line with Wall Street’s estimates. On the other hand, its EPS missed and its full-year EPS guidance fell short of Wall Street’s estimates. Overall, this was a softer quarter. The stock traded down 5.1% to $31.54 immediately after reporting.
12. Is Now The Time To Buy LKQ?
Updated: March 20, 2026 at 10:54 PM EDT
Before investing in or passing on LKQ, we urge you to understand the company’s business quality (or lack thereof), valuation, and the latest quarterly results - in that order.
We cheer for all companies serving everyday consumers, but in the case of LKQ, we’ll be cheering from the sidelines. On top of that, LKQ’s Forecasted free cash flow margin for next year suggests the company will fail to improve its cash conversion, and its organic sales performance has disappointed.
LKQ’s P/E ratio based on the next 12 months is 9.4x. While this valuation is optically cheap, the potential downside is huge given its shaky fundamentals. There are better investments elsewhere.
Wall Street analysts have a consensus one-year price target of $40.94 on the company (compared to the current share price of $28.47).
Although the price target is bullish, readers should exercise caution because analysts tend to be overly optimistic. The firms they work for, often big banks, have relationships with companies that extend into fundraising, M&A advisory, and other rewarding business lines. As a result, they typically hesitate to say bad things for fear they will lose out. We at StockStory do not suffer from such conflicts of interest, so we’ll always tell it like it is.