
Dave & Buster's (PLAY)
Dave & Buster's faces an uphill battle. Its sales have underperformed and its low returns on capital show it has few growth opportunities.― StockStory Analyst Team
1. News


2. Summary
Why We Think Dave & Buster's Will Underperform
Founded by a former game parlor and bar operator, Dave & Buster’s (NASDAQ:PLAY) operates a chain of arcades providing immersive entertainment experiences.
- Products and services have few die-hard fans as sales have declined by 1.4% annually over the last two years
- Operating margin falls short of the industry average, and the smaller profit dollars make it harder to react to unexpected market developments
- Short cash runway increases the probability of a capital raise that dilutes existing shareholders


Dave & Buster’s quality is insufficient. We see more attractive opportunities in the market.
Why There Are Better Opportunities Than Dave & Buster's


Dave & Buster's is trading at $12.93 per share, or 16.3x forward P/E. Yes, this valuation multiple is lower than that of other consumer discretionary peers, but we’ll remind you that you often get what you pay for.
It’s better to pay up for high-quality businesses with higher long-term earnings potential rather than to buy lower-quality stocks because they appear cheap. These challenged businesses often don’t re-rate, a phenomenon known as a “value trap”.
3. Dave & Buster's (PLAY) Research Report: Q3 CY2025 Update
Arcade company Dave & Buster’s (NASDAQ:PLAY) missed Wall Street’s revenue expectations in Q3 CY2025, with sales falling 1.1% year on year to $448.2 million. Its non-GAAP loss of $1.14 per share was 9.3% below analysts’ consensus estimates.
Dave & Buster's (PLAY) Q3 CY2025 Highlights:
- Revenue: $448.2 million vs analyst estimates of $461.1 million (1.1% year-on-year decline, 2.8% miss)
- Adjusted EPS: -$1.14 vs analyst expectations of -$1.04 (9.3% miss)
- Operating Margin: -3.6%, down from 1.4% in the same quarter last year
- Same-Store Sales fell 4% year on year (-7.7% in the same quarter last year)
- Market Capitalization: $616 million
Company Overview
Founded by a former game parlor and bar operator, Dave & Buster’s (NASDAQ:PLAY) operates a chain of arcades providing immersive entertainment experiences.
The Dave & Buster's experience is centered around “playing to win”, where customers purchase credits to play games and earn tickets that can redeemed for various prizes. The company’s venues typically feature a gaming floor, a sports bar with large-screen TVs airing live sporting events, and a dining section featuring a diverse menu of American favorites and cocktails.
Through these three areas, Dave & Buster's caters to multiple customer segments including families looking for a fun day out, young adults seeking social activities (some evenings feature 21+ only events), and companies organizing team-building events or corporate parties.
Dave & Buster's employs various marketing initiatives such as digital advertising and promotional events to reach customers and incentivize customer spending across the company’s food, beverage, and entertainment offerings. The company also offers loyalty programs and special packages to attract repeat business and enhance customer engagement.
4. Leisure Facilities
Leisure facilities companies often sell experiences rather than tangible products, and in the last decade-plus, consumers have slowly shifted their spending from "things" to "experiences". Leisure facilities seek to benefit but must innovate to do so because of the industry's high competition and capital intensity.
Dave & Buster’s competitors include Bowlero (NYSE:BOWL), TopGolf Callaway (NYSE:MODG), Six Flags (NYSE:SIX), and private company Barcade.
5. Revenue Growth
A company’s long-term sales performance can indicate its overall quality. Any business can put up a good quarter or two, but many enduring ones grow for years. Over the last five years, Dave & Buster's grew its sales at a 25.9% annual rate. Although this growth is acceptable on an absolute basis, it fell slightly short of our standards for the consumer discretionary sector, which enjoys a number of secular tailwinds.
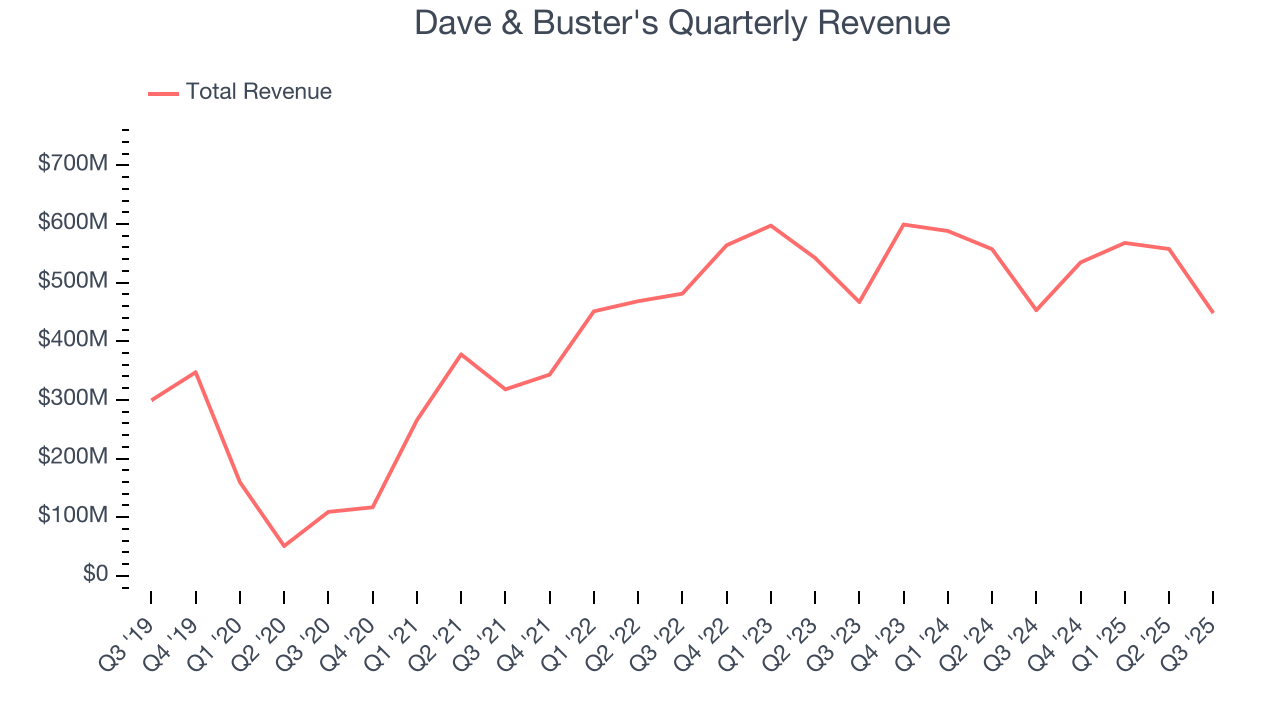
Long-term growth is the most important, but within consumer discretionary, product cycles are short and revenue can be hit-driven due to rapidly changing trends and consumer preferences. Dave & Buster’s performance shows it grew in the past but relinquished its gains over the last two years, as its revenue fell by 1.4% annually. Note that COVID hurt Dave & Buster’s business in 2020 and part of 2021, and it bounced back in a big way thereafter. 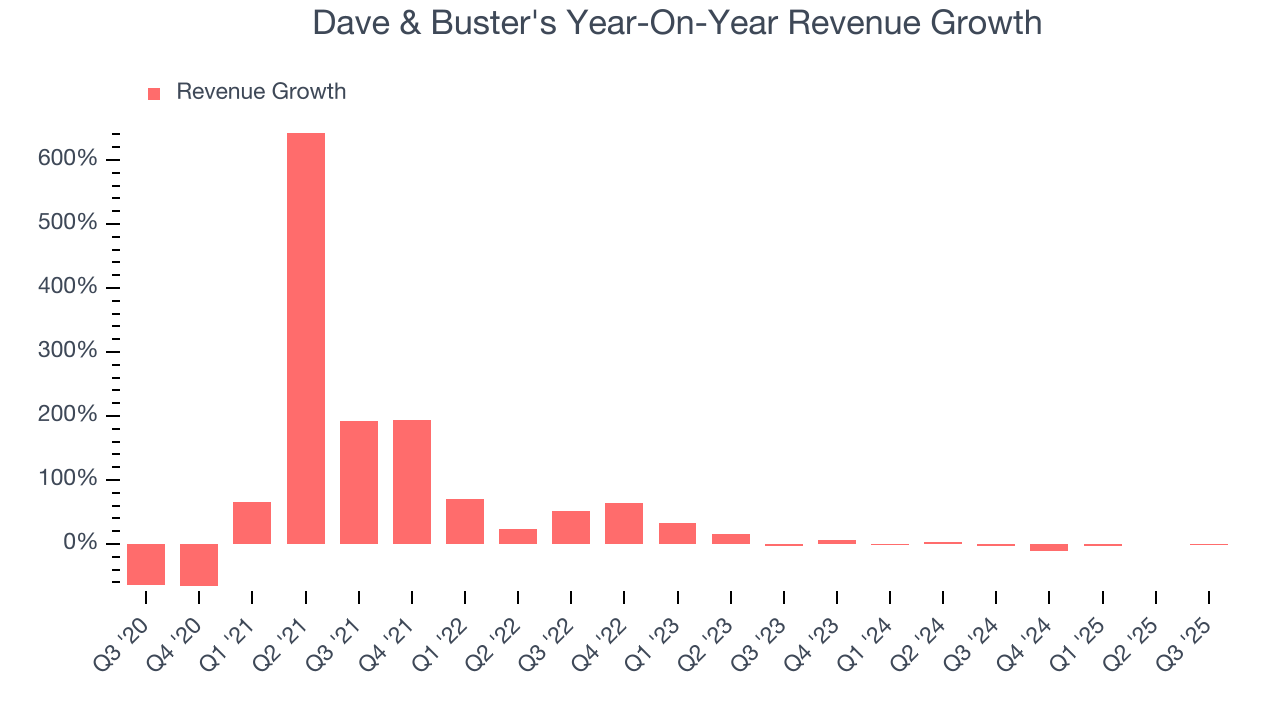
We can better understand the company’s revenue dynamics by analyzing its same-store sales, which show how much revenue its established locations generate. Over the last two years, Dave & Buster’s same-store sales averaged 6.4% year-on-year declines. Because this number is lower than its revenue growth, we can see the opening of new locations is boosting the company’s top-line performance. 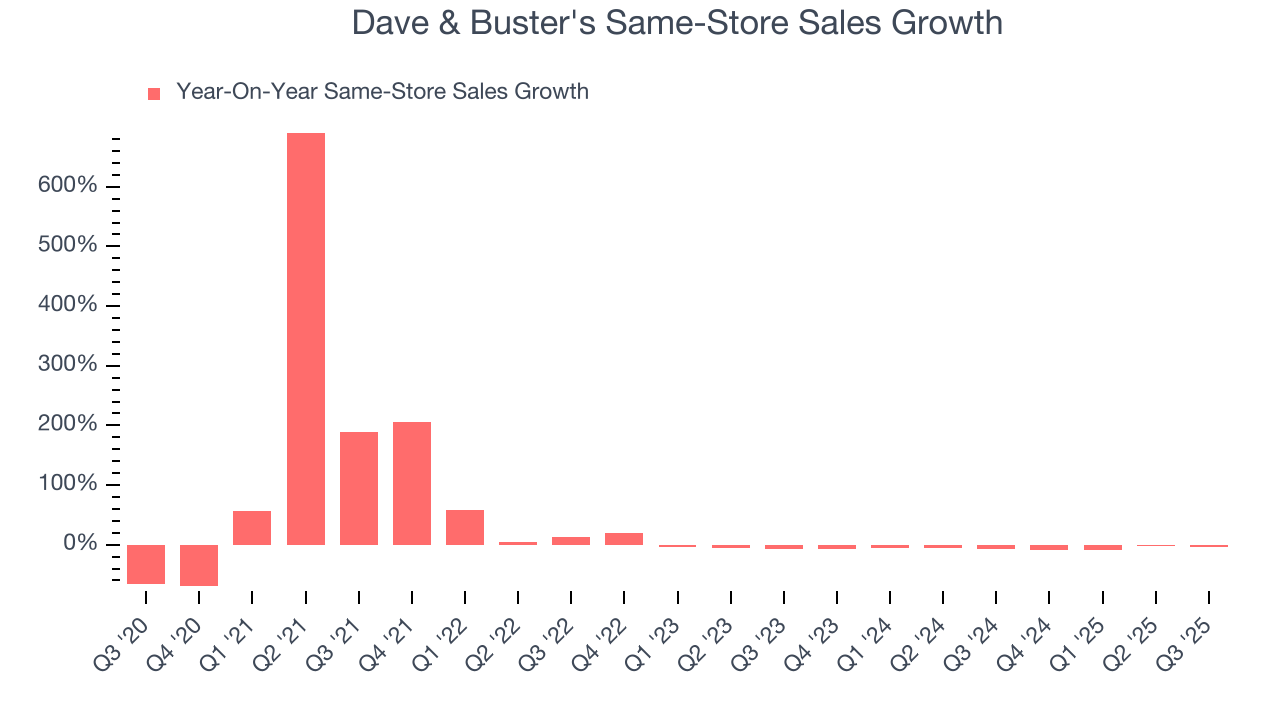
This quarter, Dave & Buster's missed Wall Street’s estimates and reported a rather uninspiring 1.1% year-on-year revenue decline, generating $448.2 million of revenue.
Looking ahead, sell-side analysts expect revenue to grow 5.8% over the next 12 months. While this projection implies its newer products and services will fuel better top-line performance, it is still below the sector average.
6. Operating Margin
Operating margin is a key measure of profitability. Think of it as net income - the bottom line - excluding the impact of taxes and interest on debt, which are less connected to business fundamentals.
Dave & Buster’s operating margin has shrunk over the last 12 months and averaged 9.5% over the last two years. The company’s profitability was mediocre for a consumer discretionary business and shows it couldn’t pass its higher operating expenses onto its customers.
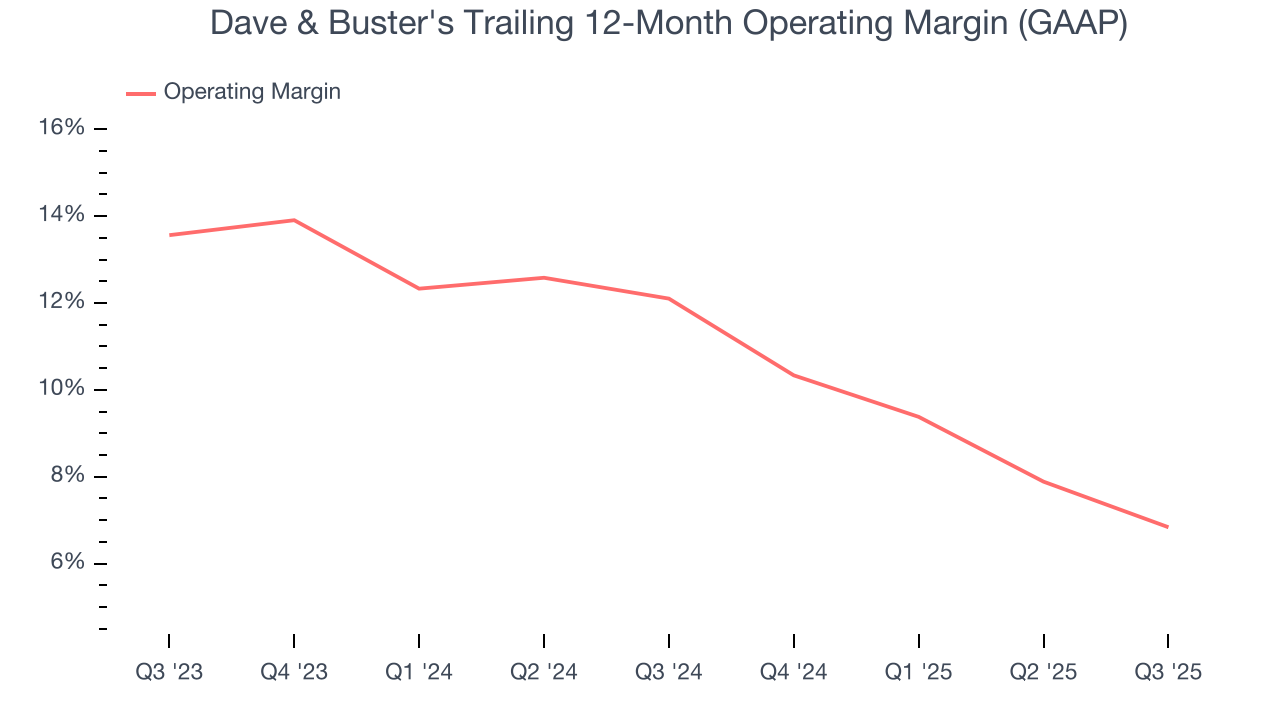
This quarter, Dave & Buster's generated an operating margin profit margin of negative 3.6%, down 5 percentage points year on year. This contraction shows it was less efficient because its expenses increased relative to its revenue.
7. Earnings Per Share
We track the long-term change in earnings per share (EPS) for the same reason as long-term revenue growth. Compared to revenue, however, EPS highlights whether a company’s growth is profitable.
Dave & Buster’s full-year EPS flipped from negative to positive over the last five years. This is encouraging and shows it’s at a critical moment in its life.
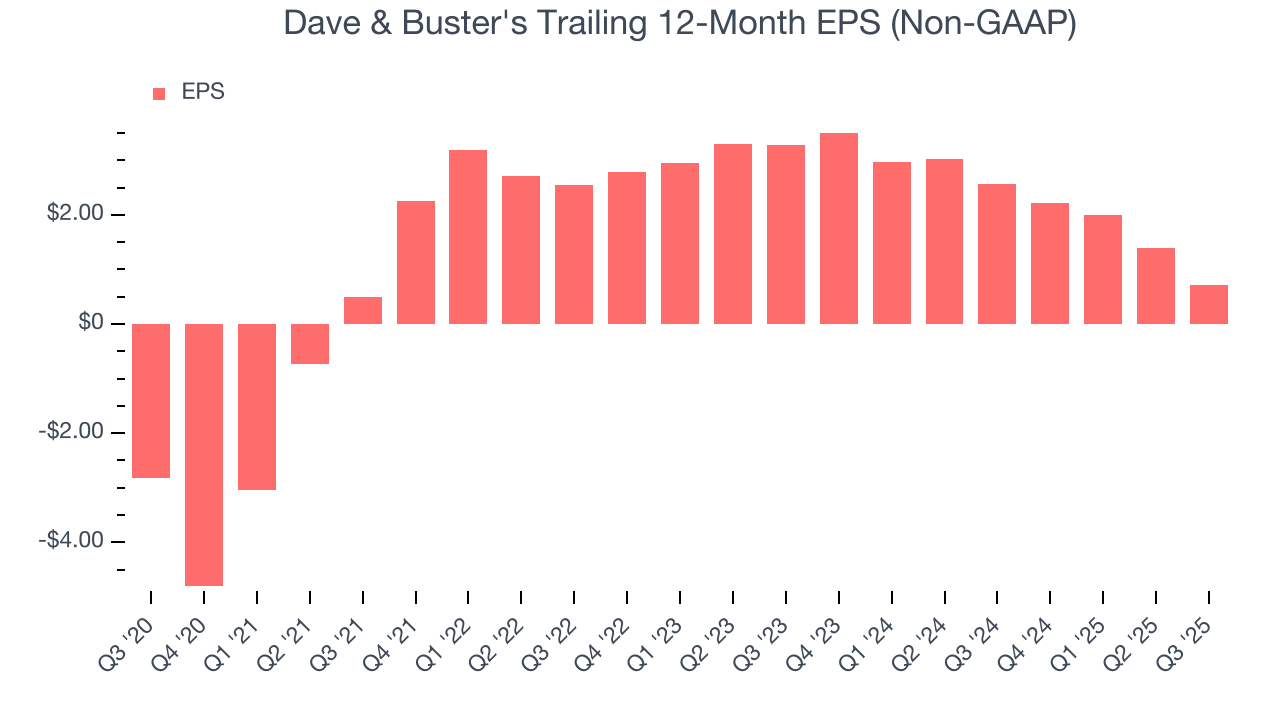
In Q3, Dave & Buster's reported adjusted EPS of negative $1.14, down from negative $0.45 in the same quarter last year. This print missed analysts’ estimates. Over the next 12 months, Wall Street expects Dave & Buster’s full-year EPS of $0.71 to grow 51.4%.
8. Cash Is King
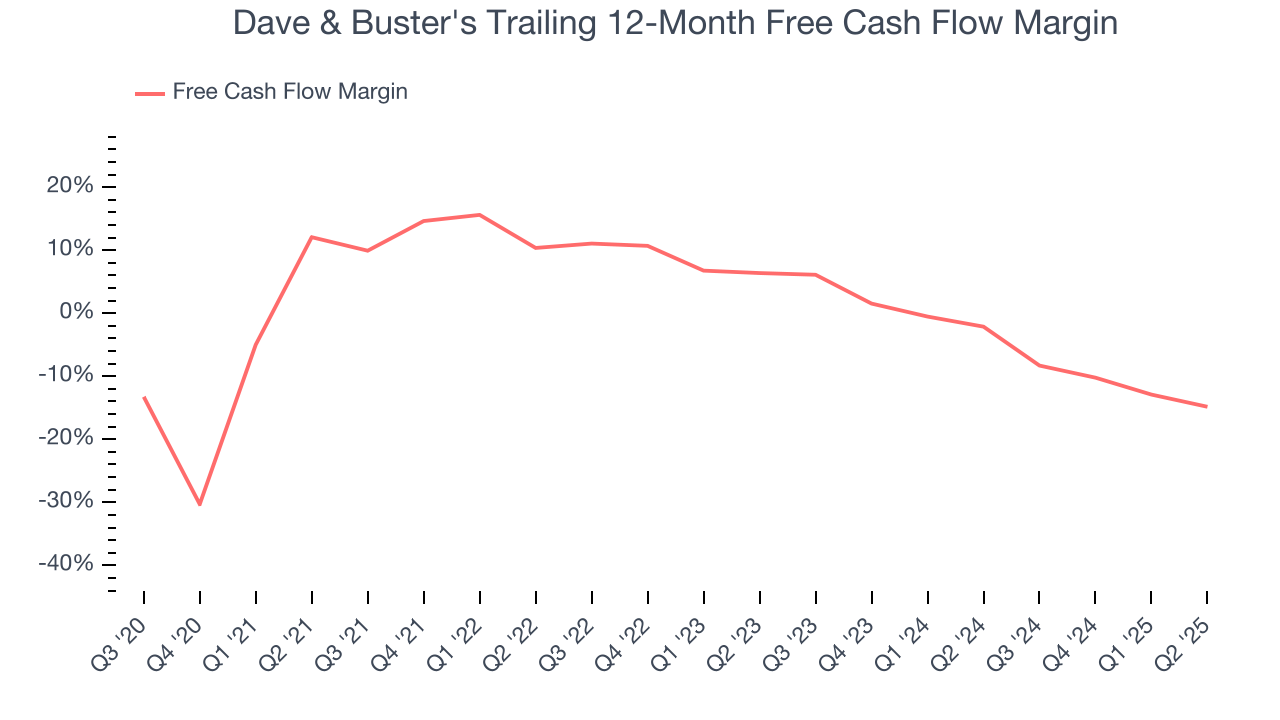
Although earnings are undoubtedly valuable for assessing company performance, we believe cash is king because you can’t use accounting profits to pay the bills.
Over the last two years, Dave & Buster’s demanding reinvestments to stay relevant have drained its resources, putting it in a pinch and limiting its ability to return capital to investors. Its free cash flow margin averaged negative 9.3%, meaning it lit $9.26 of cash on fire for every $100 in revenue.
9. Return on Invested Capital (ROIC)
EPS and free cash flow tell us whether a company was profitable while growing its revenue. But was it capital-efficient? A company’s ROIC explains this by showing how much operating profit it makes compared to the money it has raised (debt and equity).
Dave & Buster's historically did a mediocre job investing in profitable growth initiatives. Its five-year average ROIC was 12.9%, somewhat low compared to the best consumer discretionary companies that consistently pump out 25%+.
We like to invest in businesses with high returns, but the trend in a company’s ROIC is what often surprises the market and moves the stock price. Over the last few years, Dave & Buster’s ROIC averaged 4.3 percentage point decreases each year. Paired with its already low returns, these declines suggest its profitable growth opportunities are few and far between.
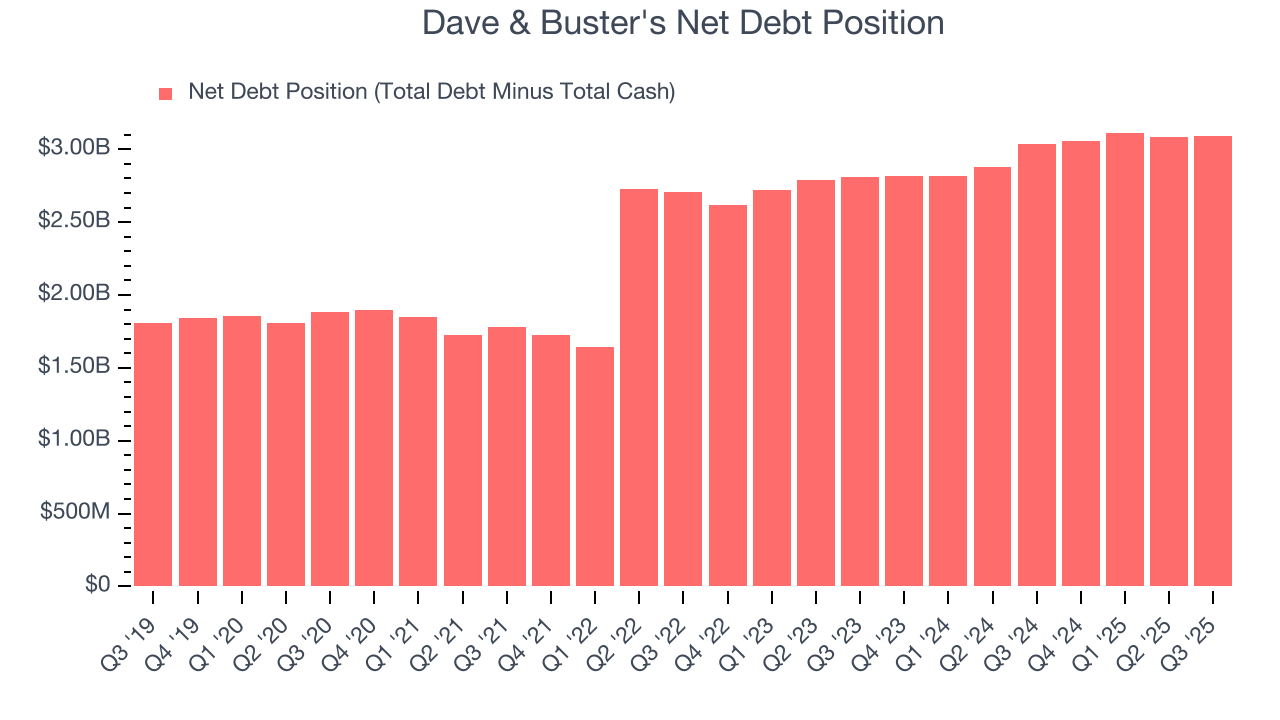
10. Balance Sheet Risk
As long-term investors, the risk we care about most is the permanent loss of capital, which can happen when a company goes bankrupt or raises money from a disadvantaged position. This is separate from short-term stock price volatility, something we are much less bothered by.
Dave & Buster’s $3.11 billion of debt exceeds the $13.6 million of cash on its balance sheet. Furthermore, its 7× net-debt-to-EBITDA ratio (based on its EBITDA of $452.5 million over the last 12 months) shows the company is overleveraged.
At this level of debt, incremental borrowing becomes increasingly expensive and credit agencies could downgrade the company’s rating if profitability falls. Dave & Buster's could also be backed into a corner if the market turns unexpectedly – a situation we seek to avoid as investors in high-quality companies.
We hope Dave & Buster's can improve its balance sheet and remain cautious until it increases its profitability or pays down its debt.
11. Key Takeaways from Dave & Buster’s Q3 Results
There weren't many positives here, starting with negative same-store sales. Revenue and EPS also fell short of Wall Street’s estimates. Overall, this was a softer quarter. The stock traded down 4.6% to $17.28 immediately following the results.
12. Is Now The Time To Buy Dave & Buster's?
Updated: March 16, 2026 at 12:06 AM EDT
We think that the latest earnings result is only one piece of the bigger puzzle. If you’re deciding whether to own Dave & Buster's, you should also grasp the company’s longer-term business quality and valuation.
Dave & Buster's doesn’t pass our quality test. While its Forecasted free cash flow margin suggests the company will have more capital to invest or return to shareholders next year, the downside is its same-store sales performance has disappointed. On top of that, its relatively low ROIC suggests management has struggled to find compelling investment opportunities.
Dave & Buster’s P/E ratio based on the next 12 months is 16.3x. This valuation is reasonable, but the company’s shaky fundamentals present too much downside risk. There are better investments elsewhere.
Wall Street analysts have a consensus one-year price target of $26.22 on the company (compared to the current share price of $12.93).
Although the price target is bullish, readers should exercise caution because analysts tend to be overly optimistic. The firms they work for, often big banks, have relationships with companies that extend into fundraising, M&A advisory, and other rewarding business lines. As a result, they typically hesitate to say bad things for fear they will lose out. We at StockStory do not suffer from such conflicts of interest, so we’ll always tell it like it is.