
United Airlines (UAL)
We wouldn’t buy United Airlines. Its weak sales growth and low returns on capital show it struggled to generate demand and profits.― StockStory Analyst Team
1. News


2. Summary
Why We Think United Airlines Will Underperform
Founded in 1926, United Airlines Holdings (NASDAQ:UAL) operates a global airline network, providing passenger and cargo air transportation services across domestic and international routes.
- Large revenue base makes it harder to increase sales quickly, and its annual revenue growth of 4.9% over the last two years was below our standards for the consumer discretionary sector
- Responsiveness to unforeseen market trends is restricted due to its substandard operating margin profitability
- Low free cash flow margin gives it little breathing room, constraining its ability to self-fund growth or return capital to shareholders


United Airlines’s quality is lacking. We’re redirecting our focus to better businesses.
Why There Are Better Opportunities Than United Airlines


United Airlines’s stock price of $90.21 implies a valuation ratio of 7.1x forward P/E. This sure is a cheap multiple, but you get what you pay for.
Our advice is to pay up for elite businesses whose advantages are tailwinds to earnings growth. Don’t get sucked into lower-quality businesses just because they seem like bargains. These mediocre businesses often never achieve a higher multiple as hoped, a phenomenon known as a “value trap”.
3. United Airlines (UAL) Research Report: Q4 CY2025 Update
Airline company United Airlines Holdings (NASDAQ:UAL) met Wall Streets revenue expectations in Q4 CY2025, with sales up 4.8% year on year to $15.4 billion. Its non-GAAP profit of $3.10 per share was 5.4% above analysts’ consensus estimates.
United Airlines (UAL) Q4 CY2025 Highlights:
- Revenue: $15.4 billion vs analyst estimates of $15.38 billion (4.8% year-on-year growth, in line)
- Adjusted EPS: $3.10 vs analyst estimates of $2.94 (5.4% beat)
- Adjusted EBITDA: $2.19 billion vs analyst estimates of $2.15 billion (14.2% margin, 1.5% beat)
- Operating Margin: 9%, down from 10.2% in the same quarter last year
- Free Cash Flow was -$579 million, down from $549 million in the same quarter last year
- Revenue Passenger Miles: 68.25 billion, up 3.78 billion year on year
- Market Capitalization: $36.74 billion
Company Overview
Founded in 1926, United Airlines Holdings (NASDAQ:UAL) operates a global airline network, providing passenger and cargo air transportation services across domestic and international routes.
The company offers premium cabin services, frequent flyer programs through MileagePlus, and ancillary services such as baggage handling and in-flight entertainment.
4. Travel and Vacation Providers
Airlines, hotels, resorts, and cruise line companies often sell experiences rather than tangible products, and in the last decade-plus, consumers have slowly shifted from buying "things" (wasteful) to buying "experiences" (memorable). In addition, the internet has introduced new ways of approaching leisure and lodging such as booking homes and longer-term accommodations. Traditional airlines, hotel, resorts, and cruise line companies must innovate to stay relevant in a market rife with innovation.
Competitors in the airline industry include Delta Air Lines (NYSE:DAL), American Airlines Group (NASDAQ:AAL), and Southwest Airlines (NYSE:LUV).
5. Revenue Growth
Examining a company’s long-term performance can provide clues about its quality. Any business can experience short-term success, but top-performing ones enjoy sustained growth for years. Over the last five years, United Airlines grew its sales at a 30.9% annual rate. Although this growth is acceptable on an absolute basis, it fell slightly short of our standards for the consumer discretionary sector, which enjoys a number of secular tailwinds.
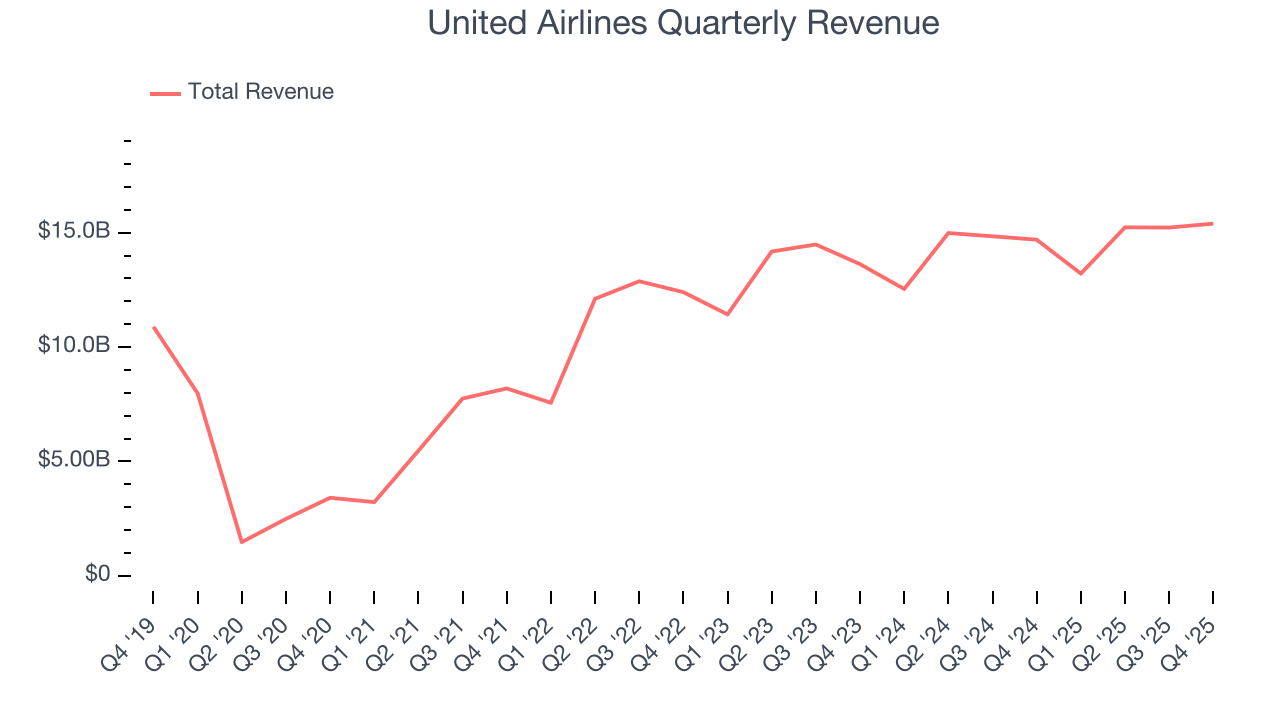
We at StockStory place the most emphasis on long-term growth, but within consumer discretionary, a stretched historical view may miss a company riding a successful new property or trend. United Airlines’s recent performance shows its demand has slowed as its annualized revenue growth of 4.9% over the last two years was below its five-year trend. 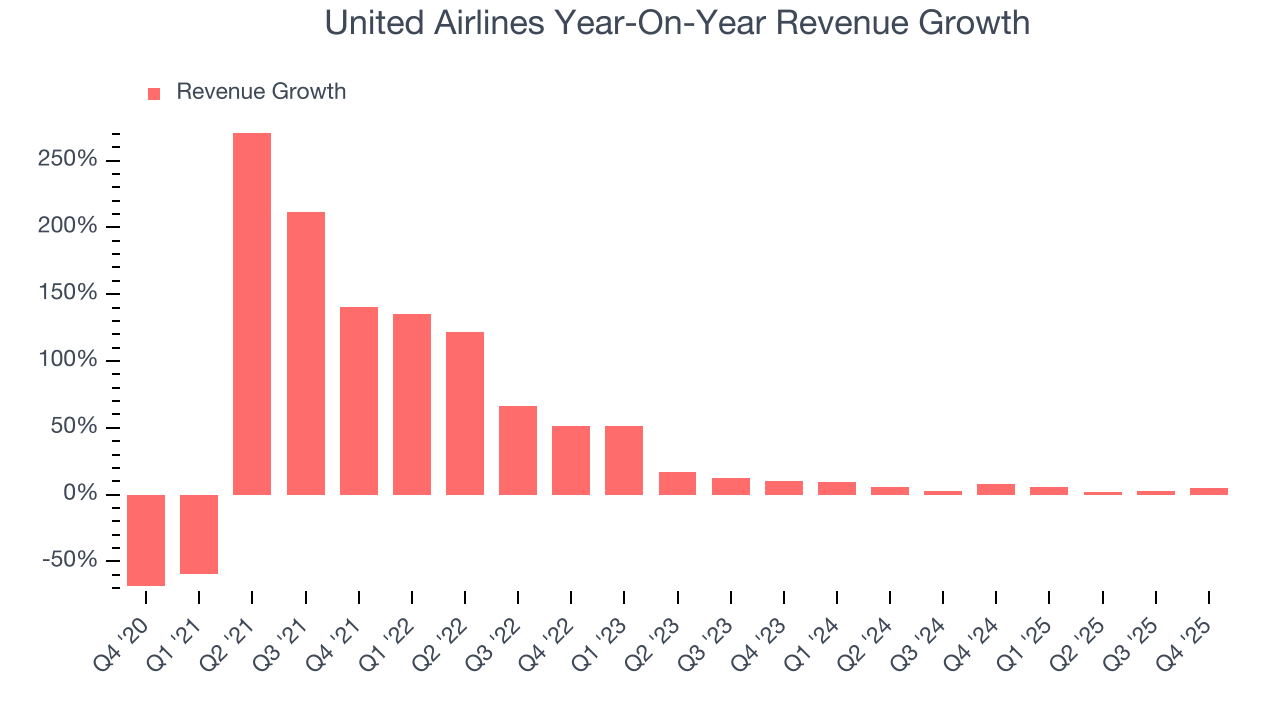
We can better understand the company’s revenue dynamics by analyzing its number of revenue passenger miles, which reached 68.25 billion in the latest quarter. Over the last two years, United Airlines’s revenue passenger miles averaged 5.5% year-on-year growth. Because this number aligns with its revenue growth during the same period, we can see the company’s monetization was fairly consistent. 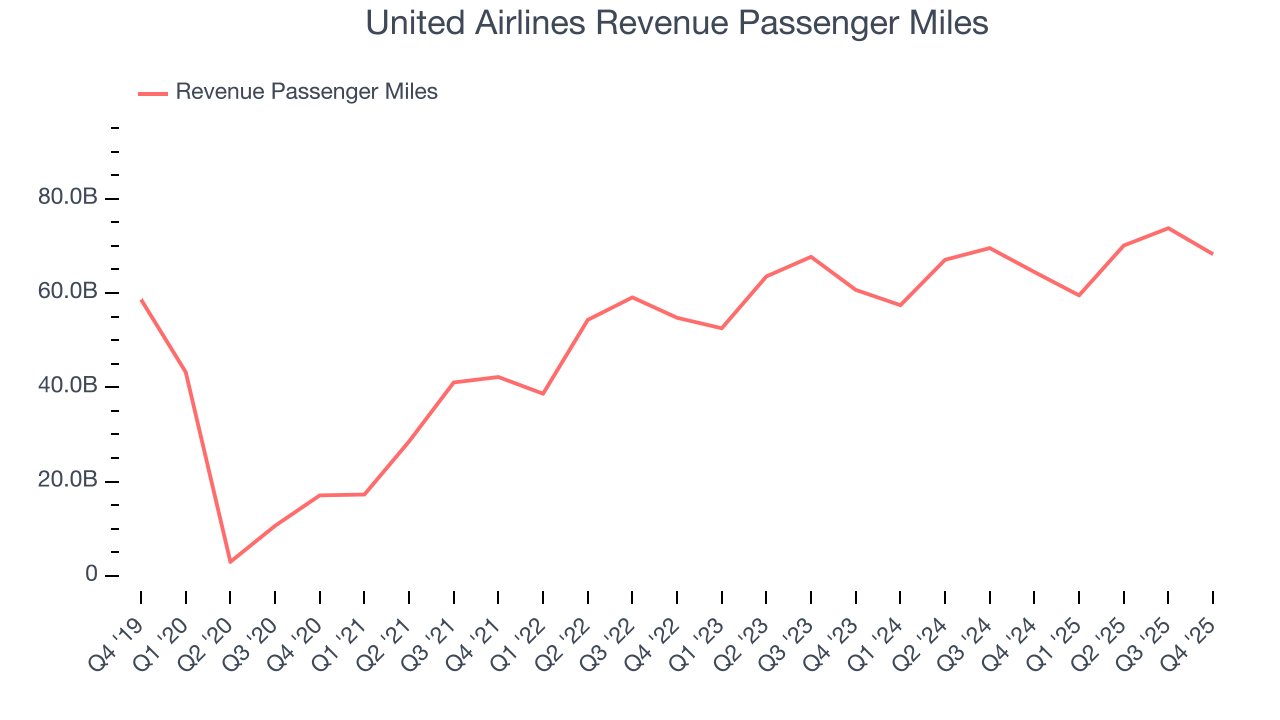
This quarter, United Airlines grew its revenue by 4.8% year on year, and its $15.4 billion of revenue was in line with Wall Street’s estimates.
Looking ahead, sell-side analysts expect revenue to grow 8.1% over the next 12 months. While this projection implies its newer products and services will catalyze better top-line performance, it is still below the sector average.
6. Operating Margin
Operating margin is a key measure of profitability. Think of it as net income - the bottom line - excluding the impact of taxes and interest on debt, which are less connected to business fundamentals.
United Airlines’s operating margin might fluctuated slightly over the last 12 months but has remained more or less the same, averaging 8.4% over the last two years. This profitability was inadequate for a consumer discretionary business and caused by its suboptimal cost structure.
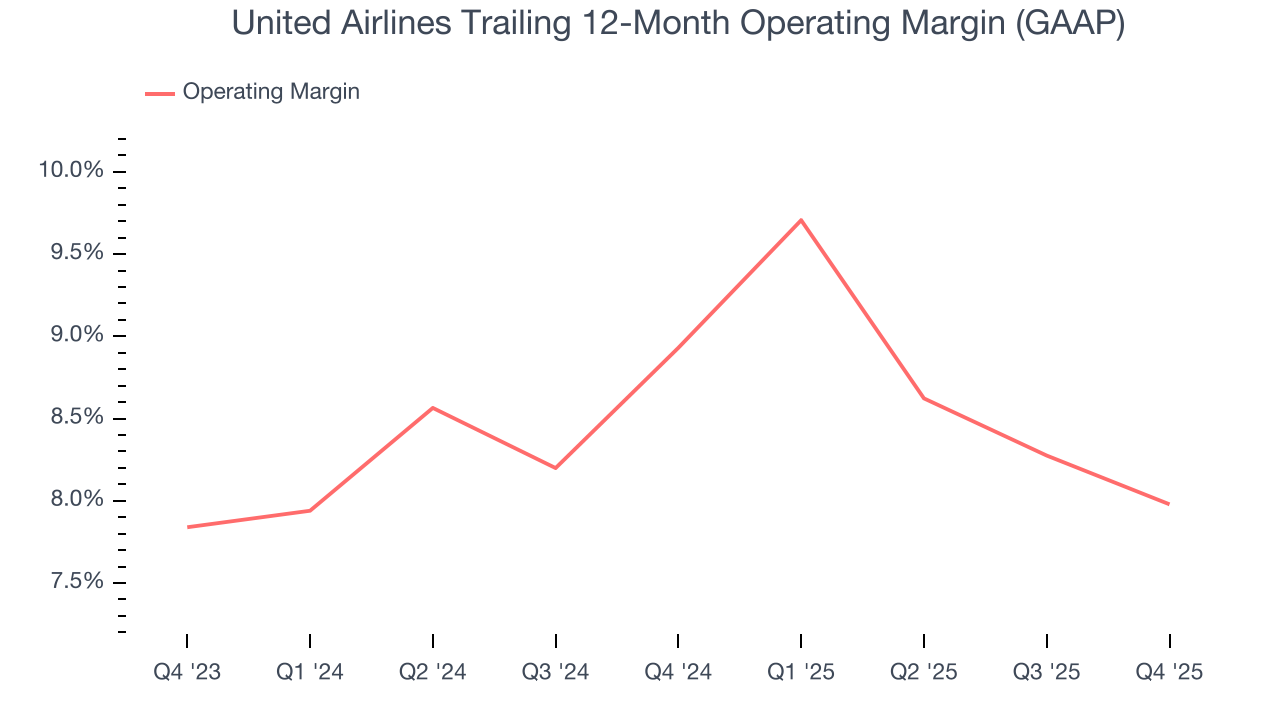
This quarter, United Airlines generated an operating margin profit margin of 9%, down 1.2 percentage points year on year. This reduction is quite minuscule and indicates the company’s overall cost structure has been relatively stable.
In the coming year, Wall Street expects United Airlines to become more profitable. Analysts are expecting the company’s trailing 12-month operating margin of 8% to rise to 9.4%.
7. Earnings Per Share
Revenue trends explain a company’s historical growth, but the long-term change in earnings per share (EPS) points to the profitability of that growth – for example, a company could inflate its sales through excessive spending on advertising and promotions.
United Airlines’s full-year EPS flipped from negative to positive over the last five years. This is encouraging and shows it’s at a critical moment in its life.
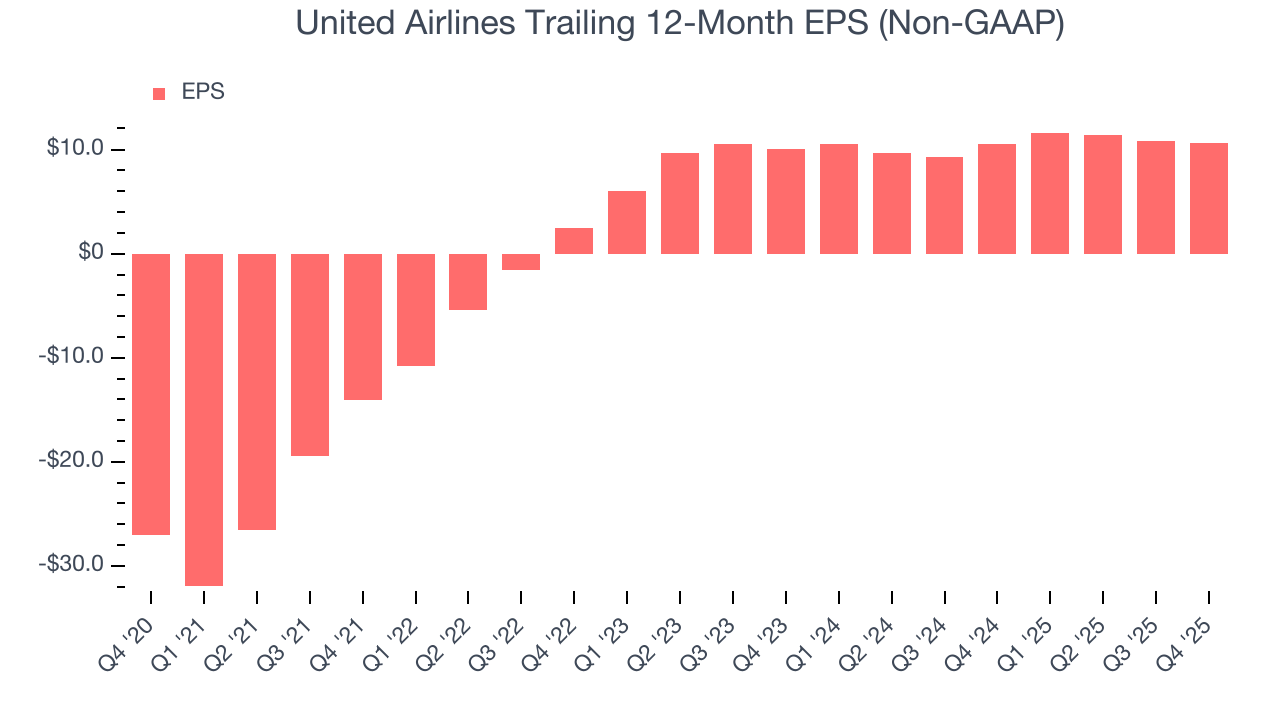
In Q4, United Airlines reported adjusted EPS of $3.10, down from $3.26 in the same quarter last year. Despite falling year on year, this print beat analysts’ estimates by 5.4%. Over the next 12 months, Wall Street expects United Airlines’s full-year EPS of $10.66 to grow 22%.
8. Cash Is King
Free cash flow isn't a prominently featured metric in company financials and earnings releases, but we think it's telling because it accounts for all operating and capital expenses, making it tough to manipulate. Cash is king.
United Airlines has shown poor cash profitability over the last two years, giving the company limited opportunities to return capital to shareholders. Its free cash flow margin averaged 5.5%, lousy for a consumer discretionary business.
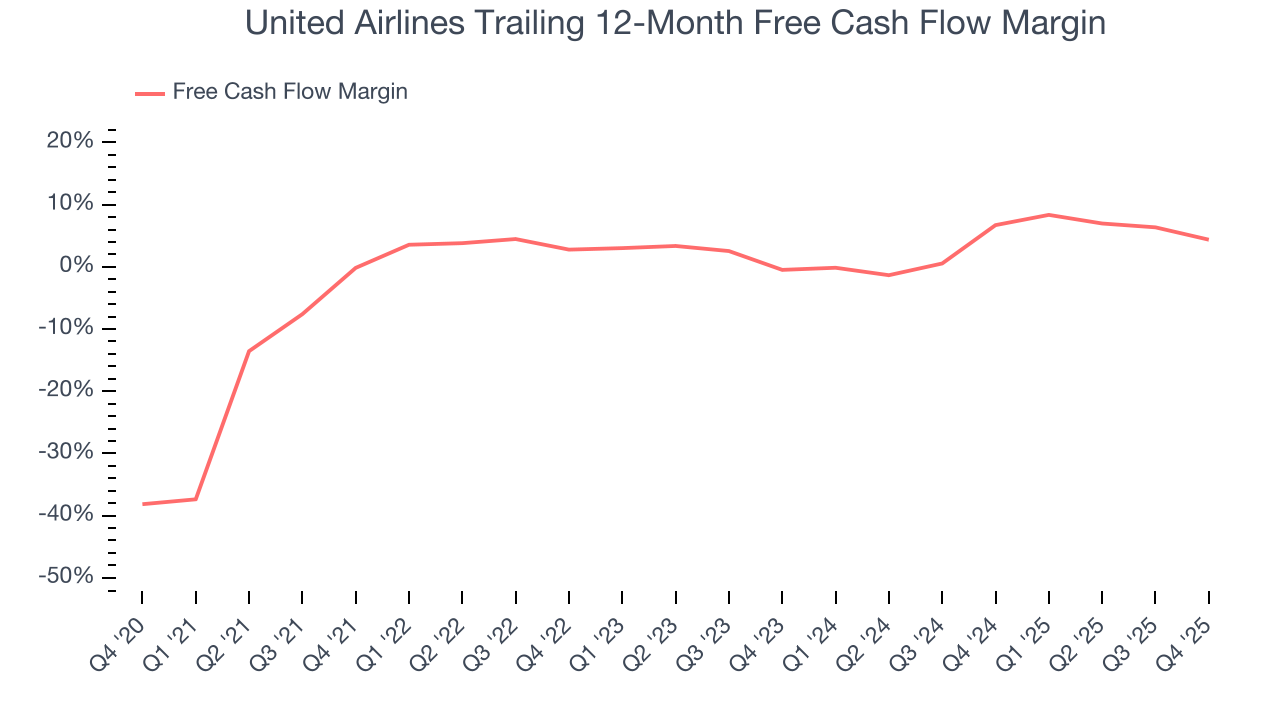
United Airlines burned through $579 million of cash in Q4, equivalent to a negative 3.8% margin. The company’s cash flow turned negative after being positive in the same quarter last year, prompting us to pay closer attention. Short-term fluctuations typically aren’t a big deal because investment needs can be seasonal, but we’ll be watching to see if the trend extrapolates into future quarters.
Over the next year, analysts’ consensus estimates show they’re expecting United Airlines’s free cash flow margin of 4.4% for the last 12 months to remain the same.
9. Return on Invested Capital (ROIC)
EPS and free cash flow tell us whether a company was profitable while growing its revenue. But was it capital-efficient? Enter ROIC, a metric showing how much operating profit a company generates relative to the money it has raised (debt and equity).
United Airlines historically did a mediocre job investing in profitable growth initiatives. Its five-year average ROIC was 12.1%, somewhat low compared to the best consumer discretionary companies that consistently pump out 25%+.
We like to invest in businesses with high returns, but the trend in a company’s ROIC is what often surprises the market and moves the stock price. Over the last few years, United Airlines’s ROIC has increased. This is a good sign, but we recognize its lack of profitable growth during the COVID era was the primary reason for the change.
10. Balance Sheet Assessment
United Airlines reported $12.24 billion of cash and $25.62 billion of debt on its balance sheet in the most recent quarter. As investors in high-quality companies, we primarily focus on two things: 1) that a company’s debt level isn’t too high and 2) that its interest payments are not excessively burdening the business.
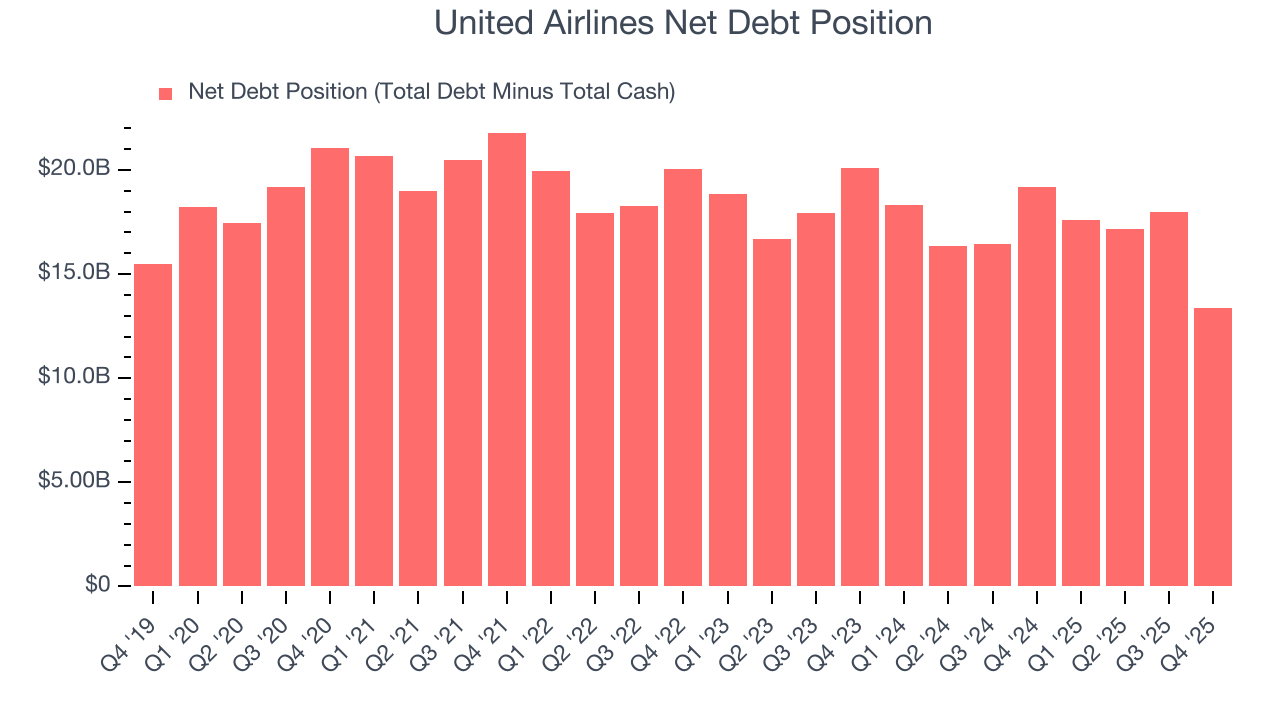
With $7.97 billion of EBITDA over the last 12 months, we view United Airlines’s 1.7× net-debt-to-EBITDA ratio as safe. We also see its $236 million of annual interest expenses as appropriate. The company’s profits give it plenty of breathing room, allowing it to continue investing in growth initiatives.
11. Key Takeaways from United Airlines’s Q4 Results
It was good to see United Airlines beat analysts’ EPS expectations this quarter. Zooming out, we think this was a decent quarter. The stock traded up 3.7% to $113.39 immediately after reporting.
12. Is Now The Time To Buy United Airlines?
Updated: March 17, 2026 at 12:05 AM EDT
A common mistake we notice when investors are deciding whether to buy a stock or not is that they simply look at the latest earnings results. Business quality and valuation matter more, so we urge you to understand these dynamics as well.
We cheer for all companies serving everyday consumers, but in the case of United Airlines, we’ll be cheering from the sidelines. On top of that, United Airlines’s number of revenue passenger miles has disappointed, and its Forecasted free cash flow margin for next year suggests the company will fail to improve its cash conversion.
United Airlines’s P/E ratio based on the next 12 months is 7.1x. While this valuation is optically cheap, the potential downside is huge given its shaky fundamentals. There are better investments elsewhere.
Wall Street analysts have a consensus one-year price target of $136.15 on the company (compared to the current share price of $90.21).
Although the price target is bullish, readers should exercise caution because analysts tend to be overly optimistic. The firms they work for, often big banks, have relationships with companies that extend into fundraising, M&A advisory, and other rewarding business lines. As a result, they typically hesitate to say bad things for fear they will lose out. We at StockStory do not suffer from such conflicts of interest, so we’ll always tell it like it is.