
Viking (VIK)
We wouldn’t buy Viking. It generates meager free cash flow, limiting its ability to invest in growth initiatives or reward shareholders.― StockStory Analyst Team
1. News


2. Summary
Why We Think Viking Will Underperform
From a single river cruise offering to a fleet of 96 vessels across multiple continents, Viking (NYSE:VIK) operates a fleet of small luxury cruise ships offering river, ocean, and expedition voyages focused on cultural enrichment and destination immersion.
- Muted 17.5% annual revenue growth over the last two years shows its demand lagged behind its consumer discretionary peers
- Poor expense management has led to an operating margin that is below the industry average
- Poor free cash flow generation means it has few chances to reinvest for growth, repurchase shares, or distribute capital


Viking doesn’t check our boxes. Our attention is focused on better businesses.
Why There Are Better Opportunities Than Viking


Viking’s stock price of $67.78 implies a valuation ratio of 21.6x forward P/E. Not only is Viking’s multiple richer than most consumer discretionary peers, but it’s also expensive for its fundamentals.
We’d rather invest in similarly-priced but higher-quality companies with more reliable earnings growth.
3. Viking (VIK) Research Report: Q4 CY2025 Update
Luxury cruise operator Viking (NYSE:VIK) beat Wall Street’s revenue expectations in Q4 CY2025, with sales up 27.8% year on year to $1.72 billion. Its GAAP profit of $0.67 per share was 21% above analysts’ consensus estimates.
Viking (VIK) Q4 CY2025 Highlights:
- Revenue: $1.72 billion vs analyst estimates of $1.62 billion (27.8% year-on-year growth, 6.6% beat)
- EPS (GAAP): $0.67 vs analyst estimates of $0.55 (21% beat)
- Adjusted EBITDA: $462.8 million vs analyst estimates of $405.9 million (26.8% margin, 14% beat)
- Operating Margin: 20.9%, up from 17.1% in the same quarter last year
- Free Cash Flow was $1.53 billion, up from -$179.9 million in the same quarter last year
- Market Capitalization: $32.84 billion
Company Overview
From a single river cruise offering to a fleet of 96 vessels across multiple continents, Viking (NYSE:VIK) operates a fleet of small luxury cruise ships offering river, ocean, and expedition voyages focused on cultural enrichment and destination immersion.
Viking's business model centers on creating intimate travel experiences for a mature, culturally curious demographic. The company differentiates itself by deploying smaller vessels that can access ports unavailable to larger cruise ships, allowing guests more time in destinations. Its fleet consists of river vessels (including the innovative Longships), ocean ships, and specialized expedition vessels for remote locations like Antarctica and the Arctic.
The company's revenue comes primarily from cruise fares, which include accommodations, meals, guided excursions, and cultural enrichment programs. Viking's target market is predominantly North American travelers aged 55+, though the company has expanded to serve international markets, including a dedicated Mandarin-speaking operation in China through its Asia Outbound segment and China joint venture.
Viking's river cruises navigate iconic waterways like the Rhine, Danube, Seine, and Nile, docking in prime locations that larger vessels cannot access. A typical Viking river cruise might include a passenger disembarking just 800 meters from the Eiffel Tower in Paris or at the Karnak Temple in Luxor, Egypt. Ocean voyages focus on Northern Europe and the Mediterranean rather than the Caribbean-centric itineraries of larger cruise lines, while expedition cruises offer scientific exploration opportunities in remote polar regions.
4. Consumer Discretionary - Travel and Vacation Providers
The Consumer Discretionary sector, by definition, is made up of companies selling non-essential goods and services. When economic conditions deteriorate or tastes shift, consumers can easily cut back or eliminate these purchases. For long-term investors with five-year holding periods, this creates a structural challenge: the sector is inherently hit-driven, with low switching costs and fickle customers. As a result, only a handful of companies can reliably grow demand and compound earnings over long periods, which is why our bar is high and High Quality ratings are rare.
Travel and vacation providers operate tour packages, cruise lines, online travel agencies, and vacation rental platforms, connecting consumers with leisure and business travel experiences. Tailwinds include robust post-pandemic travel demand, a consumer preference shift toward experiences over goods, and technology-enabled personalization improving conversion and loyalty. However, headwinds are significant: the industry is acutely sensitive to macroeconomic cycles, geopolitical instability, and fuel price volatility. Low switching costs mean fierce price competition, while capacity additions in segments like cruises can lead to oversupply. Regulatory burdens, weather disruptions, and public health risks further create episodic but potentially severe demand shocks.
Viking competes with premium and luxury cruise operators including Oceania Cruises, Regent Seven Seas, Silversea, and Seabourn in the ocean segment, while river cruise competitors include AMA Waterways, Avalon Waterways, Uniworld, and Tauck. For expedition cruises, the company faces competition from Hurtigruten, Lindblad Expeditions, and Ponant.
5. Revenue Growth
A company’s top-line performance is one signal of its overall business quality. Strong growth can indicate it’s riding a successful new product or emerging trend. Viking’s annualized revenue growth rate of 17.5% over the last two years was weak for a consumer discretionary business.
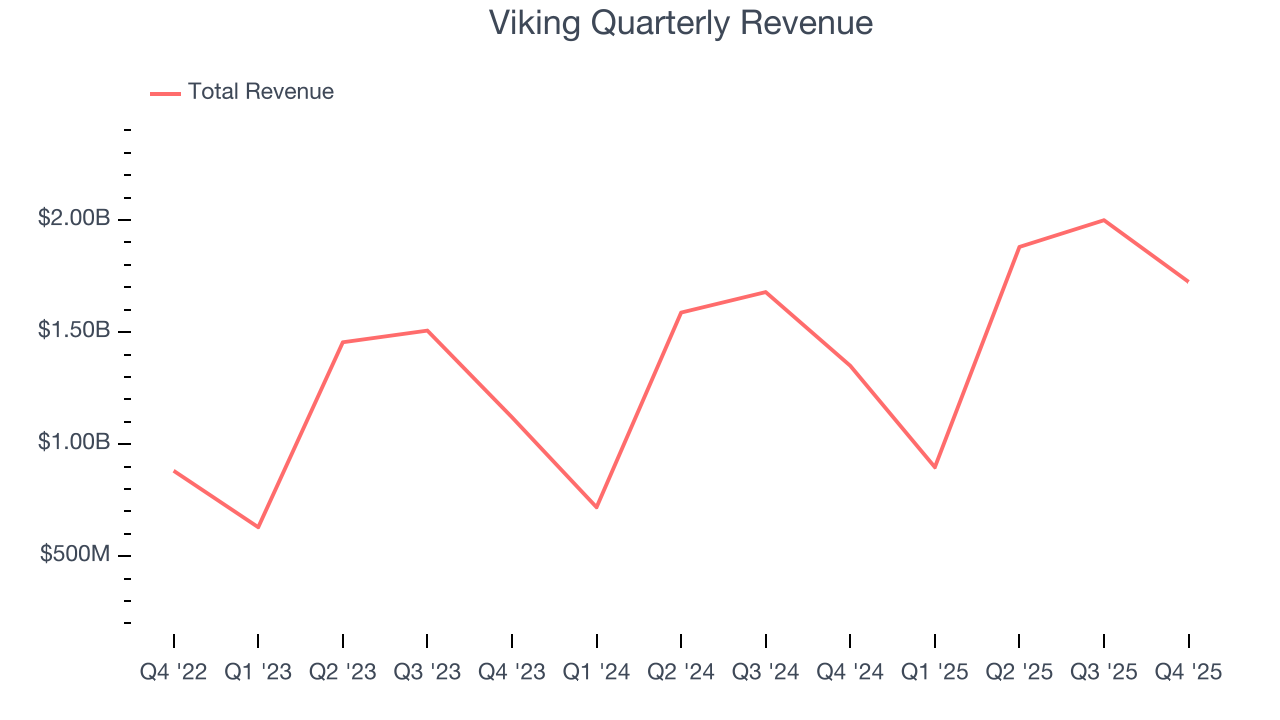
This quarter, Viking reported robust year-on-year revenue growth of 27.8%, and its $1.72 billion of revenue topped Wall Street estimates by 6.6%.
Looking ahead, sell-side analysts expect revenue to grow 12.7% over the next 12 months, a deceleration versus the last two years. Still, this projection is above the sector average and suggests the market is forecasting some success for its newer products and services.
6. Operating Margin
Viking’s operating margin has risen over the last 12 months and averaged 21.8% over the last two years. The company’s higher efficiency is a breath of fresh air, but its suboptimal cost structure means it still sports lousy profitability for a consumer discretionary business.
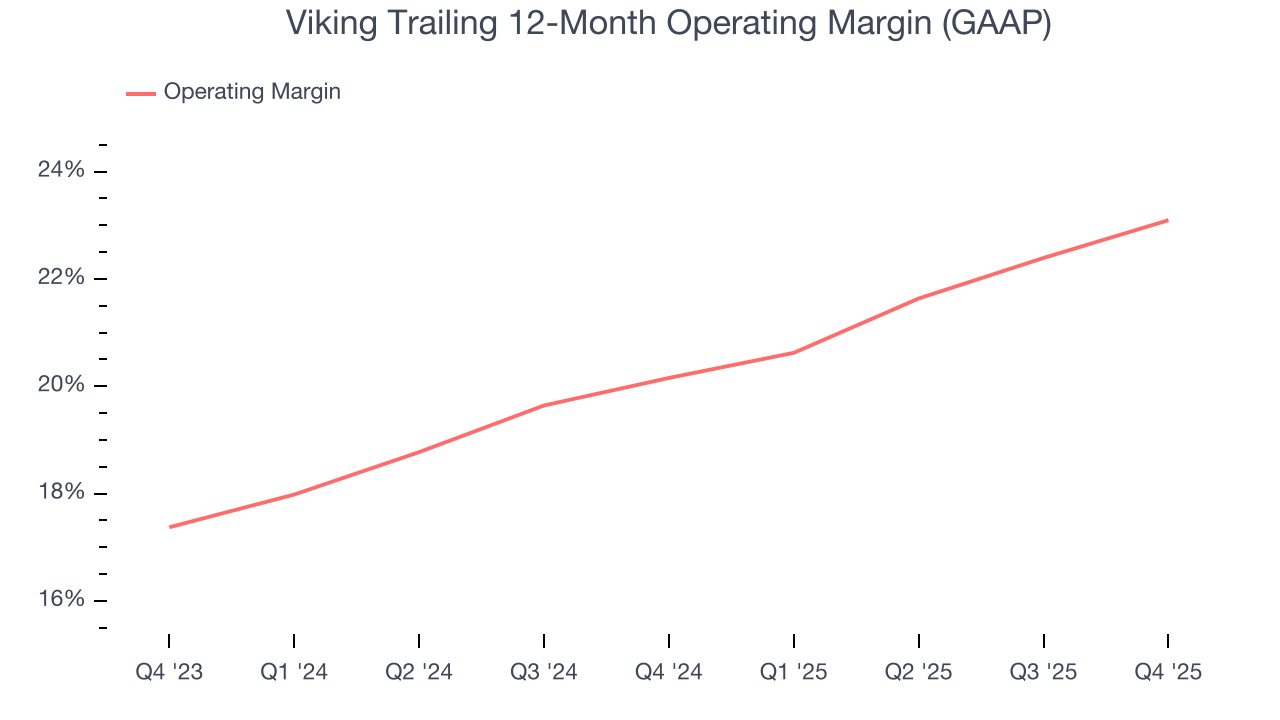
This quarter, Viking generated an operating margin profit margin of 20.9%, up 3.8 percentage points year on year. This increase was a welcome development and shows it was more efficient.
7. Cash Is King
If you’ve followed StockStory for a while, you know we emphasize free cash flow. Why, you ask? We believe that in the end, cash is king, and you can’t use accounting profits to pay the bills.
Viking has shown weak cash profitability over the last two years, giving the company limited opportunities to return capital to shareholders. Its free cash flow margin averaged 30%, subpar for a consumer discretionary business.
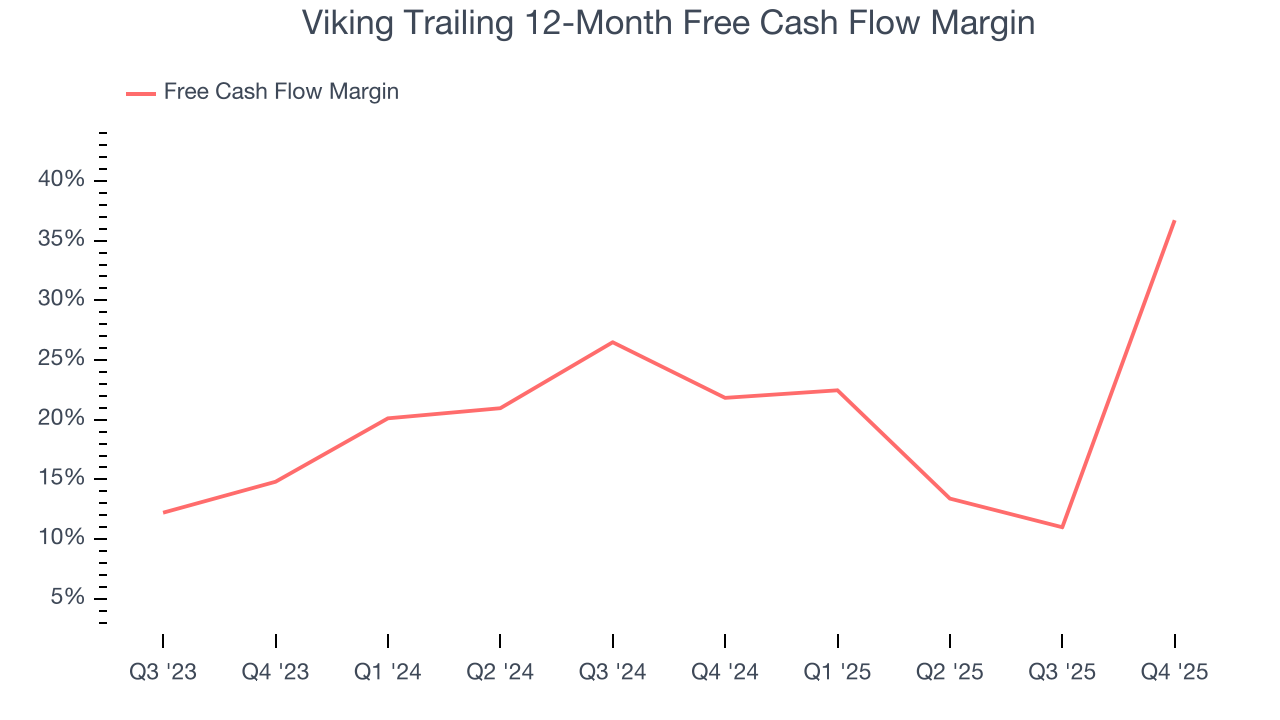
Viking’s free cash flow clocked in at $1.53 billion in Q4, equivalent to a 88.9% margin. Its cash flow turned positive after being negative in the same quarter last year, but we wouldn’t put too much weight on the short term because investment needs can be seasonal, causing temporary swings. Long-term trends are more important.
Over the next year, analysts predict Viking’s cash conversion will fall. Their consensus estimates imply its free cash flow margin of 36.7% for the last 12 months will decrease to 25.9%.
8. Balance Sheet Assessment
Viking reported $3.8 billion of cash and $5.74 billion of debt on its balance sheet in the most recent quarter. As investors in high-quality companies, we primarily focus on two things: 1) that a company’s debt level isn’t too high and 2) that its interest payments are not excessively burdening the business.
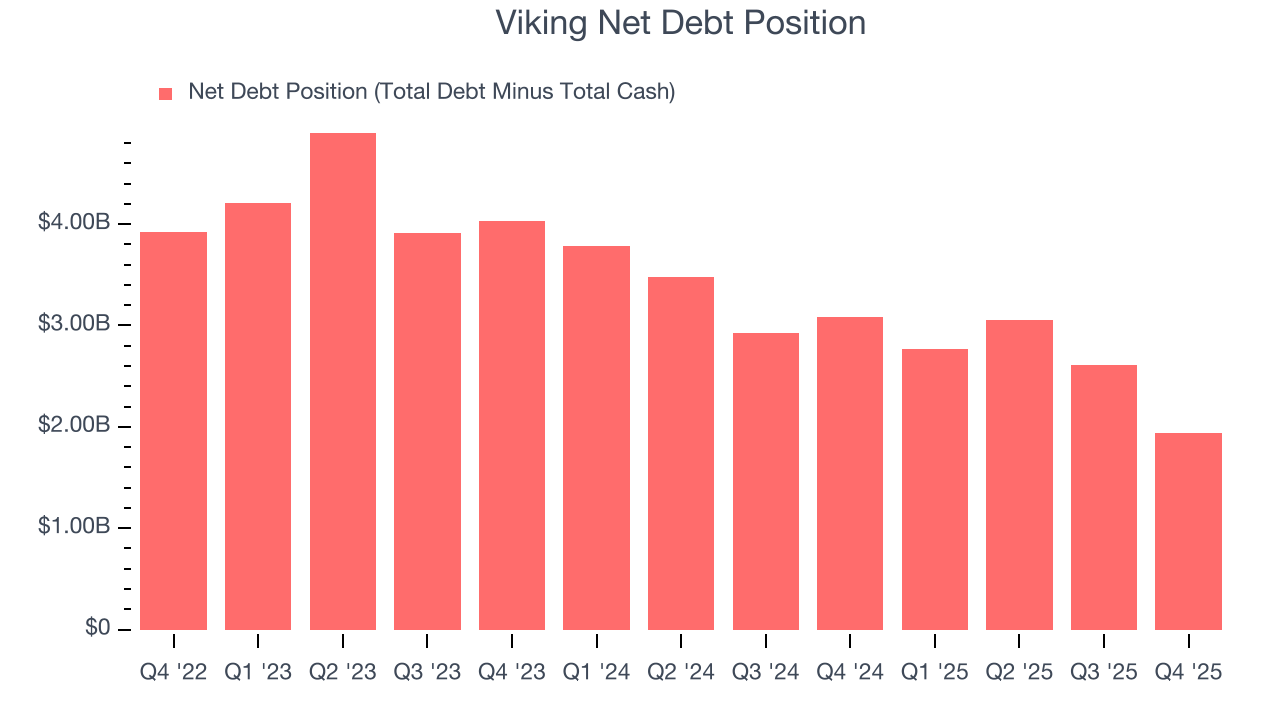
With $1.87 billion of EBITDA over the last 12 months, we view Viking’s 1.0× net-debt-to-EBITDA ratio as safe. We also see its $27.51 billion of annual interest expenses as appropriate. The company’s profits give it plenty of breathing room, allowing it to continue investing in growth initiatives.
9. Key Takeaways from Viking’s Q4 Results
We enjoyed seeing Viking beat analysts’ revenue expectations this quarter. We were also glad its EPS outperformed Wall Street’s estimates. Zooming out, we think this was a good print with some key areas of upside. The stock traded up 2.4% to $75.84 immediately after reporting.
10. Is Now The Time To Buy Viking?
Updated: March 30, 2026 at 12:40 AM EDT
Before making an investment decision, investors should account for Viking’s business fundamentals and valuation in addition to what happened in the latest quarter.
Viking doesn’t pass our quality test. The company’s operating margins reveal poor profitability compared to other consumer discretionary companies, and its low free cash flow margins give it little breathing room.
Viking’s P/E ratio based on the next 12 months is 21.6x. This valuation tells us it’s a bit of a market darling with a lot of good news priced in - we think other companies feature superior fundamentals at the moment.
Wall Street analysts have a consensus one-year price target of $82.50 on the company (compared to the current share price of $67.78).
Although the price target is bullish, readers should exercise caution because analysts tend to be overly optimistic. The firms they work for, often big banks, have relationships with companies that extend into fundraising, M&A advisory, and other rewarding business lines. As a result, they typically hesitate to say bad things for fear they will lose out. We at StockStory do not suffer from such conflicts of interest, so we’ll always tell it like it is.