
Douglas Dynamics (PLOW)
Douglas Dynamics faces an uphill battle. Its weak sales growth and declining returns on capital show its demand and profits are shrinking.― StockStory Analyst Team
1. News

2. Summary
Why We Think Douglas Dynamics Will Underperform
Once manufacturing snowplows designed for the iconic jeep vehicle precursor, Douglas Dynamics (NYSE:PLOW) offers snow and ice equipment for the roads and sidewalks.
- Products and services are facing end-market challenges during this cycle, as seen in its flat sales over the last two years
- Performance over the past five years shows its incremental sales were much less profitable, as its earnings per share fell by 2.4% annually
- Gross margin of 25.5% is below its competitors, leaving less money to invest in areas like marketing and R&D


Douglas Dynamics falls short of our quality standards. We’d search for superior opportunities elsewhere.
Why There Are Better Opportunities Than Douglas Dynamics


Douglas Dynamics’s stock price of $29.25 implies a valuation ratio of 15.2x forward P/E. Douglas Dynamics’s multiple may seem like a great deal among industrials peers, but we think there are valid reasons why it’s this cheap.
Cheap stocks can look like a great deal at first glance, but they can be value traps. They often have less earnings power, meaning there is more reliance on a re-rating to generate good returns - an unlikely scenario for low-quality companies.
3. Douglas Dynamics (PLOW) Research Report: Q1 CY2025 Update
Snow and ice equipment company Douglas Dynamics (NYSE:PLOW) reported Q1 CY2025 results beating Wall Street’s revenue expectations, with sales up 20.3% year on year to $115.1 million. Its non-GAAP profit of $0.09 per share was significantly above analysts’ consensus estimates.
Douglas Dynamics (PLOW) Q1 CY2025 Highlights:
- Revenue: $115.1 million vs analyst estimates of $107.8 million (20.3% year-on-year growth, 6.7% beat)
- Adjusted EPS: $0.09 vs analyst estimates of -$0.01 (significant beat)
- Adjusted EBITDA: $7.63 million vs analyst estimates of $4.7 million (6.6% margin, 62.2% beat)
- Operating Margin: 2.8%, up from -5.4% in the same quarter last year
- Free Cash Flow was -$3.50 million compared to -$22.95 million in the same quarter last year
- Market Capitalization: $589 million
Company Overview
Once manufacturing snowplows designed for the iconic jeep vehicle precursor, Douglas Dynamics (NYSE:PLOW) offers snow and ice equipment for the roads and sidewalks.
Douglas Dynamics was founded in 1977 and began as a manufacturer of vehicle attachments and equipment. The company has significantly grown through acquisitions that have enabled it to enter new markets and expand from its original singular offering. For example, the $206 million acquisition of Dejana Truck & Utility Equipment in 2016 enabled it to offer custom upfitting services which reduced its dependency on seasonal weather patterns by diversifying its product offerings and expanding into year-round markets.
Douglas Dynamics specializes in producing equipment designed to manage snow on roads and sidewalks. Specifically, the company offers snowplows used to clear snow from roads and driveways as well as salt and sand spreaders which help to manage ice on roads and walkways. It does not provide the service of clearing snow, rather, it only provides the equipment needed.
Beyond its core offerings, the company also offers truck and utility vehicle attachments (dump bodies and service bodies to carry heavy things), material spreaders for landscaping and agricultural applications, and custom upfitting services for commercial vehicles. For example, some of its custom upfitting services include installing storage units such as toolboxes and shelving or adding equipment like cranes and lift gates to utility trucks.
It sells its products through direct sales and long-term contracts. These contracts typically span three to five years and often include service agreements for maintenance and support, ensuring the equipment stays in great condition.
4. Heavy Transportation Equipment
Heavy transportation equipment companies are investing in automated vehicles that increase efficiencies and connected machinery that collects actionable data. Some are also developing electric vehicles and mobility solutions to address customers’ concerns about carbon emissions, creating new sales opportunities. Additionally, they are increasingly offering automated equipment that increases efficiencies and connected machinery that collects actionable data. On the other hand, heavy transportation equipment companies are at the whim of economic cycles. Interest rates, for example, can greatly impact the construction and transport volumes that drive demand for these companies’ offerings.
Competitors offering similar products include Caterpillar (NYSE:CAT), Toro (NYSE:TTC), and Alamo (NYSE:ALG).
5. Sales Growth
Examining a company’s long-term performance can provide clues about its quality. Any business can experience short-term success, but top-performing ones enjoy sustained growth for years. Unfortunately, Douglas Dynamics’s 1.5% annualized revenue growth over the last five years was weak. This fell short of our benchmarks and is a tough starting point for our analysis.
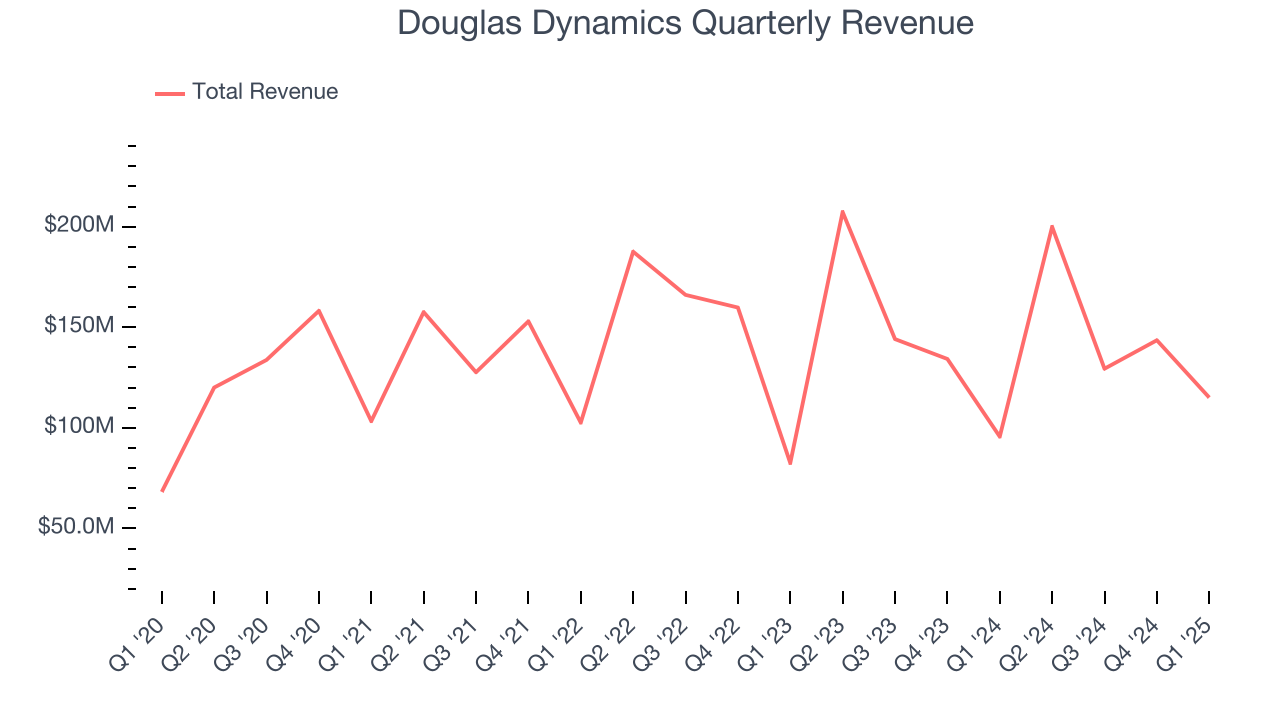
We at StockStory place the most emphasis on long-term growth, but within industrials, a half-decade historical view may miss cycles, industry trends, or a company capitalizing on catalysts such as a new contract win or a successful product line. Douglas Dynamics’s recent performance shows its demand has slowed as its revenue was flat over the last two years. 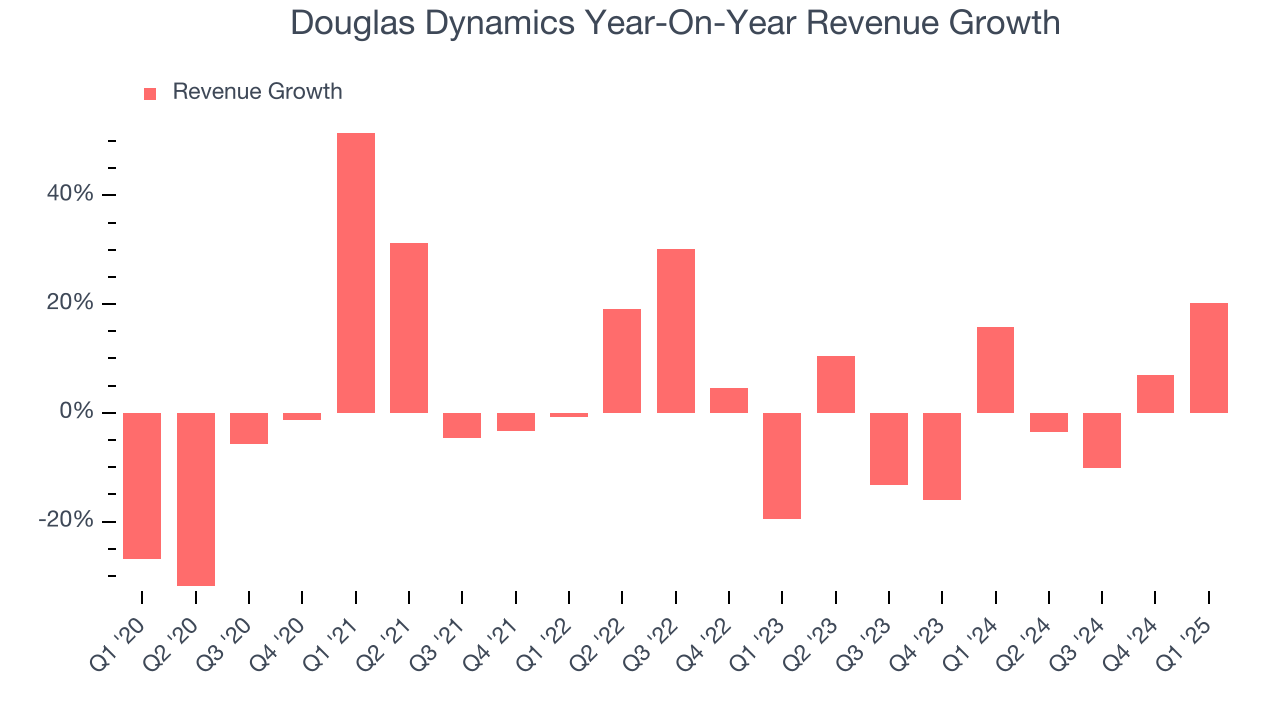
This quarter, Douglas Dynamics reported robust year-on-year revenue growth of 20.3%, and its $115.1 million of revenue topped Wall Street estimates by 6.7%.
Looking ahead, sell-side analysts expect revenue to grow 8.3% over the next 12 months, an improvement versus the last two years. This projection is above the sector average and suggests its newer products and services will catalyze better top-line performance.
6. Gross Margin & Pricing Power
Douglas Dynamics has bad unit economics for an industrials company, giving it less room to reinvest and develop new offerings. As you can see below, it averaged a 25.5% gross margin over the last five years. Said differently, Douglas Dynamics had to pay a chunky $74.46 to its suppliers for every $100 in revenue. 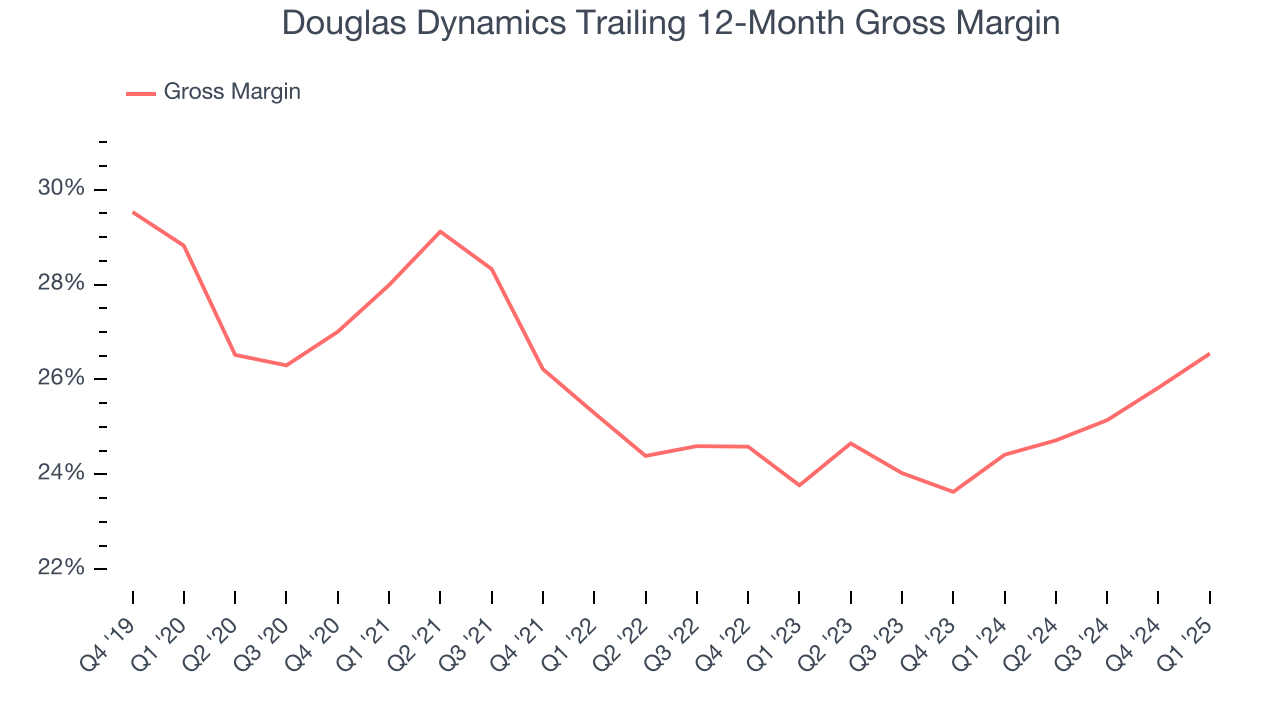
Douglas Dynamics’s gross profit margin came in at 24.5% this quarter, up 4.7 percentage points year on year. Douglas Dynamics’s full-year margin has also been trending up over the past 12 months, increasing by 2.1 percentage points. If this move continues, it could suggest better unit economics due to more leverage from its growing sales on the fixed portion of its cost of goods sold (such as manufacturing expenses).
7. Operating Margin
Douglas Dynamics has done a decent job managing its cost base over the last five years. The company has produced an average operating margin of 9.5%, higher than the broader industrials sector.
Analyzing the trend in its profitability, Douglas Dynamics’s operating margin decreased by 2.9 percentage points over the last five years. This raises questions about the company’s expense base because its revenue growth should have given it leverage on its fixed costs, resulting in better economies of scale and profitability.
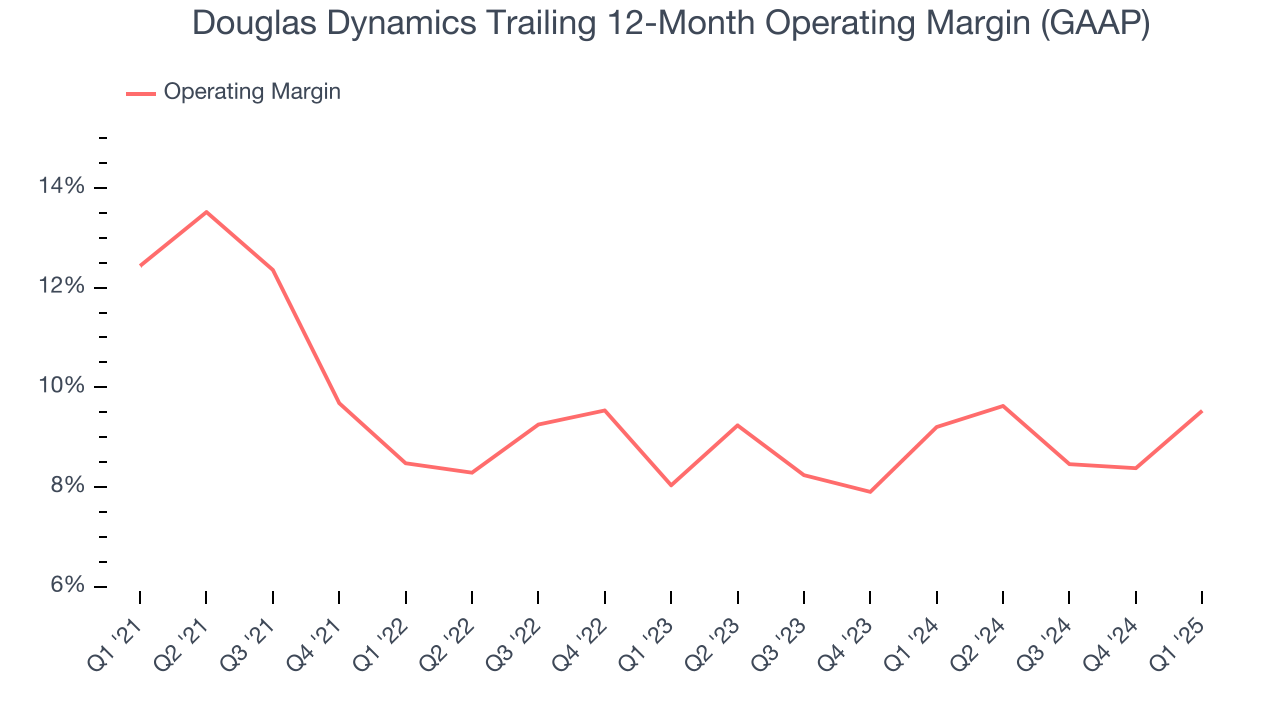
In Q1, Douglas Dynamics generated an operating profit margin of 2.8%, up 8.2 percentage points year on year. The increase was solid, and because its operating margin rose more than its gross margin, we can infer it was more efficient with expenses such as marketing, R&D, and administrative overhead.
8. Earnings Per Share
We track the long-term change in earnings per share (EPS) for the same reason as long-term revenue growth. Compared to revenue, however, EPS highlights whether a company’s growth is profitable.
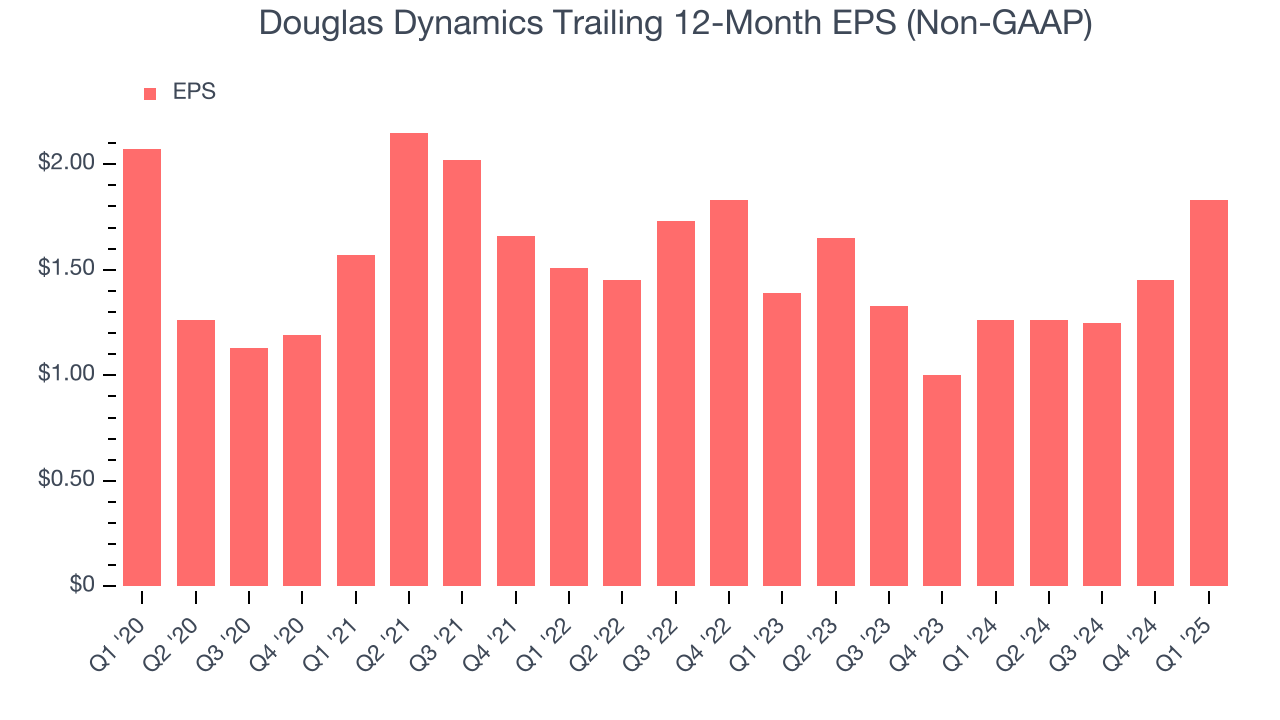
Sadly for Douglas Dynamics, its EPS declined by 2.4% annually over the last five years while its revenue grew by 1.5%. This tells us the company became less profitable on a per-share basis as it expanded.
Diving into the nuances of Douglas Dynamics’s earnings can give us a better understanding of its performance. As we mentioned earlier, Douglas Dynamics’s operating margin improved this quarter but declined by 2.9 percentage points over the last five years. Its share count also grew by 1.4%, meaning the company not only became less efficient with its operating expenses but also diluted its shareholders. 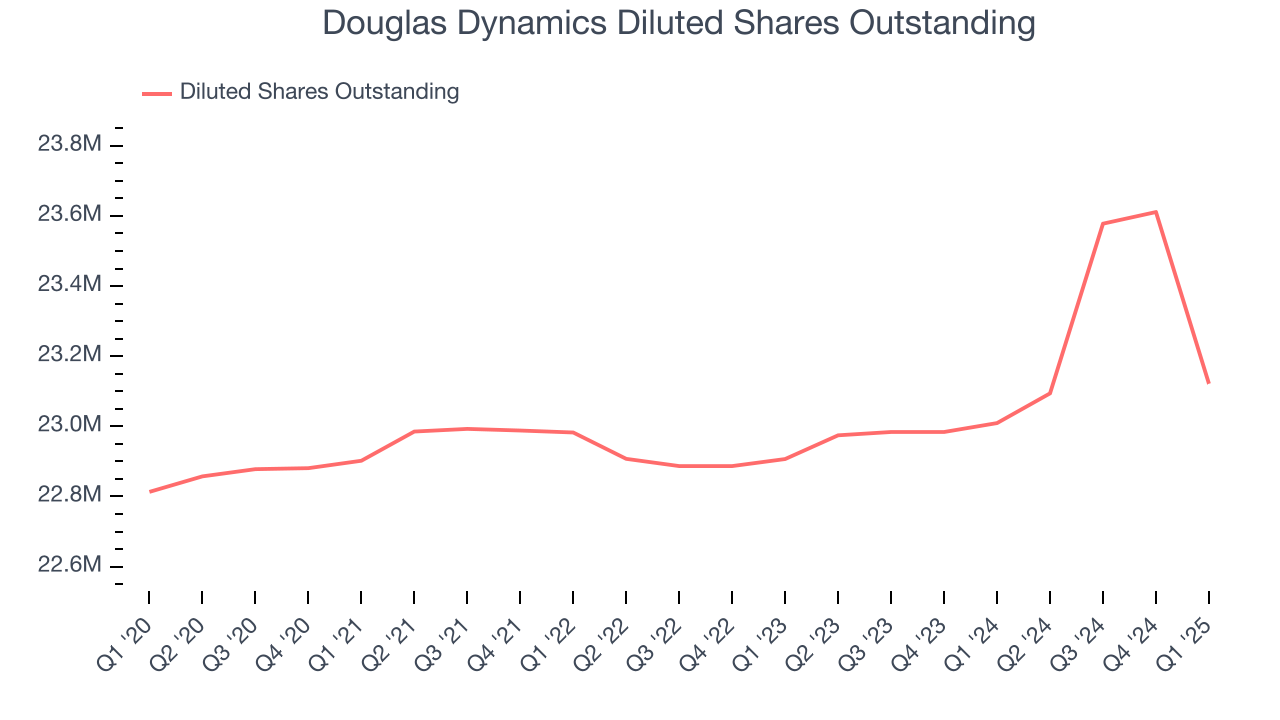
Like with revenue, we analyze EPS over a shorter period to see if we are missing a change in the business.
For Douglas Dynamics, its two-year annual EPS growth of 14.7% was higher than its five-year trend. This acceleration made it one of the faster-growing industrials companies in recent history.
In Q1, Douglas Dynamics reported EPS at $0.09, up from negative $0.29 in the same quarter last year. This print easily cleared analysts’ estimates, and shareholders should be content with the results. Over the next 12 months, Wall Street expects Douglas Dynamics’s full-year EPS of $1.83 to grow 5.5%.
9. Cash Is King
Free cash flow isn't a prominently featured metric in company financials and earnings releases, but we think it's telling because it accounts for all operating and capital expenses, making it tough to manipulate. Cash is king.
Douglas Dynamics has shown mediocre cash profitability over the last five years, giving the company limited opportunities to return capital to shareholders. Its free cash flow margin averaged 5.6%, subpar for an industrials business.
Taking a step back, we can see that Douglas Dynamics’s margin dropped by 5 percentage points during that time. It may have ticked higher more recently, but shareholders are likely hoping for its margin to at least revert to its historical level. Almost any movement in the wrong direction is undesirable because of its relatively low cash conversion. If the longer-term trend returns, it could signal it’s becoming a more capital-intensive business.
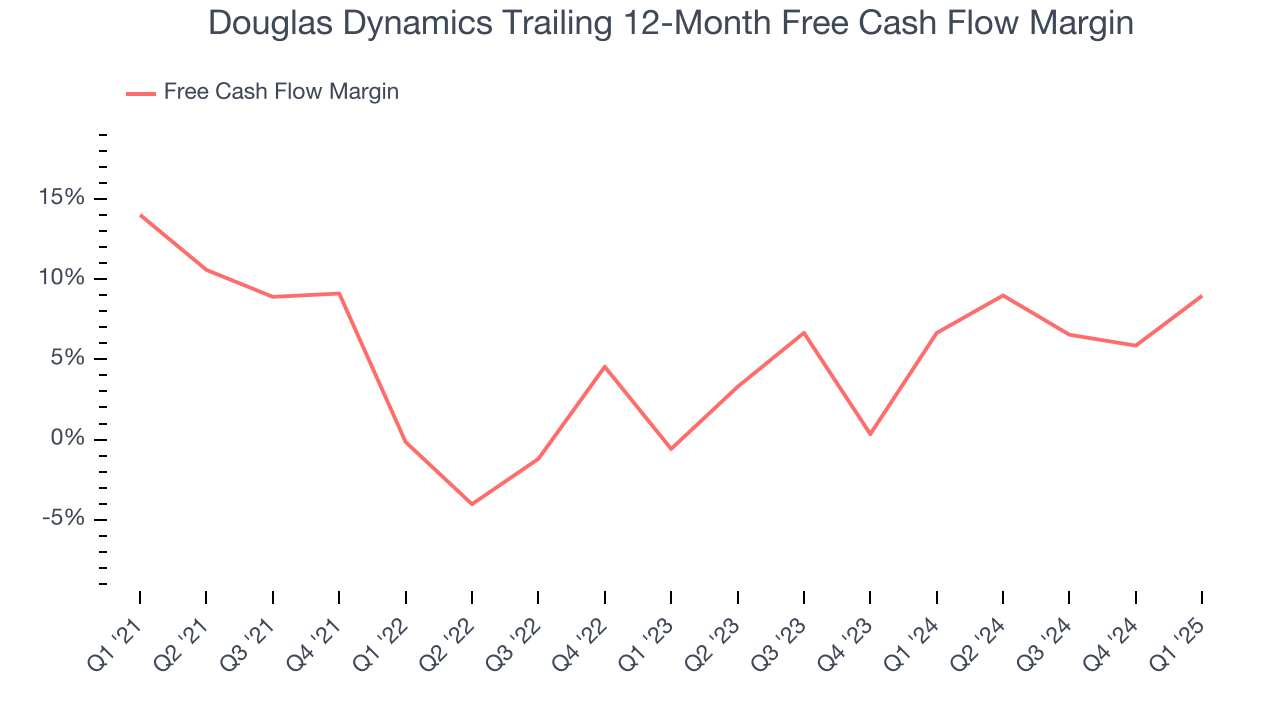
Douglas Dynamics burned through $3.50 million of cash in Q1, equivalent to a negative 3% margin. The company’s cash burn was similar to its $22.95 million of lost cash in the same quarter last year. These numbers deviate from its longer-term margin, indicating it is a seasonal business that must build up inventory during certain quarters.
10. Return on Invested Capital (ROIC)
EPS and free cash flow tell us whether a company was profitable while growing its revenue. But was it capital-efficient? A company’s ROIC explains this by showing how much operating profit it makes compared to the money it has raised (debt and equity).
Douglas Dynamics’s management team makes decent investment decisions and generates value for shareholders. Its five-year average ROIC was 10.6%, slightly better than typical industrials business.
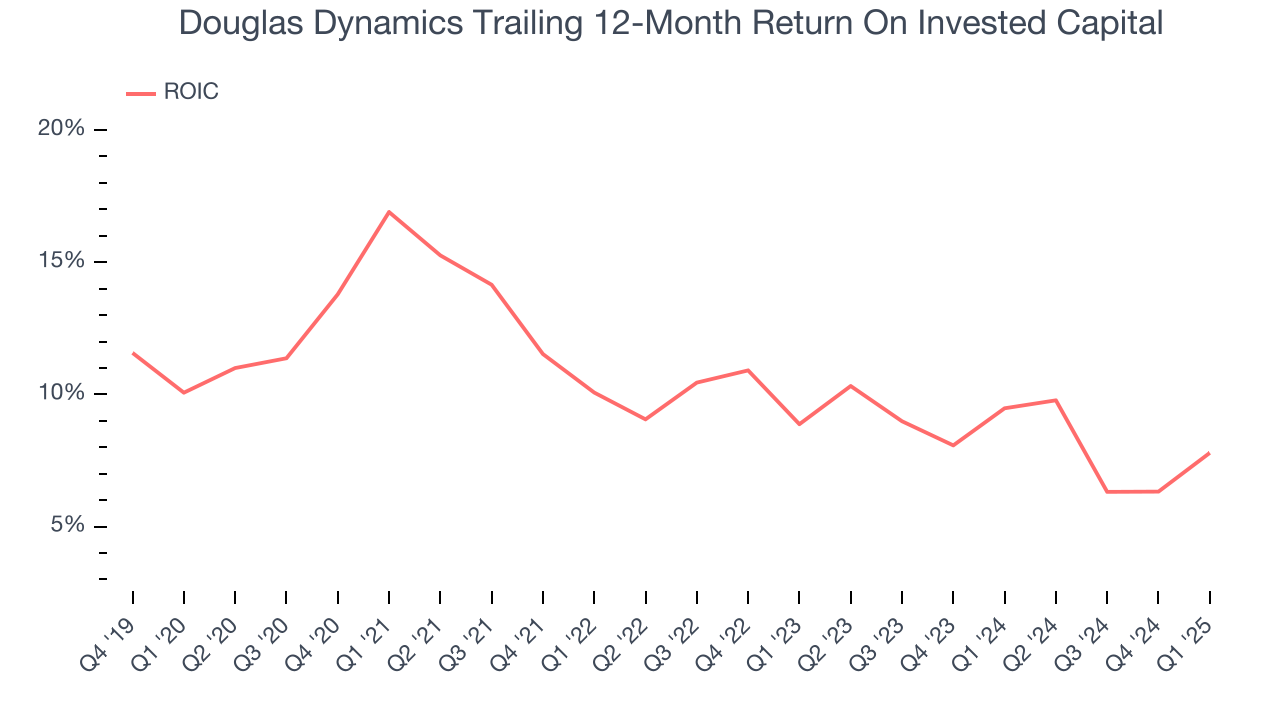
We like to invest in businesses with high returns, but the trend in a company’s ROIC is what often surprises the market and moves the stock price. Over the last few years, Douglas Dynamics’s ROIC averaged 4.9 percentage point decreases each year. We like what management has done in the past, but its declining returns are perhaps a symptom of fewer profitable growth opportunities.
11. Balance Sheet Assessment
Douglas Dynamics reported $7.21 million of cash and $180.8 million of debt on its balance sheet in the most recent quarter. As investors in high-quality companies, we primarily focus on two things: 1) that a company’s debt level isn’t too high and 2) that its interest payments are not excessively burdening the business.
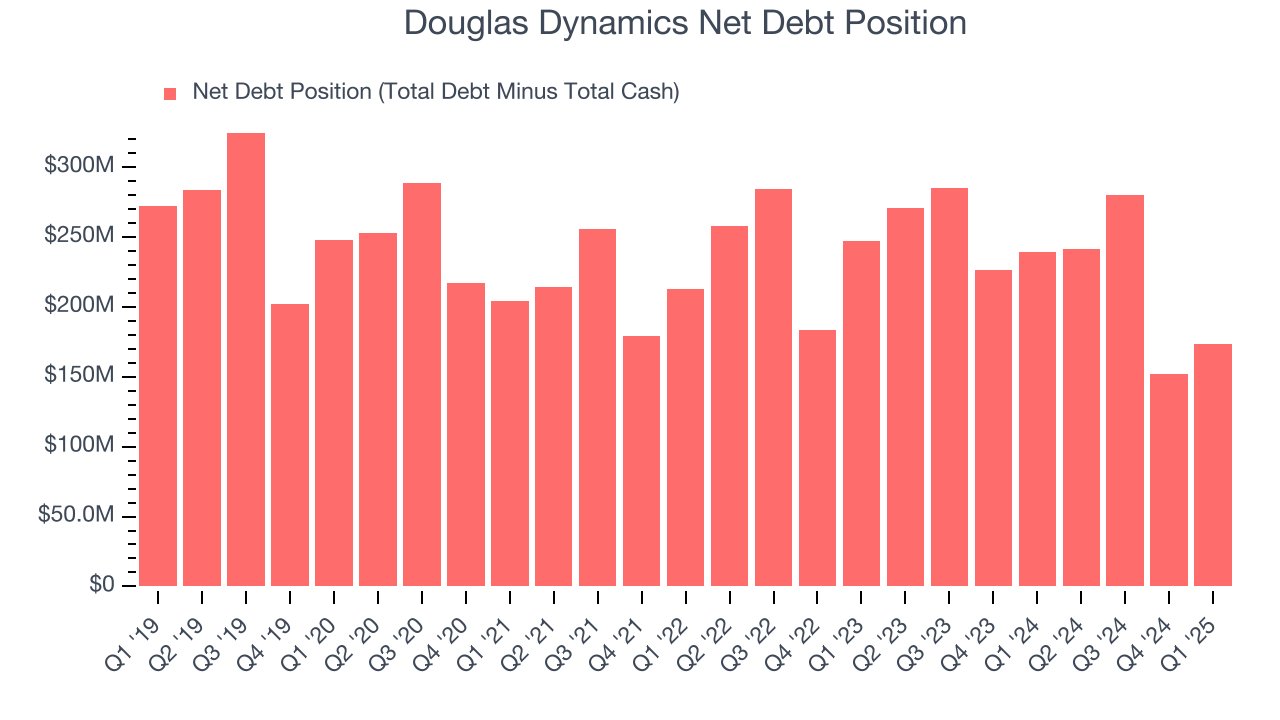
With $70.23 million of EBITDA over the last 12 months, we view Douglas Dynamics’s 2.5× net-debt-to-EBITDA ratio as safe. We also see its $14.12 million of annual interest expenses as appropriate. The company’s profits give it plenty of breathing room, allowing it to continue investing in growth initiatives.
12. Key Takeaways from Douglas Dynamics’s Q1 Results
We were impressed by how significantly Douglas Dynamics blew past analysts’ EPS expectations this quarter. We were also excited its EBITDA outperformed Wall Street’s estimates by a wide margin. Zooming out, we think this was a solid print. The stock remained flat at $25.50 immediately after reporting.
13. Is Now The Time To Buy Douglas Dynamics?
Updated: May 15, 2025 at 11:28 PM EDT
The latest quarterly earnings matters, sure, but we actually think longer-term fundamentals and valuation matter more. Investors should consider all these pieces before deciding whether or not to invest in Douglas Dynamics.
We see the value of companies helping their customers, but in the case of Douglas Dynamics, we’re out. To begin with, its revenue growth was weak over the last five years. And while its operating margins are in line with the overall industrials sector, the downside is its declining EPS over the last five years makes it a less attractive asset to the public markets. On top of that, its cash profitability fell over the last five years.
Douglas Dynamics’s P/E ratio based on the next 12 months is 15.2x. While this valuation is reasonable, we don’t see a big opportunity at the moment. There are superior stocks to buy right now.
Wall Street analysts have a consensus one-year price target of $33.67 on the company (compared to the current share price of $29.25).
Although the price target is bullish, readers should exercise caution because analysts tend to be overly optimistic. The firms they work for, often big banks, have relationships with companies that extend into fundraising, M&A advisory, and other rewarding business lines. As a result, they typically hesitate to say bad things for fear they will lose out. We at StockStory do not suffer from such conflicts of interest, so we’ll always tell it like it is.
Want to invest in a High Quality big tech company? We’d point you in the direction of Microsoft and Google, which have durable competitive moats and strong fundamentals, factors that are large determinants of long-term market outperformance.
To get the best start with StockStory, check out our most recent stock picks, and then sign up for our earnings alerts by adding companies to your watchlist. We typically have quarterly earnings results analyzed within seconds of the data being released, giving investors the chance to react before the market has fully absorbed the information. This is especially true for companies reporting pre-market.