
Royal Caribbean (RCL)
Royal Caribbean is in for a bumpy ride. Its underwhelming returns on capital show it struggled to generate meaningful profits for shareholders.― StockStory Analyst Team
1. News


2. Summary
Why We Think Royal Caribbean Will Underperform
Established in 1968, Royal Caribbean Cruises (NYSE:RCL) is a global cruise vacation company renowned for its innovative and exciting cruise experiences.
- Scale is a double-edged sword because it limits the company’s growth potential compared to its smaller competitors, as reflected in its below-average annual revenue increases of 13.6% for the last two years
- Low free cash flow margin gives it little breathing room, constraining its ability to self-fund growth or return capital to shareholders
- Below-average returns on capital indicate management struggled to find compelling investment opportunities


Royal Caribbean doesn’t meet our quality standards. More profitable opportunities exist elsewhere.
Why There Are Better Opportunities Than Royal Caribbean


Royal Caribbean is trading at $273.26 per share, or 14.9x forward P/E. This multiple is lower than most consumer discretionary companies, but for good reason.
We’d rather pay up for companies with elite fundamentals than get a bargain on weak ones. Cheap stocks can be value traps, and as their performance deteriorates, they will stay cheap or get even cheaper.
3. Royal Caribbean (RCL) Research Report: Q4 CY2025 Update
Cruise vacation company Royal Caribbean (NYSE:RCL) met Wall Streets revenue expectations in Q4 CY2025, with sales up 13.3% year on year to $4.26 billion. Its non-GAAP profit of $2.80 per share was in line with analysts’ consensus estimates.
Royal Caribbean (RCL) Q4 CY2025 Highlights:
- Revenue: $4.26 billion vs analyst estimates of $4.26 billion (13.3% year-on-year growth, in line)
- Adjusted EPS: $2.80 vs analyst estimates of $2.80 (in line)
- Adjusted EBITDA: $1.48 billion vs analyst estimates of $1.45 billion (34.8% margin, 2.1% beat)
- Adjusted EPS guidance for the upcoming financial year 2026 is $17.90 at the midpoint, beating analyst estimates by 1.3%
- Operating Margin: 21.9%, up from 16.6% in the same quarter last year
- Free Cash Flow Margin: 2.7%, down from 24.3% in the same quarter last year
- Passenger Cruise Days: 15.12 million, up 1.44 million year on year
- Market Capitalization: $79.52 billion
Company Overview
Established in 1968, Royal Caribbean Cruises (NYSE:RCL) is a global cruise vacation company renowned for its innovative and exciting cruise experiences.
With a fleet of more than 60 ships, Royal Caribbean offers a wide array of itineraries to destinations including the Caribbean, Alaska, Europe, South America, Asia, and Australia. The company operates through its various brands, most notably Royal Caribbean International, Celebrity Cruises, and Silversea Cruises.
Royal Caribbean International holds mega-ships and is known for features like robotic bartenders, massive water slides, skydiving simulators, and virtual balconies. Celebrity Cruises offers a more upscale and intimate experience, with an emphasis on fine dining, sophisticated ambiance, and exotic destinations. Silversea Cruises, acquired in 2018, extends Royal Caribbean's reach into the ultra-luxury and expedition cruise sectors.
The company has introduced many firsts at sea, including the first rock-climbing walls, ice-skating rinks, and the 360-degree Promenade on its ships, enhancing the onboard experience for guests. Most of Royal Caribbean's revenues are generated from passenger ticket sales. The balance comes from casino operations as well as onboard sales of food, beverage, retail shopping, and entertainment offerings like land excursions at port destinations.
4. Travel and Vacation Providers
Airlines, hotels, resorts, and cruise line companies often sell experiences rather than tangible products, and in the last decade-plus, consumers have slowly shifted from buying "things" (wasteful) to buying "experiences" (memorable). In addition, the internet has introduced new ways of approaching leisure and lodging such as booking homes and longer-term accommodations. Traditional airlines, hotel, resorts, and cruise line companies must innovate to stay relevant in a market rife with innovation.
Royal Caribbean's primary competitors include Carnival (NYSE:CCL), Norwegian Cruise Line (NYSE:NCLH), Disney Cruise Line (owned by Disney NYSE:DIS), and private companies Viking Cruises and MSC Cruises.
5. Revenue Growth
A company’s long-term performance is an indicator of its overall quality. Any business can put up a good quarter or two, but many enduring ones grow for years. Over the last five years, Royal Caribbean grew its sales at an impressive 52% compounded annual growth rate. Its growth beat the average consumer discretionary company and shows its offerings resonate with customers.
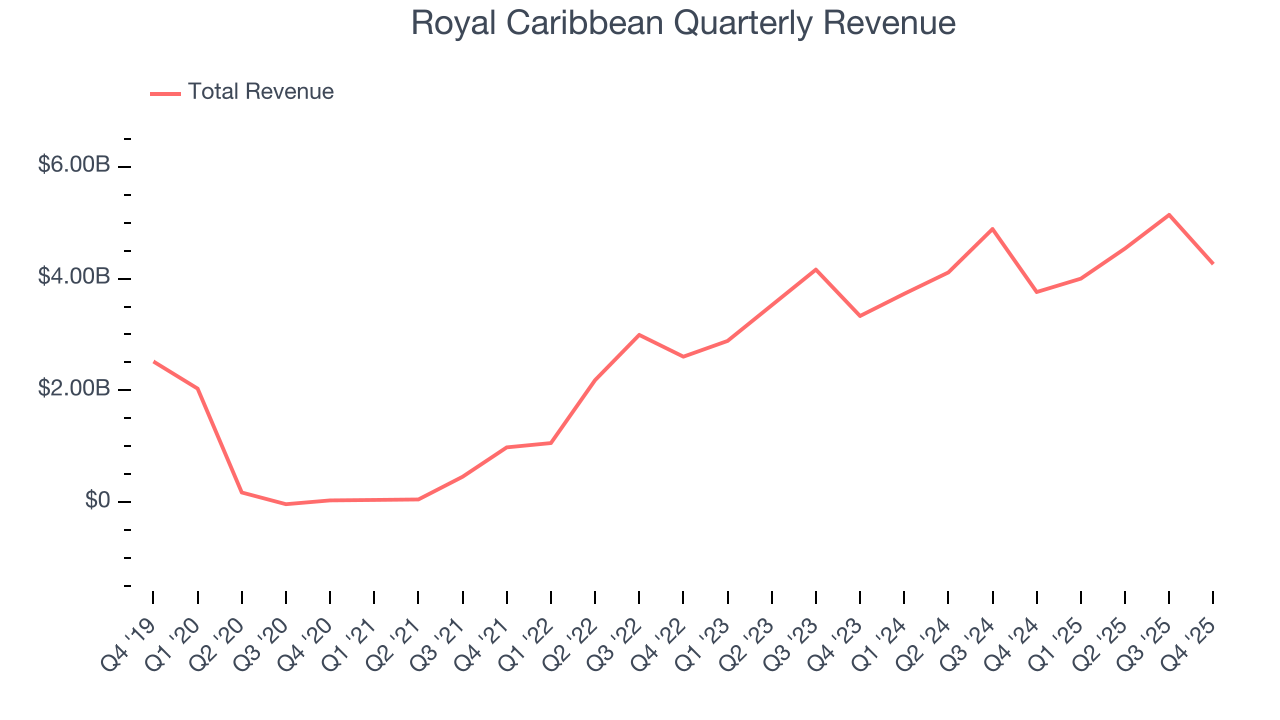
We at StockStory place the most emphasis on long-term growth, but within consumer discretionary, a stretched historical view may miss a company riding a successful new property or trend. Royal Caribbean’s recent performance shows its demand has slowed significantly as its annualized revenue growth of 13.6% over the last two years was well below its five-year trend. 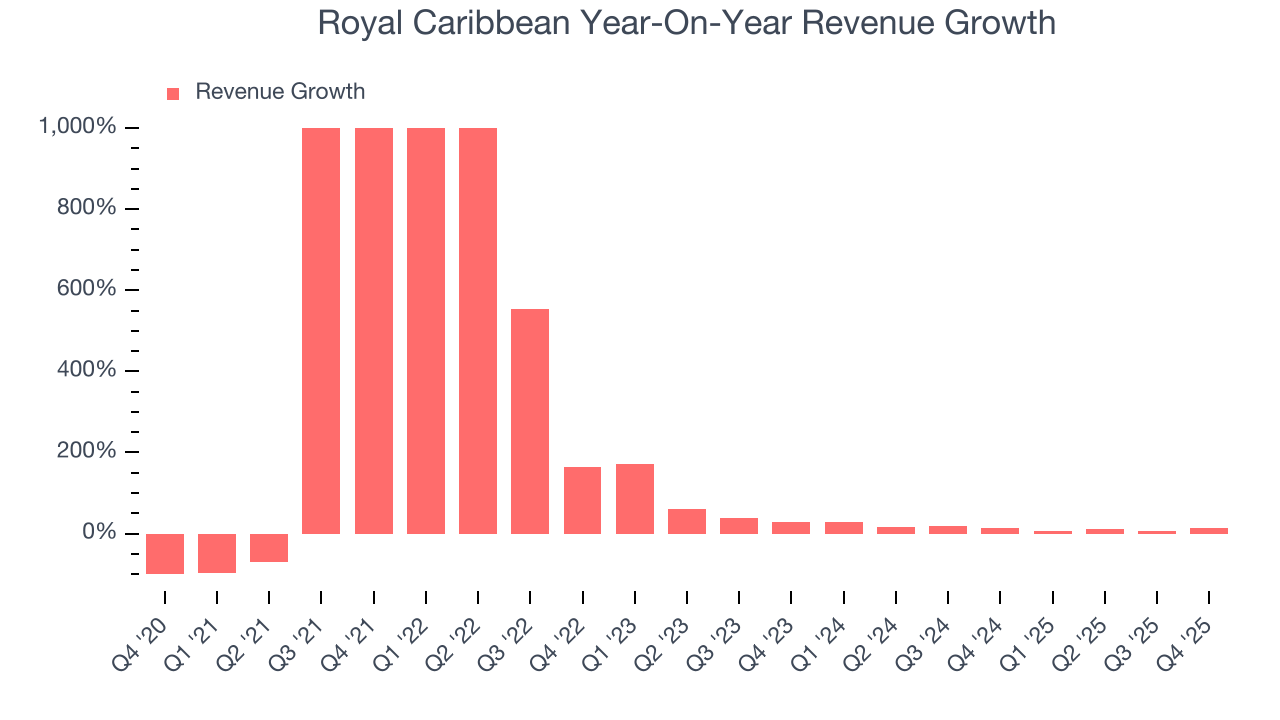
We can dig further into the company’s revenue dynamics by analyzing its number of passenger cruise days, which reached 15.12 million in the latest quarter. Over the last two years, Royal Caribbean’s passenger cruise days averaged 8.7% year-on-year growth. Because this number is lower than its revenue growth during the same period, we can see the company’s monetization has risen. 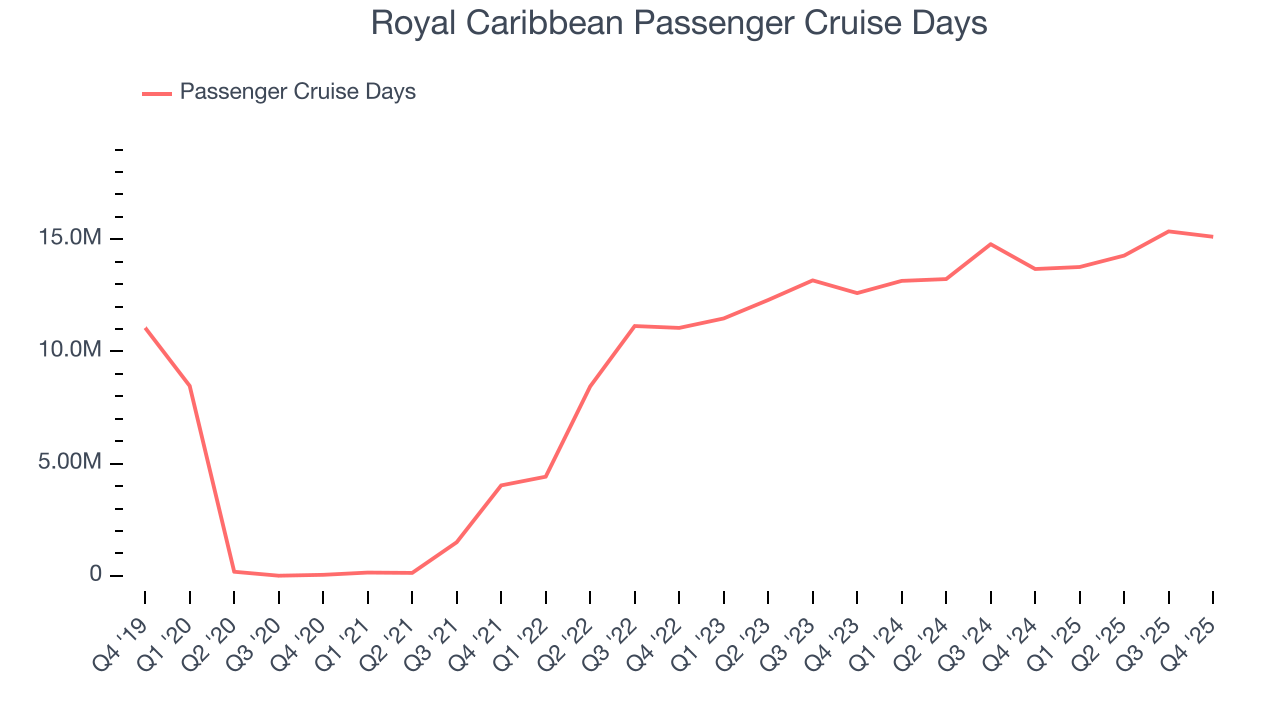
This quarter, Royal Caribbean’s year-on-year revenue growth was 13.3%, and its $4.26 billion of revenue was in line with Wall Street’s estimates.
Looking ahead, sell-side analysts expect revenue to grow 8.9% over the next 12 months, a deceleration versus the last two years. This projection is underwhelming and indicates its products and services will face some demand challenges.
6. Operating Margin
Royal Caribbean’s operating margin has been trending up over the last 12 months and averaged 26.2% over the last two years. The company’s higher efficiency is a breath of fresh air, but its suboptimal cost structure means it still sports lousy profitability for a consumer discretionary business.
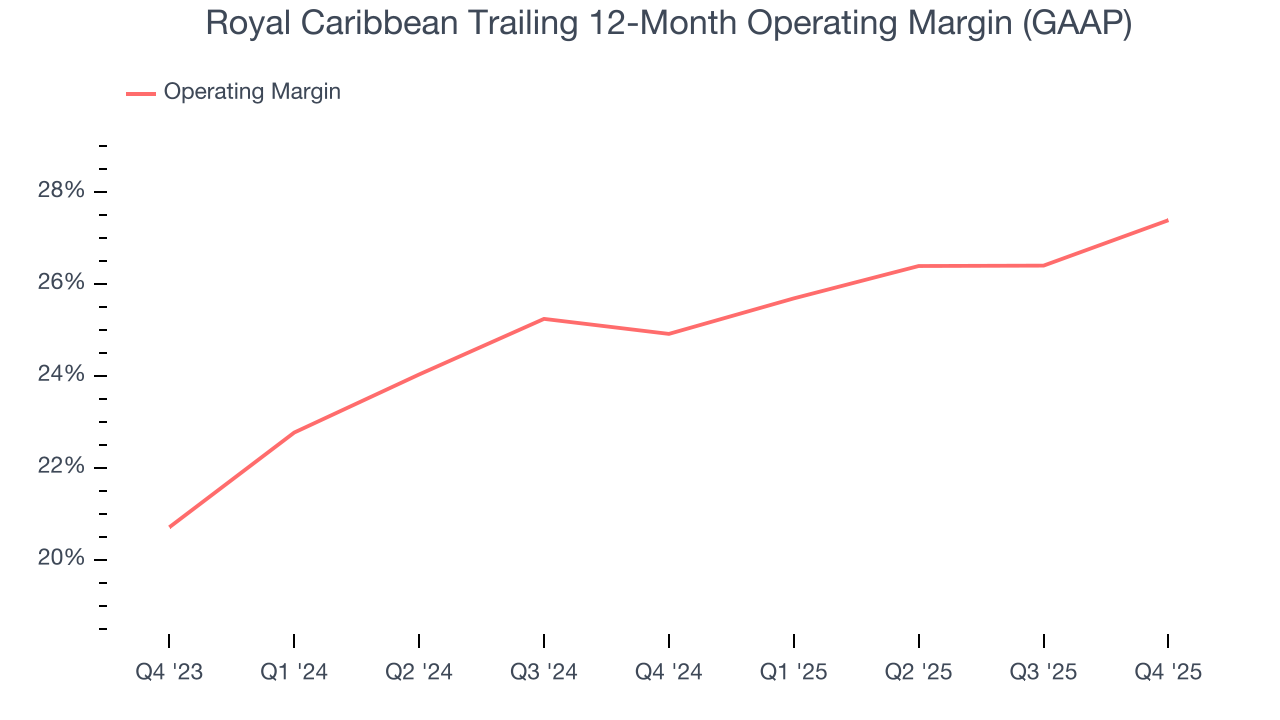
In Q4, Royal Caribbean generated an operating margin profit margin of 21.9%, up 5.3 percentage points year on year. This increase was a welcome development and shows it was more efficient.
7. Earnings Per Share
Revenue trends explain a company’s historical growth, but the long-term change in earnings per share (EPS) points to the profitability of that growth – for example, a company could inflate its sales through excessive spending on advertising and promotions.
Royal Caribbean’s full-year EPS flipped from negative to positive over the last five years. This is encouraging and shows it’s at a critical moment in its life.
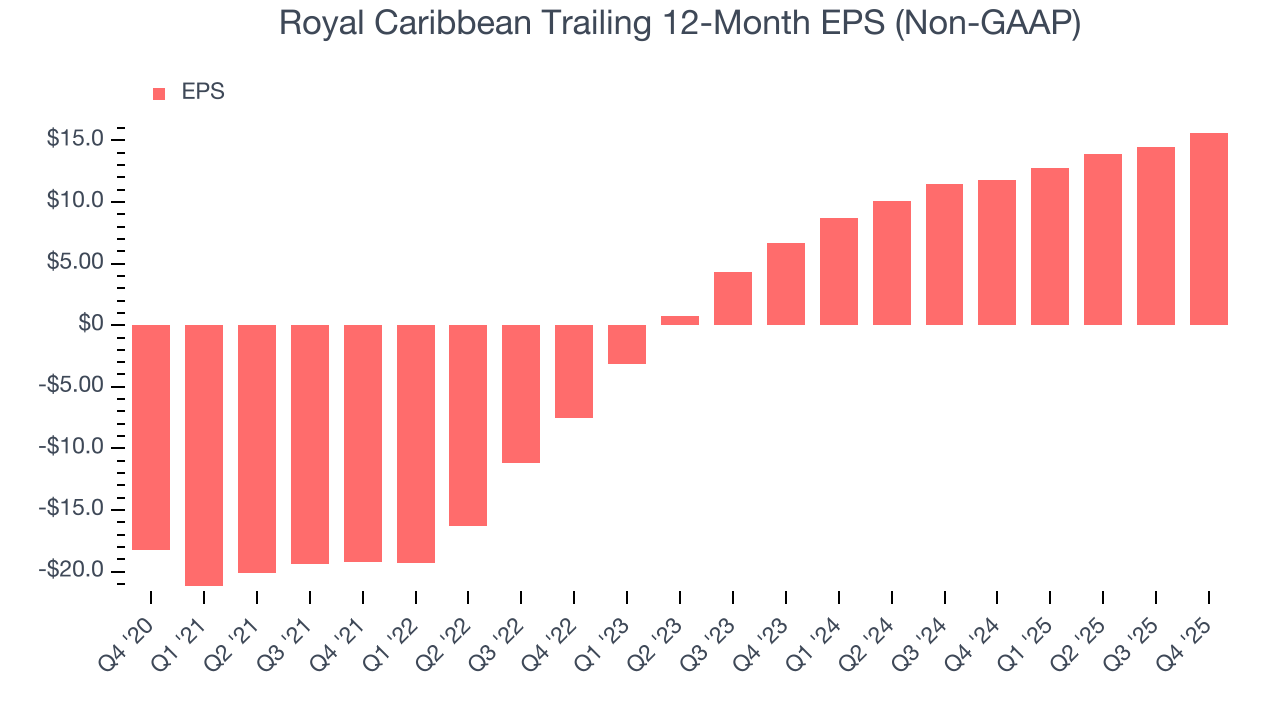
In Q4, Royal Caribbean reported adjusted EPS of $2.80, up from $1.63 in the same quarter last year. This print was close to analysts’ estimates. Over the next 12 months, Wall Street expects Royal Caribbean’s full-year EPS of $15.64 to grow 12.3%.
8. Cash Is King
Free cash flow isn't a prominently featured metric in company financials and earnings releases, but we think it's telling because it accounts for all operating and capital expenses, making it tough to manipulate. Cash is king.
Royal Caribbean has shown poor cash profitability over the last two years, giving the company limited opportunities to return capital to shareholders. Its free cash flow margin averaged 9.4%, lousy for a consumer discretionary business.
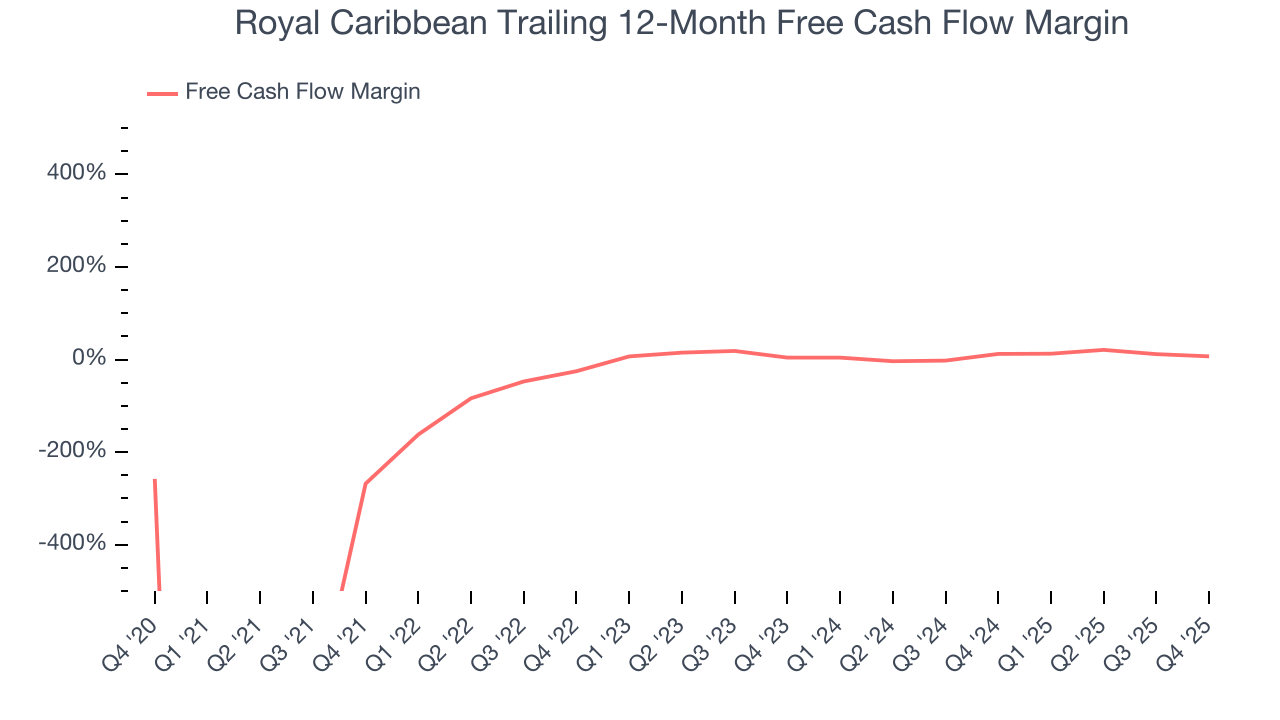
Royal Caribbean’s free cash flow clocked in at $116 million in Q4, equivalent to a 2.7% margin. The company’s cash profitability regressed as it was 21.6 percentage points lower than in the same quarter last year, prompting us to pay closer attention. Short-term fluctuations typically aren’t a big deal because investment needs can be seasonal, but we’ll be watching to see if the trend extrapolates into future quarters.
Over the next year, analysts predict Royal Caribbean’s cash conversion will improve. Their consensus estimates imply its free cash flow margin of 6.9% for the last 12 months will increase to 15.7%, giving it more flexibility for investments, share buybacks, and dividends.
9. Return on Invested Capital (ROIC)
EPS and free cash flow tell us whether a company was profitable while growing its revenue. But was it capital-efficient? Enter ROIC, a metric showing how much operating profit a company generates relative to the money it has raised (debt and equity).
Royal Caribbean historically did a mediocre job investing in profitable growth initiatives. Its five-year average ROIC was 4.7%, lower than the typical cost of capital (how much it costs to raise money) for consumer discretionary companies.
We like to invest in businesses with high returns, but the trend in a company’s ROIC is what often surprises the market and moves the stock price. Over the last few years, Royal Caribbean’s ROIC has increased. This is a good sign, but we recognize its lack of profitable growth during the COVID era was the primary reason for the change.
10. Balance Sheet Assessment
Royal Caribbean reported $825 million of cash and $22.04 billion of debt on its balance sheet in the most recent quarter. As investors in high-quality companies, we primarily focus on two things: 1) that a company’s debt level isn’t too high and 2) that its interest payments are not excessively burdening the business.
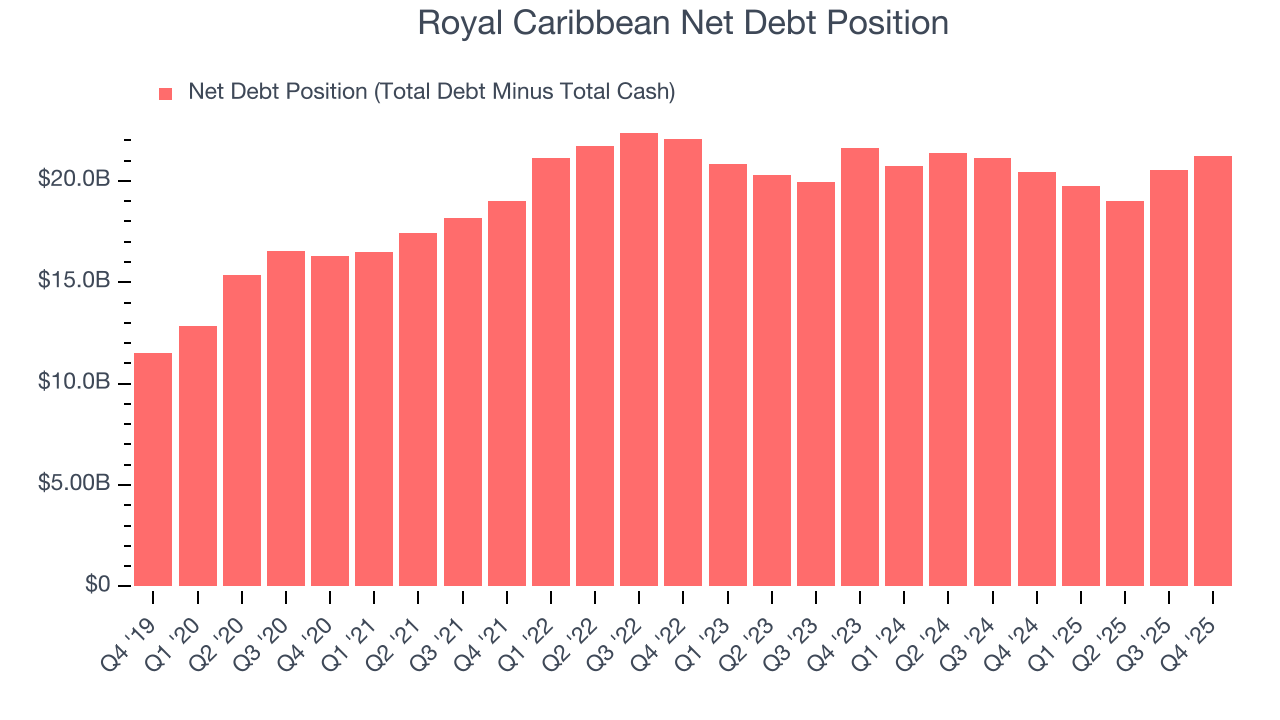
With $7.03 billion of EBITDA over the last 12 months, we view Royal Caribbean’s 3.0× net-debt-to-EBITDA ratio as safe. We also see its $438 million of annual interest expenses as appropriate. The company’s profits give it plenty of breathing room, allowing it to continue investing in growth initiatives.
11. Key Takeaways from Royal Caribbean’s Q4 Results
We were impressed by Royal Caribbean’s optimistic EPS guidance for next quarter, which blew past analysts’ expectations. We were also glad its full-year EPS guidance slightly exceeded Wall Street’s estimates. On the other hand, its number of passenger cruise days missed. Overall, this print had some key positives. The stock traded up 6.8% to $311.44 immediately after reporting.
12. Is Now The Time To Buy Royal Caribbean?
Updated: March 19, 2026 at 11:17 PM EDT
Are you wondering whether to buy Royal Caribbean or pass? We urge investors to not only consider the latest earnings results but also longer-term business quality and valuation as well.
Royal Caribbean falls short of our quality standards. Although its revenue growth was impressive over the last five years, it’s expected to deteriorate over the next 12 months and its number of passenger cruise days has disappointed. On top of that, the company’s relatively low ROIC suggests management has struggled to find compelling investment opportunities.
Royal Caribbean’s P/E ratio based on the next 12 months is 14.9x. While this valuation is reasonable, we don’t see a big opportunity at the moment. There are better stocks to buy right now.
Wall Street analysts have a consensus one-year price target of $363.50 on the company (compared to the current share price of $273.26).
Although the price target is bullish, readers should exercise caution because analysts tend to be overly optimistic. The firms they work for, often big banks, have relationships with companies that extend into fundraising, M&A advisory, and other rewarding business lines. As a result, they typically hesitate to say bad things for fear they will lose out. We at StockStory do not suffer from such conflicts of interest, so we’ll always tell it like it is.